
Downloaded from hlayiso.com
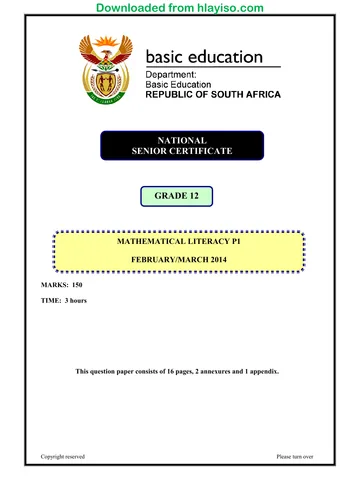
NATIONAL
SENIOR CERTIFICATE
GRADE 12
MATHEMATICAL LITERACY P2
FEBRUARY/MARCH 2014
MARKS: 150
TIME: 3 hours
This question paper consists of 14 pages and 2 annexures.
Copyright reserved Please turn over
You're offline
Skip to contentQuestion paper 
View all
%20June%202025%20Possible%20Answers--b592d0c3-9486-4357-be22-a8e995043cee/v1-cdd6cb1fcc7cfc379b4b/card.webp)
Mathematical Literacy P2 Feb March 2014 Eng hlayiso.com
Mathematical Literacy · Grade 12 · NSC Supplementary · 2014. Question paper, 16 pages. Read online or download the PDF.
- Subject
- Mathematical Literacy
- Grade
- Grade 12
- Document type
- Question paper
- Year
- 2014
- Exam period
- NSC Supplementary
- Paper
- 2
- Pages
- 16
- File size
- 873.5 KB
Loading document…
Loading document…
1 of 16
Document textSearch extracted text and jump to a page.
Downloaded from hlayiso.com
Mathematical Literacy/P2 2 DBE/Feb.–Mar. 2014
NSC
INSTRUCTIONS AND INFORMATION
1. This question paper consists of FIVE questions. Answer ALL the questions.
2. Answer QUESTION 1.3.3 on ANNEXURE A and QUESTION 2.2.2 on
ANNEXURE B. Write your centre number and examination number in the
spaces on the ANNEXURES and hand in the ANNEXURES together with your
ANSWER BOOK.
3. Number the answers correctly according to the numbering system used in this
question paper.
4. Start EACH question on a NEW page.
5. You may use an approved calculator (non-programmable and non-graphical), unless
stated otherwise.
6. Show ALL calculations clearly.
7. Round off ALL the final answers to TWO decimal places, unless stated otherwise.
8. Units of measurement MUST be indicated, where applicable.
9. Maps and diagrams are NOT necessarily drawn to scale, unless stated otherwise.
10. Write neatly and legibly.
Copyright reserved Please turn over
Downloaded from hlayiso.com
Mathematical Literacy/P2 3 DBE/Feb.–Mar. 2014
NSC
QUESTION 1
1.1 Mathys is the owner of Roseleigh farm. He makes bales of hay in order to feed his livestock
(cattle, sheep and horses) during winter.
[Hay is a mixture of grass, clover, barley and wheat plant materials.]
The hay is allowed to dry and then picked up by machines to be processed into cylindrical bales.
A cylindrical bale has a curved side and two circular ends, as shown in the photographs below.
The curved side of each bale is covered with a rectangular wrap in order to control moisture. The
wrap repels moisture but leaves the circular ends exposed so that the hay can breathe.
Photograph of cylindrical bale of hay Photograph of wrapped cylindrical bale of hay
Curved Curved area
area covered with
wrap
Circular
end Circular end
1.1.1 Each cylindrical bale has a radius of 70 cm. Its height is the same length
as the diameter.
The area of the wrap is 6% more than the curved area of the cylindrical
bale.
Calculate the area of the wrap required to cover the curved area of
ONE bale.
The following formula may be used:
Curved area of a cylinder = 2 × π × r × h
Use π = 3,14, where r = radius of the cylinder and h = height of the
cylinder. (6)
1.1.2 The bales must conform to a standard ratio of volume to total surface area
that is less than 25 : 1.
Determine, by calculation, whether Mathys's bales conform to the
standard ratio.
The following formulas may be used:
Volume of a cylinder = π × r2 × h
Total surface area of a cylinder = 2 × π × r (r + h)
Use π = 3,14, where r = radius of the cylinder and h = height of the
cylinder. (6)
Copyright reserved Please turn over
Downloaded from hlayiso.com
Mathematical Literacy/P2 4 DBE/Feb.–Mar. 2014
NSC
1.1.3 The temperature of each bale must be controlled to prevent fermentation
(decay due to moisture) and combustion (burning due to dryness).
The table below gives guidelines for actions to be taken for different
bale temperatures.
TABLE 1: Guidelines for actions to be taken for different bale
temperatures
Bale temperatures Action to be taken
Lower than 120 °F None
120 °F to 140 °F Separate from the rest of the bales to cool off
Higher than 140 °F Separate from the rest of the bales and destroy
Mathys measures the temperature of a specific bale. He finds it to be
55 °C and then destroys the bale.
Determine, showing ALL the necessary calculations, whether the action
taken by Mathys is correct.
The following formula may be used:
9
Temperature in °F = × Temperature in °C + 32°
5 (3)
1.2 Mathys has to transport the bales with a trailer.
The photograph below shows an example of a stack of two layers of bales loaded onto
a trailer.
Bottom layer with
2 rows of bales
Only the bottom layer of bales on the trailer consists of two rows of 6 bales each to
ensure balance. The 2nd layer of bales on the trailer consists of one row of 5 bales.
Each subsequent layer that has to be stacked has one less bale than the previous layer.
Determine the total number of bales that can be loaded onto the trailer in this way if
FOUR layers of bales are to be stacked. (5)
1.3 Mathys calculates that each cow needs to be fed an average of 12 kg of hay daily.
Each bale weighs 1 440 kg.
1.3.1 Determine the maximum number of days one bale will last if it is used to
feed 10 cows. (3)
1.3.2 Write down a simplified formula that can be used to calculate the
maximum number of days one bale will last if it is used to feed a number
of cows. (3)
1.3.3 Use the equation obtained in QUESTION 1.3.2, or otherwise, to draw a
curve, on ANNEXURE A, showing the maximum number of days one
bale can last if it is used to feed a number of cows. (5)
[31]
Copyright reserved Please turn over
Downloaded from hlayiso.com
Mathematical Literacy/P2 5 DBE/Feb.–Mar. 2014
NSC
QUESTION 2
The school governing body (SGB) of Onverwag High
School was concerned about the high cost of transporting
learners for educational excursions. It was decided to raise
funds to purchase a school bus in five years' time.
2.1 The current purchasing price of a new bus is R650 000,00.
Calculate the purchase price of a new bus at the end of five years if the purchase price
of a new bus increases by 7,2% per annum due to inflation.
The following formula may be used:
A = P(1 + i)n , where
A = increased value P = initial value
i = annual interest rate n = number of years (3)
2.2 The old students' union of Onverwag High School agreed to assist the SGB in raising
the funds to purchase a new school bus. A decision was made to have quarterly
meetings of the old students' union. Each old student attending would contribute
R400,00 per meeting. The meetings would only be held when at least 10 old students
attended. An amount of R1 000 would be given to the school to award the top
achievers in that quarter if more than 20 old students attended the quarterly meeting.
The balance of the quarterly contributions by the old students was donated towards
buying a new school bus and was deposited into a special savings account.
2.2.1 The following formula can be used to calculate the quarterly amount to be
donated towards buying a new school bus if 10 to 20 old students attend
the quarterly meeting:
Amount (in rand) = 400n
where n = the number of old students attending the meeting
Write down a formula that can be used to calculate the quarterly
contribution made towards buying a new school bus if more than
20 old students attended the quarterly meetings. (2)
2.2.2 Use the formulas in QUESTION 2.2.1 to draw TWO line graphs on
ANNEXURE B, showing the quarterly amount that the old students
contributed towards buying a new school bus at each meeting, if at least
10 old students and a maximum of 35 old students attended the meetings. (7)
Copyright reserved Please turn over
Downloaded from hlayiso.com
Mathematical Literacy/P2 6 DBE/Feb.–Mar. 2014
NSC
2.2.3 Use the formulas in QUESTION 2.2.1 or the graphs drawn for
QUESTION 2.2.2 to answer the following:
Determine the number of old students who attended a specific meeting if
an amount of R8 600 was contributed towards buying a new school bus. (2)
2.3 The SGB also made regular quarterly deposits of R40 000, which included the old
students' contribution, into a special savings account at the beginning of each quarter
over five years. The total accumulated amount of these savings including interest was
R911 408,73.
2.3.1 Calculate the total amount of interest earned over the five years. (4)
2.3.2 The attendance of old students at each quarterly meeting for the five years
was as follows:
• During the first year an average of 18 old students, but not more than
20, attended each meeting.
• During the next three years an average of 25 old students were
present at each meeting, but more than 20 always attended.
• During the last year an average of 35 old students were present at
each meeting, but more than 20 always attended.
The chairman of the SGB stated that the old students' unions contributed
25% of the total amount deposited into the special savings account.
Determine whether his statement is correct. (8)
[26]
Copyright reserved Please turn over
Downloaded from hlayiso.com
Mathematical Literacy/P2 7 DBE/Feb.–Mar. 2014
NSC
QUESTION 3
A new shopping mall has opened in Roseville. The layout plan as well as the store directory of
Roseville Shopping Mall is shown in the diagram below.
N Store Directory
1
Name Shop
Type of store number
Amani
6
2 3 4 Men's clothing
Cash 4 U
4
Pawn shop
5
Stitches
7
1 R Women's clothing
6 Aéro
9
Men's clothing
FOUNTAIN
Super Store
1
4 Groceries
2
Rings & Beads
13
Accessories
13 AE Food
7 8
Groceries
12 Ricks' Sport
3
Sport equipment
Hallmark
5
11 8 Cards & Gifts
9 Gems & Jewels
10 12
Jewellers
Pixi
11
3 Children's clothing
ZZ Bank
*
Entrance doors 2
Mall entrances Bank
to stores
Cafe Teen
10
Entrance doors Coffee shop
R ATM
to mall
3.1 Nkululeko and Peggy agree to meet at Cafe Teen.
3.1.1 Nkululeko enters the shopping centre through the western entrance.
Give the general direction that she will have to walk to reach AE Food. (2)
3.1.2 Peggy buys gifts at Hallmark.
Describe the route she has to take from Hallmark to walk to Cafe Teen. (2)
3.1.3 Name the store that cannot be entered from inside the mall. (1)
3.1.4 Nkululeko looks at the names and positions of stores given in the store
directory and remarks that she finds the store directory confusing.
Give TWO possible reasons to support her remark. (2)
3.1.5 Determine the probability that if Peggy randomly chose to visit one of the
stores, this store would be a clothing store. (2)
Copyright reserved Please turn over
Downloaded from hlayiso.com
Mathematical Literacy/P2 8 DBE/Feb.–Mar. 2014
NSC
3.2 The Hallmark store is in the shape of a pentagon. The floor plan of the store has the
following dimensions as indicated in the diagram below:
Floor plan of the store
13,9 m
2,3 m
10,4 m
5,8 m
3.2.1 Calculate the total floor area of the store.
You may use the following formulae:
Area of a rectangle = length × breadth
1
Area of a triangle = × base × height
2
1
Area of a trapezium = × (sum of the parallel sides ) × height
2 (6)
3.2.2 Use the dimensions given for the Hallmark store. Determine, using
accurate measurement, the distance (to the nearest 10 metres) from the
northern entrance door to the southern entrance door of the mall. (4)
3.2.3 Hallmark's entrance has a frame
security curtain gate, which is
shown in the photograph
alongside.
The security curtain gate,
3m
excluding the frame, has a
mass of 4,7 kg/m2.
The material that is used to
make the security curtain gate, frame
excluding the frame, costs 4m
R12,50 per kilogram. Photograph of security curtain gate
If the dimensions of the curtain gate, excluding the frame, are 3 m × 4 m,
determine whether the cost of the material to make the security curtain gate
exceeds R800. (5)
Copyright reserved Please turn over
Downloaded from hlayiso.com
Mathematical Literacy/P2 9 DBE/Feb.–Mar. 2014
NSC
3.3 The manager of the shopping mall kept a record of the number of visitors to the shopping
mall during the first four weeks.
VISITORS TO THE SHOPPING MALL
DURING THE FIRST FOUR WEEKS
25 000
20 000
Number of visitors
15 000 Week 1
Week 2
10 000 Week 3
Week 4
5 000
0
Sunday
Wednesday
Monday Tuesday Thursday Saturday
Friday
Days of the week
3.3.1 On which day of the week did the shopping mall open for business for the
first time? Explain your answer. (2)
3.3.2 The mall manager stated that the mall was the busiest from Fridays to
Sundays.
Explain why the manager was justified in making this statement. (2)
3.3.3 Determine the week and the day during which the shopping mall had the
least number of visitors. (2)
[30]
Copyright reserved Please turn over
Downloaded from hlayiso.com
Mathematical Literacy/P2 10 DBE/Feb.–Mar. 2014
NSC
QUESTION 4
4.1 Thandi is a Grade 12 learner who is interested in the composition of the South
African population. She found information from Census 2011 about the population
distribution of South Africa during 2001 and 2011.
TABLE 2 below shows the population distribution of South Africa during 2001 and
2011, according to race.
NOTE: In South Africa citizens are classified as black, coloured, white or Indian.
TABLE 2: Population distribution of South Africa during 2001 and 2011,
according to race
PERCENTAGE OF DIFFERENT
TOTAL
RACE GROUPS
POPULATION
Black Coloured White Indian
2001 79,0 8,9 9,6 2,5 44 819 778
2011 P 9,0 8,9 2,5 51 770 560
[Source: Statsa.gov.za]
4.1.1 Determine, using the value of P, the number of black people in South
Africa in 2011. (4)
4.1.2 In 2001, 48,36% of white people in South Africa were male.
Thandi calculated that the actual number of white males in South Africa
in 2001 was 2 080 780.
Determine whether Thandi's calculation is correct. (5)
4.1.3 Thandi stated that the actual number of Indians in South Africa was the
same in 2001 and 2011.
Determine, showing ALL calculations, whether her statement is valid. (3)
Copyright reserved Please turn over
Downloaded from hlayiso.com
Mathematical Literacy/P2 11 DBE/Feb.–Mar. 2014
NSC
4.2 The table below shows data relating to the gender and age of the South African
population for 1996, 2001 and 2011.
TABLE 3: South African population according to gender and age
Census Year
1996 2001 2011
Male 19 520 887 21 434 041 25 188 791
Gender
Female 21 062 685 23 385 737 26 581 769
0–14 13 766 443 14 365 288 15 100 089
Age
15–64 24 882 465 A 33 904 480
(in years)
65 and older 1 934 664 2 215 211 2 765 991
[Source: Statsa.gov.za]
4.2.1 (a) Determine the missing value A. (2)
(b) The ratio of males to females during 1996 was approximately
1 : 1,08.
Use this ratio to determine the gender distribution of 100 babies born
during 1996. (3)
4.2.2 The dependency percentage is used to calculate the percentage of people
in a population that are dependent upon other people due to their age.
The following formula is used to calculate the dependency percentage:
n + m
Dependency percentage = × 100%
p
where:
n = the number of persons 0–14 years
p = the number of persons 15–64 years
m = the number of persons 65 years and older
(a) Calculate the difference between the dependency percentages of the
South African population from 1996 to 2011. (5)
(b) Hence, give a possible reason for the change in the dependency
percentage of the South African population from 1996 to 2011. (2)
Copyright reserved Please turn over
Downloaded from hlayiso.com
Mathematical Literacy/P2 12 DBE/Feb.–Mar. 2014
NSC
4.3 Thandi lives in Port Elizabeth and wanted to know how many learners in South Africa
own at least one cellphone. She could not find this data anywhere and decided to do her
own survey in ten schools in her city.
TABLE 4 below shows the data collected from the ten schools, which have an average
of 1 400 learners.
TABLE 4: Survey of learners who own at least one cellphone
School 1 2 3 4 5 6 7 8 9 10
Number
of 814 921 1 201 1 290 Q 966 864 P 828 829
learners
4.3.1 School 8 has the smallest number of learners who own cellphones and
School 5 does not have the highest number of learners who own
cellphones.
Calculate the missing value P if the range of the number of learners who
own at least one cellphone is 569. (3)
4.3.2 Hence, calculate the missing value Q if the mean number of learners who
own at least one cellphone is 936. (4)
4.3.3 Hence, calculate the median number of learners who own at least one
cellphone. (3)
4.3.4 Thandi concluded from the data that more than 70% of learners in South
Africa own at least one cellphone.
Paul stated that her conclusion was not valid.
Give TWO possible reasons to justify Paul's statement. (4)
[38]
Copyright reserved Please turn over
Downloaded from hlayiso.com
Mathematical Literacy/P2 13 DBE/Feb.–Mar. 2014
NSC
QUESTION 5
Financial institutions granting home loans use a loan factor table to determine the monthly
repayment on a home loan.
TABLE 5 below is a loan factor table that shows the monthly repayments per R1 000 on a home
loan with interest rates ranging from 14,25% to 16% per annum, over 15, 20, 25 or 30 years.
TABLE 5: Loan factor table for calculating monthly repayments on a home loan
per R1 000
Annual Interest LOAN FACTOR
Rate 15 years 20 years 25 years 30 years
14,25% 13,49 12,62 12,23 12,05
14,50% 13,66 12,80 12,42 12,25
14,75% 13,83 12,98 12,61 12,44
15,00% 14,00 13,17 12,81 12,64
15,25% 14,17 13,35 13,00 12,84
15,50% 14,34 13,54 13,20 13,05
15,75% 14,51 13,73 13,39 13,25
16,00% 14,69 13,91 13,59 13,45
[Source: Property and Tax Guide 2012]
The monthly repayment can be calculated using the following formula:
Monthly repayment (in rand) = (loan amount ÷ 1 000) × loan factor
5.1 The National Credit Act (NCA) stipulates that the home loan amount that a person
qualifies for should be calculated based on disposable income*.
[*Disposable income – the total amount of money a person has available in a month,
after all compulsory expenses have been deducted from the person's gross salary]
Pragashni is planning to buy a house and has a disposable income of R17 550
per month.
5.1.1 Calculate the maximum loan amount she qualifies for if she wants to take
a loan over 25 years at an interest rate of 15,25% per annum. (4)
5.1.2 Give TWO possible reasons why it would not be advisable for her to take
the full maximum loan amount that she qualifies for. (4)
Copyright reserved Please turn over
Downloaded from hlayiso.com
Mathematical Literacy/P2 14 DBE/Feb.–Mar. 2014
NSC
5.2 Pragashni has home loan options from EP Bank and STL Bank. To make
a comparison, she summarised the two options in TABLE 6 below.
TABLE 6: Comparison of home loan options
EP BANK STL BANK
Loan amount R1 100 000 R1 100 000
Loan period in years 25 20
Annual interest rate 15,25% 16%
Total repayment R4 290 000 x
5.2.1 Determine, showing ALL calculations, which home loan option will be
advisable for her to choose by using the missing value for x.
Give ONE reason for this choice. (8)
5.2.2 She can afford a maximum of R13 255 for her monthly repayments.
Determine, showing ALL calculations, the period and interest rate that
will best suit her needs. (5)
5.3 Line A in the graph below shows the loan option that was offered to Pragashni by
EP Bank at an interest rate of 15,25% per annum.
TOTAL REPAYMENTS TO EP BANK FOR A LOAN AMOUNT OF
R1 100 000 AT DIFFERENT INTEREST RATES
5000 000
4500 000 Line C
Line A
4000 000
Line B
Total repayments (in rand)
3500 000
3000 000
2500 000
2000 000
1500 000
1000 000
500 000
0
0 60 120 180 240 300
Number of months
Identify the line that shows a loan option at 14,25% and the line that shows a loan
option at 16%. Give a reason for your answer. (4)
[25]
TOTAL: 150
Copyright reserved
Downloaded from hlayiso.com
Mathematical Literacy/P2 DBE/Feb.–Mar. 2014
NSC
CENTRE NUMBER:
EXAMINATION NUMBER:
ANNEXURE A
QUESTION 1.3.3
MAXIMUM NUMBER OF DAYS ONE BALE WILL LAST
TO FEED A NUMBER OF COWS
140
120
100
Maximum number of days
80
60
40
20
0
0 5 10 15 20 25 30 35 40
Number of cows
Copyright reserved
Downloaded from hlayiso.com
Mathematical Literacy/P2 DBE/Feb.–Mar. 2014
NSC
CENTRE NUMBER:
EXAMINATION NUMBER:
ANNEXURE B
QUESTION 2.2.2
QUARTERLY CONTRIBUTION BY OLD STUDENTS' UNION TOWARDS
BUYING A NEW SCHOOL BUS
14 000
12 000
10 000
Amount (in rand)
8 000
6 000
4 000
2 000
0
0 5 10 15 20 25 30 35
Number of alumni members
Copyright reserved
Recommended for this subject
Published documents with matching subject and grade metadata.
Question paper
Maths LIT Grade 12 NSC P1 QP September 2025 Free State
Question paper
Maths LIT Grade 12 NSC P1 QP September 2025 Limpopo
Question paper
Maths LIT Grade 12 NSC P2 QP September 2025 Limpopo
Question paper
Maths LIT Grade 12 NSC P2 QP September 2025 North West
Question paper
MATHS LIT P1 GR12 QP JUNE 2024 English hlayiso.com
Question paper
MATHS LIT P2 GR12 QP JUNE 2024 English hlayiso.com
Related documents
Matched using subject, grade, language, document type and exam metadata.
Question paper
Mathematical Literacy P1 Feb March 2014 Eng hlayiso.com
Question paper
Maths Lit P2 June 2014 QP hlayiso.com
Question paper
Mathematical Literacy P2 Feb March 2013 Eng hlayiso.com
Question paper
MATHS LIT P1 JUNE 2014 GRADE 12 hlayiso.com .doc 03 04 2014 hlayiso.com
Question paper
MATHS LIT P2 QP GR12 JUNE 2023 Afrikaans
Question paper
MATHS LIT P2 ADD GR12 JUNE 2023 English
More from Grade 12 Mathematical Literacy
Explore more published documents in this catalogue.
Memorandum
MATHS LIT P1 GR12 MEMO JUNE 2025 AFRIKAANS FINAL
Addendum
MATHS LIT P2 GR 12 SEPT 2025 ADDENDUM AFR
Memorandum
Maths LIT Grade 12 NSC P1 MEMO September 2025 Free State
Memorandum
Mathematical Literacy P1 (English) June 2025 Possible Answers
Addendum
Maths LIT Grade 12 NSC P1 ANSWER BOOK September 2025 KZN
Memorandum