
Study & Master
Support Pack | Grade 11
CAPS
Geography
Resources and sustainability – skills
and techniques
This support pack for the Resources and sustainability – skills and
techniques module in the Geography Grade 11 CAPS curriculum
provides valuable revision activities. All activities have the answers
provided. Learners can work through these individually at home or
these could form the basis of a catch-up class or online lesson. You
have permission to print or photocopy this document or distribute it
electronically via email or WhatsApp.
For more information on our Study & Master CAPS-approved
textbooks and valuable resource materials, visit
www.cambridge.org
Brighter Thinking | Better Learning
Skip to contentStudy guide 
View all
GEO 11 Support Pack for Resources and sustainability skills and techniques
Grade 11 Geography study guide, 7 pages. Read online or get the free PDF download.
Publisher: Study & Master
Geography · Grade 11. Study guide, 7 pages. Read online or download the PDF.
- Subject
- Geography
- Grade
- Grade 11
- Document type
- Study guide
- Publisher
- Study & Master
- Curriculum
- CAPS
- Pages
- 7
- File size
- 3.3 MB
Loading document…
Loading document…
1 of 7
Document textSearch extracted text and jump to a page.
Resources and sustainability – skills and techniques
QUESTION 1 c) Is there any evidence on this map of:
Choose the correct underlined word/words for each i) running water
statement. Write down the question number and the ii) standing water?
underlined word/words only. d) What is the mean altitude of this area?
1. Weather generally changes on a daily/annual/ e) There is strong evidence of two types of
decadal/millennial basis. human activity on this map. What are they?
2. GIS stands for Geographical Information f) With which activity might the sink holes
Series/Geographical Inertia Series/Geographical (centre of the map) be connected?
Information System/Geology Inside Stars. g) How far away is Vlaklaagte by road from the
3. Orthophoto maps are typically drawn to a scale of northern edge of the map? [20]
1:10 000/1:20 000/1:50 000/1:100 000.
4. Meteorology is essentially the chemistry of the QUESTION 4
atmosphere/the make-up of the atmosphere/the data Explain the difference between shape, shadow,
of the atmosphere/the physics of the atmosphere. tone, texture and pattern on an orthophoto or a
5. With a vertical aerial photograph 1/5/50/100 photograph. [10]
points are directly below the camera lens. (5×2)
[10] QUESTION 5
QUESTION 2 Briefly explain how information is organised and
Choose whether the statement is True or False. Write analysed in a GIS. [10]
down the question number and ‘T’ or ‘F’ only.
1. Climatology and meteorology are the same thing. QUESTION 6
2. The electromagnetic spectrum includes the visible Use the topographical map extract from sheet 2925CC
spectrum. Witbank (Figure 1 on page 3) and the satellite image
3. The electromagnetic spectrum includes radio extract (Figure 2 on page 4), and answer the following
waves. questions.
4. A camera is a remote sensing device. 1. Are the map and the image to the same scale?
5. Satellites never orbit the Earth at heights greater 2. Which is older, the map or the image? Explain.
than 100 kilometres. (5×1) 3. You should have identified mining as one of the
[5] major human activities in this area. What do you
QUESTION 3 think is mined here?
1. Define the following terms: 4. Which is of more help in identifying
a) topography environmental impacts in the area: the map or the
b) contour line satellite image? Explain.
c) cross-section 5. Which is more helpful in giving specific names to
d) vertical exaggeration the mining operations? Explain.
e) intervisibility 6. Assume there is acid mine drainage (sulphur) in
f) gradient the area covered by the map and the satellite image.
2. Use the topographical map extract from sheet Assume that the GIS layers in Figure 3 cover the
2925CC Witbank on page 3 (Figure 1) and same area. As part of an environmental plan to
answer the following. You may need to refer back control the problem, identify five useful layers that
to Module 4 in order to answer a few of these would contribute to understanding this landscape in
questions: terms of the drainage problem. [13]
a) What does the line with the label 05' at the
top of the map extract represent?
b) Describe the relief in the northern half of the
map in a sentence or two.
S T U DY & M A S T E R R e s o u r c e s a n d s u s t a i n a b i l i t y – s k i l l s a n d t e c h n i q u e s 1
QUESTION 7 QUESTION 8
Define: Give the opposite, or opposite term, for each of
1. scale the following as they are used in remote sensing and
2. distortion GIS:
3. resolution 1. low-angle oblique
4. spectrum 2. variable
5. isoline(5×2) 3. vertical
[10] 4. low resolution
5. geostationary(5×1)
[5]
[Total: 83 marks]
GIS data layers
summary (composite)
layer
top
E
D
C
B
A
base
Figure 3 Overlays (either in a GIS or on tracing
paper) allow a summary layer (top), which can be
used to solve a problem or answer a question.
2 S T U DY & M A S T E R S U P P O R T PA C K
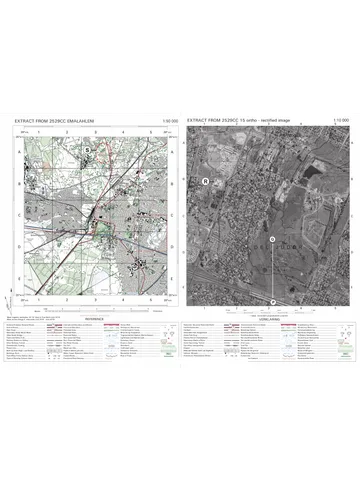
Figure 1 Topographical map extract from sheet 2925CC Witbank
S T U DY & M A S T E R R e s o u r c e s a n d s u s t a i n a b i l i t y – s k i l l s a n d t e c h n i q u e s 3
Figure 2 Witbank satellite image extract of the Kromdraai vicinity
4 S T U DY & M A S T E R S U P P O R T PA C K
Answers
QUESTION 1 e) mining activities as indicated by the words ✓
1. daily ✓✓ mine, opencast mine, and diggings; secondly,
2. Geographical Information System ✓✓ agriculture as evidenced by the symbols for
3. 1:10 000 ✓✓ cultivated land ✓
4. the physics of the atmosphere ✓✓ f) mining, with subsequent collapse of old
5. 1 ✓✓ (5×2) underground workings ✓
[10] g) 59 kilometres, as evidenced by 59 km in the
QUESTION 2 map margin ✓ [20]
1. F ✓ (Climatology is long-term [average] weather
while meteorology is short-term weather.) QUESTION 4
2. T ✓ Shape: There are many physical and human-made
3. T ✓ objects on the Earth’s surface with instantly recognisable
4. T ✓ shapes. ✓ In general, straight, rectilinear features on the
5. F ✓ (Meteosat, for example, orbits at thousands of surface are of human origin, while natural objects have
kilometres from the Earth.) (5×1) more rounded shapes. ✓
[5] Shadow: Virtually all remotely sensed data are collected
QUESTION 3 within two hours of solar noon to avoid extended
1. a) topography: natural (relief, drainage, shadows in the image or photograph. ✓ However,
vegetation) and human-made features shadows cast by an object (tall chimney stacks for
(borders, farm boundaries, roads, railways, example) can help us identify the objects. ✓
settlements, agriculture) ✓✓ Tone: Colour and (in black and white images) shades of
b) contour line: lines joining points of equal grey (black through to white) are referred to as tone. ✓
altitude (height) above sea level ✓ The darker an object appears, the less the amount
c) cross-section: a vertical cut or slice through of light it reflects. ✓ Colour aids in the process of
a landform or other feature, which shows photograph interpretation; water is greenish to blue, for
differences in height in profile (side) view ✓✓ example. Snow is white. ✓
d) vertical exaggeration: the factor by which the Texture: Texture is defined as the placement and
vertical scale on a cross-section is enlarged arrangement of repetitions of tone or colour in
(exaggerated) over the horizontal scale in an image. ✓ Texture may be described as smooth
order to make features stand out better ✓✓ (uniform), intermediate and rough (coarse). ✓ An
e) intervisibility: whether a point on the ground example of texture could be the smoothness of a tarred
is visible from another point (if there is an road, or the roughness of a forest of trees. ✓
object or feature in between two points, they Pattern: Pattern is the spatial arrangement of objects in
will not be intervisible) ✓✓ the landscape. The objects may be arranged randomly
f) gradient: the steepness of a slope, usually or systematically. ✓ They can be natural, as with a
expressed as an angle measured from the drainage pattern of a river, or human-made, for example
horizontal, or as a ratio (for example, 1 in rows of maize. ✓ Patterns are often described as
10) ✓✓ random, systematic, circular, oval, linear, rectangular,
2. a) five minutes of longitude ✓ and curvilinear. ✓
b) very flat; there are only a couple of contour (A maximum of TWO marks for each of shape,
lines and a spot height or two indicated ✓ shadow, tone, texture, pattern.) [10]
c) i) yes, the Klipspruit in the southeast and
the Kromdraai stream in the west ✓ QUESTION 5
ii) yes, the Kromdraai wetland, and a GIS data are of two different types: spatial and
number of small farm dams ✓ attribute data. Spatial data are used to provide the
d) as evidenced from the spot heights (1437, visual representation of a geographic space and
1523, 1495, 1477, 1513, 1509), approximately are stored as raster and vector types. ✓ Vector
1 492 metres ✓ data represent features as discrete points, lines and
polygons. ✓ Raster data represent the landscape as a
S T U DY & M A S T E R R e s o u r c e s a n d s u s t a i n a b i l i t y – s k i l l s a n d t e c h n i q u e s 5
rectangular matrix of square cells. ✓ Spatial data are 6. • relief ✓
the data needed to generate a map. ✓ Points, lines • drainage and standing water ✓
and areas are used. ✓ We need coordinates (points), • location of mining operations ✓
lines and areas (polygons) to do this. ✓ Attribute • roads and other communication lines ✓
data are the data (information) associated with the • agriculture ✓ [13]
points, lines and areas. ✓ Attribute data are used in
combination with spatial data to create a GIS. ✓ The QUESTION 7
better and more detailed and relevant the attribute 1. scale: the ratio between distance in reality (on the
data, the more reliable and the higher the quality of ground) and distance on the map (which represents
the GIS outputs. ✓ The result is a better analysis and this reality) ✓✓
management tool. Attribute data may be qualitative 2. distortion: not true to shape; if you enlarge one axis
(description) or quantitative (measurements) in of an image, and not the other, you have distorted
nature. ✓ [10] the image (as in a vertical exaggeration) ✓✓
3. resolution: the amount of detail; with high
QUESTION 6 resolution, there is lots of detail; with low resolution,
1. Yes, because if you pick two points on the map, there is far less detail ✓✓
and find the same two points on the satellite 4. spectrum: range from highest to lowest, or
image, the distance between the two points is the shortest to longest in the case of electromagnetic
same. ✓✓ waves ✓✓
2. The map is older; there are features (mining) 5. isoline: a line joining points of equal value;
on the satellite image that do not appear on the contours are height isolines; isohyets are rainfall
map. ✓ isolines; isobars are pressure isolines ✓✓ (5×2)
3. Coal mining. These mines on the Highveld [10]
coalfields (the map extract is from 2925CC QUESTION 8
Witbank) provide coal for the big power stations, 1. low-angle oblique – high-angle oblique ✓
such as Kendal (Figure 8.8 on page 145). ✓✓ 2. variable – constant ✓
4. Probably the image, as it actually shows the scars 3. vertical – horizontal ✓
left by mining. The map gives names, but does not 4. low resolution – high resolution ✓
have the visual impact of the image. ✓✓ 5. geostationary – variable orbit ✓ (5×1)
5. Definitely the map, where mining operations are [5]
clearly labelled. ✓ [Total: 83 marks]
6 S T U DY & M A S T E R S U P P O R T PA C K
Study this subject
Notes, quizzes and topic questions for Grade 11 Geography.
- Grade 11 Geography notes
CAPS revision notes with worked examples.
- Geography questions by topic
Past exam questions sorted by CAPS topic, with memos where available.
- Grade 11 Geography quizzes
Short topic quizzes with instant feedback.
- All Grade 11 Geography past papers
Past papers by year, with memos where available.
- Grade 11 Study guides
More Geography and other subjects in this collection.
Recommended for this subject
More papers and memos for this grade and subject.
Memorandum
Geography Grade 11 Paper 1 Eastern Cape November 2025 Memo
Memorandum
Geography Grade 11 P2 Eastern Cape November 2025 Memo (English)
Question paper
Geography Grade 11 P1 Eastern Cape November 2025 Question Paper
Question paper
Geography Grade 11 P2 Eastern Cape November 2025 Question Paper
Question paper and memo
Geography Grade 11 Free State March Test 2025 Paper & Memo
Memorandum
Geography Grade 11 Paper 1 Eastern Cape November 2024 Memo
Related documents
Question paper
Geography Grade 11 P2 Eastern Cape November 2024 QP (Eng)
Question paper
Geography Grade 11 P2 North West November 2024 QP (Eng)
Memorandum
Geography Grade 11 P1 Eastern Cape November 2023 Memo (English)
Question paper
Geography Grade 11 P2 Eastern Cape November 2023 QP (Afr)
Question paper
Geography Grade 11 MAPS 2023 Question Paper
Question paper
Geography Grade 11 MAPS 2023 Question Paper
More from Grade 11 Geography
Question paper
Geography Grade 11 Paper 2 MAPS 2023 Question Paper
Question paper
Geography Grade 11 Paper 2 MAPS 2023 Question Paper
Question paper
Geography Grade 11 Paper 2 MAPS 2023 Question Paper
Memorandum
Geography Grade 11 P1 Eastern Cape November 2022 Memo (English)
Memorandum
Geography Grade 11 P2 Eastern Cape November 2022 Memo (Afrikaans)
Memorandum