
Via Afrika
Geography
Grade 11 Teacher’s Guide
For me, it’s all about the ‘light bulb moment’.
Grade 11 Study Guide
P.A.D. Beets, S. Gear, A.W. Hambly, J.A. Jacobs, K. Najjaar,
— Mzi Nyathi, Teacher G. Samaai, Z.P.L. Shabalala
Via Afrika understands, values and supports your role as a teacher. You have the most important job in education, and we
Via Afrika Geography
realise that your responsibilities involve far more than just teaching. We have done our utmost to save you time and make
your life easier, and we are very proud to be able to help you teach this subject successfully. Here are just some of the things
we have done to assist you in this brand-new course:
1. The series was written to be aligned with CAPS. See page 5 to see how CAPS requirements are met.
2. A possible work schedule has been included. See page 5 to see how much time this could save you.
3. Each topic starts with an overview of what is taught, and the resources you need. See page 64 to find out how this will
help with your planning.
4. There is advice on pace-setting to assist you in completing all the work for the year on time. Page 25 shows you how this
is done.
5. Advice on how to introduce concepts and scaffold learning is given for every topic. See page 66 for an example.
6. All the answers have been given to save you time doing the exercises yourself. See page 146 for an example.
7. Also included is a CD filled with resources to assist you in your teaching and assessment. See the inside front cover.
The accompanying Learner’s Book is written in accessible language and contains all the content your learners need to master.
The exciting design and layout will keep their interest and make teaching a pleasure for you.
We would love to hear your feedback. Why not tell us how it’s going by emailing us at geography@viaafrika.com?
Alternatively, visit our teacher forum at www.viaafrika.com.
Language: English
ISBN: 978-1-415-42270-0
9 78 1 4 1 5 42 2700 www.viaafrika.com
Skip to contentStudy guide 
View all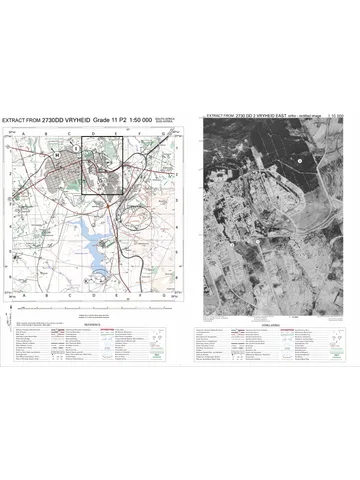
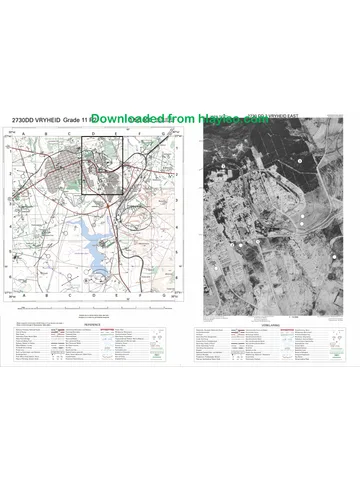
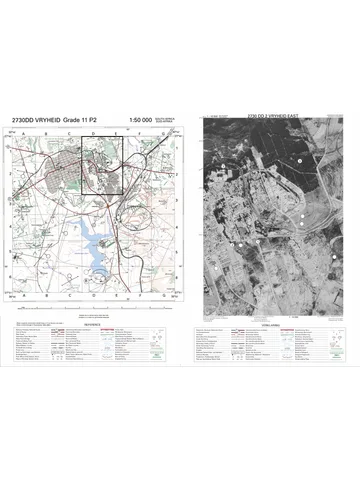
Gr11 Geography Study Guide LR
Grade 11 Geography study guide, 160 pages. Read online or get the free PDF download.
Publisher: Via Afrika
Geography · Grade 11. Study guide, 160 pages. Read online or download the PDF.
- Subject
- Geography
- Grade
- Grade 11
- Document type
- Study guide
- Publisher
- Via Afrika
- Curriculum
- CAPS
- Pages
- 160
- File size
- 4.0 MB
Loading document…
Loading document…
1 of 160
Document textSearch extracted text and jump to a page.
S t ud y G ui de
Geography
Grade 11
ISBN: 978-1-41546-319-2
Contents
Contents
General Introduction ............................................................................................ 1
Introduction to geographical skills and techniques................................................ 2
Unit 1 Mapwork skills ........................................................................................... 2
Unit 2 Working with 1:50 000 topographic maps .................................................... 7
Unit 3 Aerial photographs and orthophoto maps .................................................. 11
Unit 4 Geographical Information Systems ........................................................... 14
Unit 5 Using atlases ............................................................................................17
Unit 6 Fieldwork................................................................................................. 19
Questions ......................................................................................................... 20
Topic 1 The atmosphere...................................................................................... 22
Unit 1 The Earth’s energy balance ....................................................................... 22
Unit 2 Global air circulation ................................................................................ 28
Unit 3 Africa’s weather and climate ..................................................................... 40
Unit 4 Droughts and desertification .................................................................... 46
Questions ..........................................................................................................51
Topic 2 Geomorphology ..................................................................................... 56
Unit 1 Topography associated with horizontally layered rocks .............................. 56
Unit 2 Topography associated with inclined rock strata ....................................... 59
Unit 3 Topography associated with massive igneous rocks .................................. 62
Unit 4 Slopes ..................................................................................................... 65
Unit 5 Mass movements and human responses ................................................... 68
Questions ......................................................................................................... 72
Topic 3 Development geography ......................................................................... 80
Unit 1 The concept of development ..................................................................... 80
Unit 2 Frameworks for development .................................................................... 86
Unit 3 Trade and development ............................................................................ 90
Unit 4 Development issues and challenges ......................................................... 95
Unit 5 Role of development aid ........................................................................... 99
Questions ....................................................................................................... 102
© Via Afrika Publishers » G e o g r a p h y 11 Study Guide eBook
Contents
Topic4 Resources and sustainability ................................................................. 109
Unit 1 Using resources ..................................................................................... 109
Unit 2 Soils and soil erosion .............................................................................. 112
Unit 3 Conventional energy sources and their impact on the environment ............ 117
Unit 4 Non-conventional energy sources ............................................................ 121
Unit 5 Energy management in South Africa ......................................................... 125
Questions ....................................................................................................... 128
Exam Papers.....................................................................................................132
Answers .......................................................................................................... 144
© Via Afrika Publishers » G e o g r a p h y 11 Study Guide eBook
General Introduction
Introduction to our Geography 11 Study Guide eBook
Welcome to the Grade 11 Geography Study Guide. The subject of Geography has
changed considerably over time and it continues to change because it is one of the most
dynamic subjects in the curriculum. The Earth and its atmosphere, the home of
humankind, is changing all the time and that is what makes our subject so special.
This guide must be used in conjunction with the main textbook, as it is a summary of
the main components of the textbook. Geography, like any other subject, does contain
facts which must be understood and learnt, but it also emphasises skills. It is necessary
for the learner to analyse and use these facts to understand phenomena and to try to
solve problems. Our lives depend on the ways in which we treat our environment. Thus,
as citizens of the Earth, we must understand the changes that are constantly taking
place and our own impact on our surroundings.
Geography is all around us at all times. Get into the habit of looking at a city, town,
village, landscape and trying to work out the processes that act on it. Why is that shop
there, why are there so many people there, why is that hill shaped liked that, how is
that river being used? These are the sort of questions that you must get into the habit of
asking yourself and trying to answer. Do this regularly and you will be a much better
Geographer.
Once you have studied the detail in the main textbook, use this guide as a summary.
Concentrate on the key concepts and build your knowledge around them. Do this
regularly and you will develop into a genuine geographer ready to take your place as a
keeper of our vital environment.
© Via Afrika Publishers » G e o g r a p h y 11 Study Guide eBook 1
Introduction to geographical skills and techniques
Introduction to geographical skills and
techniques
Introduction
The aim of this topic is to explain the good skills and techniques you need to become
geographically literate and to develop a sense of the spaces and area around you. Maps
are the language of geography. To become a good map user you must be familiar with
the necessary skills and techniques. You also need to be able to apply them in everyday
situations.
Unit 1 Mapwork skills
1 Locating exact position (revision)
You can find any place on Earth by finding the point at which its line of latitude and
line of longitude intersect. All of South Africa is south of the equator and east of the
Prime Meridian through Greenwich in England.
FIGURE 1 The relationship between degrees, minutes and seconds
Each degree (º) can be subdivided into 60 minutes (') and each minute divided into 60
seconds ("). This subdivision enables us to determine the position of any place or object
very accurately. The geographic co-ordinates must be described in full as degrees,
minutes, and seconds South and East.
© Via Afrika Publishers » G e o g r a p h y 11 Study Guide eBook 2
Introduction to geographical skills and techniques
FIGURE 2 How to write a co-ordinate correctly
2 Locating relative position (revision)
2.1 What is direction?
When we refer to direction we use the points of a compass card to describe the general
direction from one feature to another (see Figure 3).
FIGURE 3 Converting map direction to ground direction
2.2 What is a bearing?
Bearings indicate direction and are measured using a protractor and given in degrees.
© Via Afrika Publishers » G e o g r a p h y 11 Study Guide eBook 3
Introduction to geographical skills and techniques
2.2.1 True bearing
True bearing is the angle measured relative to the true north line (see Figure 4). The
starting point to determine true bearing is the north-south line. North will then always
be 0º. True bearing is always measured clockwise from north at 0º.
FIGURE 4 True bearing, magnetic bearing and magnetic declination
2.2.2 Magnetic bearing
Magnetic bearing is the angle measured relative to the magnetic north line(see Figure 5).
Remember that for South Africa, magnetic north always lies west of true north.
FIGURE 5 How magnetic declination is shown on South Africa’s topographic maps
2.3 How do you calculate true bearing and magnetic bearing?
The magnetic declination of any specific map area is shown on our topographic maps
(see Figure 5).
• True bearing = magnetic bearing − magnetic declination
• Magnetic bearing = true bearing + magnetic declination
© Via Afrika Publishers » G e o g r a p h y 11 Study Guide eBook 4
Introduction to geographical skills and techniques
3. Whatis scale (revision)?
Map scale is the relationship between a map distance and the corresponding distance
on the ground.
Tastes Different map scale formats
Word scale One centimetre represents 500 metres
Ratio sale 450.000 and 1:40.00
7000 r a = 3
Line scale ereesEEECEP Ere snomernes
On 21:50 000 map Onat:10 009 map
{cm represents 50 000 em on J em represents 10 000 ¢m on
{Hie ground the ground
Converted to km itis divided by Converted to km iis divided by
100 000 em 100 000 em
59.000¢m 10.000cm
400 060 cmis the same as 109 000 cms the same as
Yaka or 0,5 km 4/10 km or 041 ka
You can multiply yaur em map You can multiply yourem map
distance with: distance with:
‘0,5 to convert it to km distance 1 to convert it to km distance
+ 500 fo convertitto m distance ‘#100 to convert it to m distance
FIGURE 6 Converting map direction ta ground direction
4 Howdoyou calculate curved line distances from a
map?
You can use either a piece of string or the straight edge of a piece of paper to measure
the curved line distance between two places on your map.
© Via Afrika Publishers >> Geography 11 Study Guide eBook 5
Introduction to geographical skills and techniques
5 Calculating area of regular and irregular shapes
TABLE 2 Calculating area of regular and irregular shapes
You must be able to convert both your km2 or m2 area to hectares (ha).
One hectare (1 ha) = 100 m × 100 m To convert km2 to hectares To convert m2 to hectares
= 10 000 m2
1 km = 10 ha × 10 ha
2 = 100 ha Multiply your answer by 100 Divide your answer by 10 000
© Via Afrika Publishers » G e o g r a p h y 11 Study Guide eBook 6
Introduction to geographical skills and techniques
Unit 2 Working with 1:50 000
topographic maps
• Contours are shown as brown lines on maps. Contours join all places of equal height
above mean sea level (0 m).
• The South African 1:50 000 topographic maps have a contour interval of 20 m. On
the 1:10 000 orthophoto maps the interval is 5 m.
• Contour lines close to each other indicate steep slopes.
• Contour lines that are far apart show gentle slopes.
FIGURE 7 Landforms and associated contours
© Via Afrika Publishers » G e o g r a p h y 11 Study Guide eBook 7
Introduction to geographical skills and techniques
1 What is a cross-section and how do you construct
one?
A cross-section is a drawing of the side view of a landform such as a valley, a hill, or a
section of the landscape.
FIGURE 8 Constructing a cross-sections
2 What is vertical exaggeration used for?
Vertical exaggeration is the deliberate vertical stretching of a cross-section to
emphasise the height of smaller landscape features such as valleys, hills, low
mountains. The ratio between the vertical scale and the horizontal scale is known as the
vertical exaggeration.
FIGURE 9 How to calculate vertical exaggeration
© Via Afrika Publishers » G e o g r a p h y 11 Study Guide eBook 8
Introduction to geographical skills and techniques
3 What is intervisibility?
Cross-sections provide a way to see which geographical features are visible from each
other (see Figure 10). When there are no blocking objects between any two features
these features are intervisible.
FIGURE 10 Cross-sections allow you to determine intervisibility.
4 What is gradient?
Gradient is the steepness or the angle of the slope of the ground. What does the term
gradient tell us? Gradient is the ratio between height and the horizontal distance.
4.1 How do you calculate gradient?
Using Figure 11 calculate the gradient between the wind pump and the trigonometric
beacon 408,3.
FIGURE 11 Contour map to calculate gradient
© Via Afrika Publishers » G e o g r a p h y 11 Study Guide eBook 9
Introduction to geographical skills and techniques
The vertical difference (VD) is the height of the beacon minus the height of the wind
pump.
VD = 408,3 m – 320 m
= 88,3 m
The horizontal distance between the beacon and the wind pump is 5,3 cm as measured
on the map. This distance must be converted to metres. Therefore 5,3 cm × map scale
divided by 100 will give us the distance in metres.
HD = 5,3 cm × 50 000
100
= 2650 m
Gradient = VD = 88,3 m =1
HD 2650 m 30
written as a ratio 1:30
This means that for every 30 m walk there is a climb of 1 m.
© Via Afrika Publishers » G e o g r a p h y 11 Study Guide eBook 10
Introduction to geographical skills and techniques
Unit 3 Aerial photographs and
orthophoto maps
1 The use of aerial photography
One of the most effective tools that the geographer can use for the interpretation of the
landscape is the aerial photograph and orthophoto map.
2 Oblique and vertical aerial photographs
Aerial photographs can be vertical, directly overhead or oblique which are taken at an
angle. In this case the view is at some angle to the vertical.
FIGURE 12 Difference between vertical, low-oblique and high-oblique photos.
3 How do you identify landforms and features?
3.1 Shape and pattern
Cultural and built objects such as buildings, shopping malls and roads have regular
geometric shapes and distinct boundaries (see Figure 13). The shapes of natural
features such as rivers, sand dunes and mountains are irregular and uneven.
© Via Afrika Publishers » G e o g r a p h y 11 Study Guide eBook 11
Introduction to geographical skills and techniques
FIGURE 13 Shape and pattern are used to distinguish between objects on both panchromatic and colour
photographs.
3.2 Using tone, texture and shadow to interpret photographs
TABLE 3 Identifying objects by means of recognition elements
Objects on photographs can be identified by the following recognition elements
Tone varies with the reflectivity of the object,
Tone the weather, the angle of the sunlight on an
object, and on moisture content of the
surface.
Lighter tone Darker tone
Smooth surfaces Irregular surfaces
Bare ground Vegetation
Winter vegetation Summer vegetation
Muddy water Clear water
New crops Mature crops
Bare fields Ploughed fields FIGURE 14 Bare fields are lighter in tone and
smoother.
© Via Afrika Publishers » G e o g r a p h y 11 Study Guide eBook 12
Introduction to geographical skills and techniques
Texture may be described as coarse or fine,
Texture smooth or rough, even or uneven, speckled,
granular, linear, woolly, and so on.
It is a way of describing the smoothness or
coarseness of the image on the photo.
Texture also describes the terrain surface
roughness.
Land cover Characteristics
Crops have a speckled
appearance.
Cultivation
Ploughed field look striped and
darker.
Orchards have coarse and grid- FIGURE 15 Three different vegetation types can be
Orchards
like texture. identified as a result of differences in texture.
and
Vineyards have a finer and
vineyards
striped texture.
Appear mottled and coarse.
Pine plantations look stippled
Forests and finer.
and Blue gum plantations look
plantations granular, coarser.
Younger plantations appear
striped.
Objects cast shadows visible on photograph.
Shadow Objects can be recognised by their shadows
alone: power lines, high buildings, cooling
towers, water towers.
Help you to determine the time of day and
position of Sun.
Reveal depth from inward cast shadows and
height from outward cast shadows.
FIGURE 16 The circular shape indicates that these
objects are storage tanks.
4 Identifying features on orthophoto maps
An orthophoto map is a black and white photographic image to which cartographers
have added helpful information such as contours, spot heights and street names. This
makes them easier to identify.
© Via Afrika Publishers » G e o g r a p h y 11 Study Guide eBook 13
Introduction to geographical skills and techniques
Unit 4 Geographical Information Systems
1 What is a Geographical Information System (GIS)?
A Geographical Information System is a computerised system consisting of hardware,
software and methods that are designed to capture, manage, manipulate, analyse,
model, and display spatial geographic data as well as non-spatial attribute data in order
to solve complex planning and management problems. The concept of GIS consists of
three separate words namely, geography, information, and system.
1.1 What are the functions of a GIS?
A GIS has many functions that can be organised into the following groups:
• collecting and capturing data
• storing and managing data
• recalling and processing data
• transforming and integrating with other data
• analysing data
• displaying data as maps and information tables.
2 Spatially referenced data
Before geographic data can be used in a GIS it first must be spatially referenced in a co-
ordinate system. This is known as georeferencing.
FIGURE 17 An example of georeferencing of geographic data
© Via Afrika Publishers » G e o g r a p h y 11 Study Guide eBook 14
Introduction to geographical skills and techniques
2.1 Spatial resolution
Spatial resolution refers to the quantity of detail that can be detected. It describes the
size of the picture elements, or pixels, that make up the image.
2.2 Spectral resolution
Spectral resolution is the ability of the sensor to detect information over several spectral
bands of the electromagnetic spectrum.
3 Different types of data: point, line, area and attribute
Spatial features can be classified as points, lines or area type features. Springs, bridges,
monuments, beacons and wind pumps are all examples of point type features.
FIGURE 18 The way a GIS stores and displays different spatial features
• Spatial data, or geographical data, is data which describes the shape and the
absolute and relative position of all geographical features or objects.
• Non-spatial data, or attribute data, is information which describes the spatial
characteristics of the spatial features or objects.
4 Raster and vector data
4.1 Spatial data structures
Data structures supply the information that is needed by the computer to create a
spatial data model of the real world in digital format. There are two different formats
used for different types of data. Figure 19 illustrates the difference between raster data
and vector data.
© Via Afrika Publishers » G e o g r a p h y 11 Study Guide eBook 15
Introduction to geographical skills and techniques
FIGURE 19 The difference between raster and vector data structures
4.1.1 Raster data
A raster data structure displays geographic features by means of arranged patterns
within a grid system of square or rectangular cells. The position of each cell is
determined by the number of its row and column.
4.1.2 Vector data
The vector data structure shows geographic features in the form of basic geometric
objects such as points, lines and polygons.
© Via Afrika Publishers » G e o g r a p h y 11 Study Guide eBook 16
Introduction to geographical skills and techniques
Unit 5 Using atlases
5.1 What is an atlas and an atlas index?
An atlas is a book with a collection of different maps showing a variety of interesting
spatial information at various scales. It has different types of graphs, charts,
photographs, diagrams, tables and text. These cover topics such as health issues,
population pyramids, biodiversity, history of the Earth and humans, desertification and
soil degradation, world statistics and so on.
Atlases are divided into various sections. The index at the back of your atlas lists place
names and features alphabetically. Next to the name of the feature or place is the
description of type of feature, country, page number where the place appears most
prominently, an alphanumeric reference and the co-ordinates to the nearest minute.
FIGURE 20 Information from the index in an atlas
© Via Afrika Publishers » G e o g r a p h y 11 Study Guide eBook 17
Introduction to geographical skills and techniques
TABLE 4 Using an atlas to find a place or to study a theme
How to use an atlas to find a place How to use an atlas to study a theme
If you are looking for information about a place or If you are looking for information about a topic or
feature: theme that you are studying:
1 Go to the index at the back of the atlas. 1 Go to the table of contents at the front of the
2 Use the alphabetical list to find the name of a atlas.
place or feature. All names are indexed 2 Find the theme you need (for instance, climate).
alphabetically for each continent, country, city, 3 Find the page numbers of maps in each section of
town river, mountain, bay or any other named the atlas where you may find relevant maps at
geographical feature. national, continental and global scales.
3 Find the page number of the map showing the 4 If the theme you are studying is not listed in the
place or feature. Usually only one reference is table of contents, page through the atlas to see
given, although the same place may appear on whether your theme is a subtheme covered under
many maps. another heading.
4 Find the reference that indicates where the place 5 Use all the information available, including a
or feature name appears on the map. Two variety of maps, different kinds of graphs, data
different references may be used, an tables and photographs.
alphanumeric reference or geographical
coordinates.
© Via Afrika Publishers » G e o g r a p h y 11 Study Guide eBook 18
Introduction to geographical skills and techniques
Unit 6 Fieldwork
TABLE 5 How to conduct fieldwork
Guidelines how to conduct fieldwork as part of a research project
Questions Conducted
Phase Activity Description
asked where?
Via reading, observation of
What?
Identify and characteristics and relationships
1 Who is
define a problem Be feasible, relevant, appropriate and
involved?
accomplishable Class
Putting forward an educated guess which
Formulate a
2 may be a possible reason for a solution to Statement
hypothesis
the problem above
Decide what information is needed
How?
Collect, describe Describe features, measure dimensions,
Where?
3 and record counting, taking photos, interviewing Field
With what?
information Record onto questionnaires and recording
When?
sheets
What patterns?
Analyse and Process Information with simple How did it
4 interpret statistical techniques happen? Class
information Maps, diagrams, graphs, tables Why it
happened?
What is the
impact?
Present findings Write report, poster or oral presentation
What
5 and make Meaningful conclusions and suggesting Class
consequences?
recommendations solutions
What will
happen?
Accept or reject hypothesis
© Via Afrika Publishers » G e o g r a p h y 11 Study Guide eBook 19
Introduction to geographical skills and techniques
Questions
Question 1
Study the 1:50 000 topographic map extract of 2531 CC Barberton on page 260 in the
Learner’s Book and answer the questions which follow.
1.1 State the latitude and longitude of spot height 1369 (E3) (4)
1.2 State the land use at 250 48' 30" S, 310 04'00" E (2)
1.3 A hiker walks from spot height 1369 (E3) to spot height 954 (D2). State the true
bearing of the hiker’s walk. (2)
1.4 Indicate if each of the following statements is true or false. If false, write the
correct answer.
1.4.1 The land in F2 is flatter than the land in C2.
1.4.2 Fruit is grown in D1.
1.4.3 The sawmill in B3 is an example of a primary activity.
1.4.4 The sewerage works in A3 are an example of a secondary activity.
1.4.5 There is evidence of a primary activity in D3.
1.4.6 The distance of the road of the R38 and the R40 (D3/D4) and Kaapmuiden
is 46 km.
1.4.7 There is a power line in E1.
1.4.8 The unnamed river in F4, F5 and E5 flows towards the south-west.
1.4.9 A hiker walking from spot height 1625 (F3) in a south-easterly direction
for 1 500 metres goes down a convex slope.
1.4.10 The dam wall in A1 is at a lower altitude than the dam wall in D2. (30)
1.5 The Barberton municipality wants to develop the residential area in A1 towards
the west. State, giving a reason, if this residential area is high density or low
density. (4)
1.6 The municipality uses a GIS to plan the development. What does GIS stand for?(2)
1.7 Give three examples of thematic (information) layers that the developers would
use in their planning. (6)
[50]
© Via Afrika Publishers » G e o g r a p h y 11 Study Guide eBook 20
Introduction to geographical skills and techniques
Answers to Questions
Question 1
1.1 Latitude 25° 49' 42–48" S (2)
Longitude 31° 02' 15–21" E (2)
1.2 No apparent land use or nature reserve (2)
1.3 326°–328° (2) OR 325° 0r 329° (1) (2)
1.4 True/False
1.4.1 False (1), it is steeper (2) (3)
1.4.2 True (1)
1.4.3 False (1), it is a secondary activity (2) (3)
1.4.4 False (1), they are tertiary activities (2) (3)
1.4.5 True (1), either forestry or mining (1)
1.4.6 False (1), it is 46 km + 1,5 – 2,5 km extra (2) (3)
1.4.7 True (1) (1)
1.4.8 False (1), it flows towards the north-east (2) (3)
1.4.9 True (1)
1.4.10 True (1)
(30)
1.5 High density (2) The roads are very close together or the blocks are very small.
(2) (4)
1.6 Geographic Information System (2)
1.7 There are many possible answers. Some of the more likely ones are: existing
infrastructure such as roads, power lines, water pipes, sewerage connections,
existing buildings, geology, soil type. (3 × 2)(6)
[50]
© Via Afrika Publishers » G e o g r a p h y 11 Study Guide eBook 21
TOPIC 1 The atmosphere
Topic 1 The atmosphere
Introduction
Almost all life on Earth and all processes of the atmosphere depend on energy from the
Sun. The Sun emits this energy into space, radiating it in all directions. The Earth,
about 150 million kilometres away, receives only a small part of this energy. The Sun’s
energy heats the Earth’s atmosphere unequally and produces pressure differences
between the tropics and the polar regions. These differences cause winds and ocean
currents. Our familiar daily and seasonal temperature variations are due to changes in
the balance between the amount of incoming radiation from the Sun and the amount of
outgoing radiation from the Earth.
Unit 1 The Earth’s energy balance
1 What are the effects of unequal heating on the Earth’s
energy balance?
Incoming radiation from the Sun is mainly higher energy, short-wave radiation that
heats the Earth’s surface. The heated Earth radiates lower energy, long-wave, infrared
energy back into the atmosphere. This heats the atmosphere.
FIGURE 2 1 Incoming solar radiation strikes the Earth’s curved surface at various angles.
© Via Afrika Publishers » G e o g r a p h y 11 Study Guide eBook 22
TOPIC 1 The atmosphere
The incoming solar energy that reaches the Earth’s surface is called insolation and is
unevenly distributed over the Earth. More insolation reaches the surface in the tropics
than in the polar regions. In the tropics, the Sun’s rays come in nearly perpendicular to
the surface. At the poles the surface is angled away from the incoming rays of the Sun.
FIGURE 2 2 Annual insolation and energy loss, showing the energy balance at different latitudes
It is colder near the poles because:
• The Sun’s rays have to travel through a thicker atmospheric layer and energy is lost
through absorption, scattering and reflection.
• The energy of the incoming radiation is spread over a larger area.
• Shiny white ice and snow reflect more of the incoming energy into space.
From Figure 22 we learn that:
• O
Between the tropics, the angle of incoming solar rays is high. More energy is gained
than lost, so it is hotter.
• OIn the polar regions, the angle of incoming solar rays is low, so solar heating is low.
More heat is reflected into space. More energy is lost than gained and there is an
energy deficit.
• ONear 37° both north and south of the equator, a balance exists between energy
gained and energy lost.
© Via Afrika Publishers » G e o g r a p h y 11 Study Guide eBook 23
TOPIC 1 The atmosphere
2 The significance of the Earth’s axis and revolution
around the Sun
FIGURE 23 The Earth’s axis of rotation is tilted relative to the plane of rotation around the Sun. This has a major
effect on the seasonal variation in insolation in each hemisphere.
2.1 What causes the seasons?
This is summarised in Table 6 below.
TABLE 6 The causes of the seasons
Cause Description
Revolution Earth orbits around the sun once every 365¼ days.
Rotation Earth turns on its axis once every 24 hours.
Tilt The Earth’s axis is tilted 23½° from the perpendicular.
Sphericity The nearly spherical shape of the Earth produces uneven insolation.
2.2 What are the seasonal effects on the energy balance?
FIGURE 24 Annual cycle of the seasons
© Via Afrika Publishers » G e o g r a p h y 11 Study Guide eBook 24
TOPIC 1 The atmosphere
More heat is received in summer than in winter. Let us see how this happens:
• Earth’s axis is tilted.
• It is summer in each hemisphere when that hemisphere is tilted towards the Sun
because it has longer daytime hours.
• In winter, when a hemisphere is tilted away from the Sun, it receives and retains
less incoming radiation.
• Twice a year, at the equinoxes on 21 March and 23 September, the Sun is directly
overhead the equator and all places on Earth have a 12 hour day and a 12 hour night.
Both hemispheres will get equal solar radiation.
• At the solstice on 21 June, the northern hemisphere is tilted towards the Sun. The
longer days and shorter nights cause the northern hemisphere to receive more
insolation and to experience summer. The southern hemisphere is tilted away from
the Sun. This causes shorter days and longer nights. There are winter conditions.
• On December 21 the reverse happens with long days, short nights and summer in
the southern hemisphere. The northern hemisphere has long nights, short days and
winter.
3 The role of ocean currents and winds in the transfer of
energy
There is a positive heat balance within the tropics, and a negative heat balance in the
polar regions. But the Earth does not steadily get hotter at the tropics or colder at the
poles. There is a balance between incoming solar radiation and outgoing radiation from
the Earth. This happens through two major transfers of heat, 80% by wind and 20% by
water.
3.1 How do winds contribute to heat transfer?
The uneven heating of the Earth causes pressure differences because warm air is less
dense and tends to rise. This difference creates a pressure gradient force and causes
wind to blow from regions of high pressure (HP) to regions of low pressure (LP).
Imagine an Earth with no features that does not turn. This is illustrated in Figure 25.
Under such circumstances a belt of low pressure forms in the hot equatorial regions
while a belt of high pressure forms over the cold polar areas.
© Via Afrika Publishers » G e o g r a p h y 11 Study Guide eBook 25
TOPIC 1 The atmosphere
FIGURE 25 A simple global atmospheric circulation model of a non-rotating Earth
• The pressure difference causes cold, dry winds to flow from the polar high pressure
to the equatorial low pressure.
• At the equator, warm moist air rises. This warm air diverges in the upper
atmosphere and flows towards the poles.
• Over the polar regions, the air cools, becomes more dense, and sinks down back
towards the surface.
• But the Earth does have features of land and sea and it does turn around on its axis
so there is not a steady flow of air from the poles to the equator and back to the
poles.
3.1.1 Coriolis force
Because the Earth rotates from west to east, the Coriolis force deflects winds in the
northern hemisphere to the right. In the southern hemisphere winds are deflected to the
left.
3.2 How do oceans contribute to heat transfer?
3.2.1 Surface ocean currents
• Warmer 0cean currents carry the stored heat from the tropics towards the polar
latitudes. Colder ocean currents from the higher latitudes carry water to the lower
latitudes, where it is heated again.
• The influence of the Coriolis force − In the northern hemisphere the surface currents
mostly curve to the right. In the southern hemisphere they curve to the left.
© Via Afrika Publishers » G e o g r a p h y 11 Study Guide eBook 26
TOPIC 1 The atmosphere
FIGURE 26 Major ocean currents transfer heat from the lower latitudes to the higher latitudes.
3.2.2 Deep ocean currents
There is also a transfer of energy by deep ocean currents. This is due to differences in
the density of ocean water, depending on its temperature and salinity. Together the
surface ocean currents and the deep ocean currents make up the ‘Ocean Conveyor Belt’
(Figure 27), which plays a major role in moving heat from the tropics to the polar
regions.
FIGURE 27 The ‘Ocean Conveyor Belt’ circulates warm water from the tropics to the polar regions.
© Via Afrika Publishers » G e o g r a p h y 11 Study Guide eBook 27
TOPIC 1 The atmosphere
Unit 2 Global air circulation
1 Air circulation in response to unequal heating of the
atmosphere
Global air circulation systems move thermal energy, air and water from equatorial
regions with energy surpluses to polar regions with energy deficits.
2 World pressure belts
• The global air circulation patterns control our weather and climate. These patterns
are caused by shifting zones of high or low pressure in summer and winter.
• They move seasonally with the varying intensity of the Sun’s direct rays.
• Atmospheric pressure is shown on maps by isobars which are lines joining places
with equal pressure.
2.1 Where are the pressure belts found in each hemisphere?
FIGURE 28 Location of the global atmospheric pressure belts
• In January the low pressure Intertropical Convergence Zone (ITCZ) is situated mostly
south of the equator.
• In July the ITCZ shifts north of the equator.
© Via Afrika Publishers » G e o g r a p h y 11 Study Guide eBook 28
TOPIC 1 The atmosphere
TABLE 7 Summary of causes and characteristics of global pressure belts
Name Location Cause(s) Air characteristics
Equatorial 10° N to 10° S Thermal: Warm and wet air. When
low pressure • Intense heating due to constant high moist air rises, it may
sun altitude and consistent daytime condense and result in
(12 hours) clouds and rain.
• Warming creates less dense, lighter,
rising air.
Subtropical Between Dynamic: Hot and dry air. Cloudless,
high 20−35 °N and • Air above region is pushed especially over desert
pressure 20−35 °S downwards. areas.
• Air heats by compression as it
descends to Earth’s surface.
Subpolar In the region Dynamic: Cool and wet air.
low pressure of 60° and • As a result of the Earth’s rotation, at Contrasting air masses
70° to the these latitudes air is spun away from meet along polar front –
north and the Earth’s surface by centrifugal cold, dry air from high
south of the forces. latitudes and warm, wet air
equator from lower latitudes.
Polar high Around the Thermal: Cold and dry air. Air is so
pressure poles (90° • Low temperatures as areas receive cold that it contains little
north and little solar energy moisture; convection and
south) • Air becomes more dense, heavier and precipitation are limited.
sinks.
3 The relationship between air temperature, air
pressure and wind
3.1 High and low pressure cell formation
• During daytime, land surfaces heat up more rapidly than water. The air above the
land is heated, it becomes less dense, expands and rises. This lowers the air
pressure over the land.
• Over the adjacent water surface, the air is cooler. It becomes more dense, contracts
and descends.
© Via Afrika Publishers » G e o g r a p h y 11 Study Guide eBook 29
TOPIC 1 The atmosphere
TABLE 8 The characteristics of high pressure and low pressure cells in the southern hemisphere
High pressure Low pressure
Air sinking anti-clockwise. Air rising clockwise.
At Earth’s surface air moves outwards to areas At Earth’s surface air moves inwards from areas of
of lower pressure – outward-blowing surface higher pressure – inward-blowing surface winds.
winds.
As it descends, cool air is heated by As it rises, warm is cooled by expansion.
compression.
Associated with calm, fair and dry/hot weather. Associated with cloudy, rainy and stormy weather.
(a) (b)
FIGURE 29 Comparison of air movement in (a) high and (b) low pressure cells in the southern hemisphere. In high
pressure cells the air sinks anti-clockwise. In low pressure cells the air rises clockwise. In the northern
hemisphere the air rotation is the other way around.
3.2 What is the relationship between atmospheric pressure and
wind?
Atmospheric pressure differences are caused by uneven heating of the Earth’s surface.
Figure 30 shows the relationship between pressure and wind. To start, there are three
columns of air all at the same temperature and air pressure.
© Via Afrika Publishers » G e o g r a p h y 11 Study Guide eBook 30
TOPIC 1 The atmosphere
FIGURE 3 0 Model showing the relationship between temperature, atmospheric pressure and wind
• The air at the bottom of the central column is heated. It expands and rises to the top
of the column.
• Now there is less air at the bottom of the central column so the pressure is lower. At
the top of the central column there is more air so there is higher pressure.
• Now there is a pressure gradient between the columns.
• Air will flow from the side columns to the lower pressure at the bottom of the central
column and is called is called convergence.
• Air will flow from the high pressure at the top of the central column to the lower
pressures at the top of the side columns. This outward flow from high pressure is
called divergence.
4 The tri-cellular model of global air circulation
4.1 Hadley cell
• The high temperatures at the equator cause the warm moist to rise and move
towards in the upper atmosphere causing a belt of low pressure at the equator
resulting in heavy rainfall.
• Close to the ground air flows from the subtropical high pressure from about 30° N
and S to the equatorial low pressure zone.
• Cool air in the upper atmosphere above approximately 30° N and S descends
forming high pressure cells preventing clouds and rain from forming.
• The zone between the tropics where trade winds from the subtropical high pressure
belts converge is called the Intertropical Convergence Zone or the ITCZ.
© Via Afrika Publishers » G e o g r a p h y 11 Study Guide eBook 31
TOPIC 1 The atmosphere
FIGURE 3 1 The tri-cell model of atmospheric circulation consists of the Hadley cell, the Ferrel cell and the
polar cell.
4.2 Ferrel cell
• At latitudes 30° N and S, some of the air in the high pressure zones moves towards
the equator as part of the Hadley circulation.
• The rest of the air moves along the surface to the higher latitudes of 60° N and S,
where the air pressure is mainly low.
• Along the polar front, at 60° N and S, warm air from the subtropical high pressure
belts meets cold air from the polar high pressure zones.
4.3 Polar cell
• Over the poles, the air sinks, forming the polar high pressure zones.
• At the surface, air diverges outward from the polar highs.
• It then flows as easterly surface winds in the Polar cell, towards the sub-polar low
pressure belts at 60° N and S.
© Via Afrika Publishers » G e o g r a p h y 11 Study Guide eBook 32
TOPIC 1 The atmosphere
4.4 What are the jet streams?
The atmospheric circulation is influenced by the jet streams. These are strong winds
blowing from west to east in the upper atmosphere, 10 km above the surface, at speeds
of 100-300 km/h.
FIGURE 3 2 The jet streams are part of the Rossby waves, which are described as ‘meandering rivers of air’.
5 Pressure gradient, Coriolis force and geostrophic flow
The speed, duration and direction of winds are controlled by a combination of two
forces − the pressure gradient force and Coriolis force. They work together to cause the
geostrophic wind.
5.1 How does the pressure gradient force work?
• The pressure gradient is the force that causes air to flow from high pressure to low
pressure.
• In Figure 33 (a) the isobars are spaced further apart. This indicates a gentle pressure
gradient and slower wind speeds.
• In Figure 33 (b) the isobars are spaced closer together. This means the pressure
gradient is steeper and will produce winds with much higher speeds.
• Remember:
• Isobars close together = steep pressure gradient
• The closer the isobars the stronger the wind.
FIGURE 3 3 (a) A low pressure gradient results in low wind speeds. (b) A high pressure gradient results in higher
wind speeds.
© Via Afrika Publishers » G e o g r a p h y 11 Study Guide eBook 33
TOPIC 1 The atmosphere
5.2 What is the impact of the Coriolis force on wind?
This deflects winds and ocean currents to the right in the northern hemisphere, and to
the left in the southern hemisphere. The characteristics of the Coriolis force are as
follows:
• The Coriolis effect causes a change in wind direction for all winds on the Earth’s
surface.
• The stronger the wind speed the stronger the Coriolis force.
• The Coriolis effect is weakest near the equator and strongest near the poles.
FIGURE 3 4 If the Earth did not rotate, winds would blow straight from high pressure to low pressure, as indicated
by the broken lines A–B and M–N. Because the Earth rotates from west to east, the Coriolis force deflects wind
to the right in the northern hemisphere and to the left in the southern hemisphere.
5.3 How do the Coriolis force and pressure gradient together
affect wind direction?
• The combined effects of the pressure gradient and the Coriolis force produce
geostrophic wind.
• The air at A, a high pressure area, moves towards the low pressure area because of
the pressure gradient force, at right angles to the isobars.
• As soon as the air begins to move, it is affected by the Coriolis force. The wind is
deflected to the left in the southern hemisphere.
• When the wind reaches B, both forces are balanced. The wind is now blowing
parallel to the isobars and is called a geostrophic wind.
• Nearer the Earth’s surface, friction causes winds to blow more diagonally across the
isobars.
© Via Afrika Publishers » G e o g r a p h y 11 Study Guide eBook 34
TOPIC 1 The atmosphere
FIGURE 3 5 Geostrophic wind is caused by the combined effects of the pressure gradient and the Coriolis force.
The lengths of the arrows are proportional to the strength of the respective forces they represent. This is in the
southern hemisphere.
6 Air masses and global circulation
6.1 What is an air mass?
An air mass is a large body of air with relatively similar temperature and humidity
characteristics. An air mass can extend over thousands of square kilometres.
The main source regions for air masses are:
• where the surface is geographically relatively uniform, like oceans, ice fields,
massive land areas and deserts
• areas of relatively stable atmospheric conditions, such as semi-permanent high
pressure areas.
6.2 Can an air mass change?
Where two air masses with different properties meet, they form a front.
• A warm air mass travelling over a cold surface is unlikely to produce much rain.
• A cold air mass passing over a warm surface will be more likely to produce rain.
© Via Afrika Publishers » G e o g r a p h y 11 Study Guide eBook 35
TOPIC 1 The atmosphere
6.3 How are air masses classified?
Air masses are classified according to:
• the latitude in which they originate. This determines their temperature, for example,
cold polar air (P) or warm tropical air (T).
• the surface over which they develop. This affects their humidity and precipitation,
for example over the sea producing wet maritime air (m) or over the land producing
dry continental air (c).
Table 9 provides a more detailed classification of air masses. This should be studied
together with Figure 36.
TABLE 9 Classification of air masses
Air mass Symbol Where does it come from? Air mass properties
Maritime Warm oceans in the equatorial regions Warm, very moist
mE
equatorial
Maritime Warm oceans in the tropical regions Warm, moist and usually
mT
tropical unstable
Continental Mainly deserts on continents in the Warm, dry, stable in upper air,
cT
tropical subtropical regions unstable near surface
Maritime Oceans in the mid-latitude regions Cool, moist and unstable
mP
polar
Continental Mostly continental interiors in the northern Cold, dry and stable
cP
polar hemisphere
Continental Regions near the north pole Very cold, very dry
cA
arctic
Continental Regions near the south pole Very cold, very dry
cAA
antarctic
FIGURE 36 Air masses are classified as cold polar air (P), warm tropical air (T), wet maritime air (m) or dry
continental air (c).
© Via Afrika Publishers » G e o g r a p h y 11 Study Guide eBook 36
TOPIC 1 The atmosphere
7 Regional and local winds
7.1 What are monsoon winds?
Monsoon winds refer to the seasonal reversal of atmospheric pressure and winds, and
their accompanying rainfall.
FIGURE 3 7 Areas affected by the seasonal reversals of monsoon winds
7.1.1 What causes this wind shift, or monsoon conditions?
• Differential heating and cooling of land and adjacent sea areas results in changes in
atmospheric pressure and wind systems.
• The ITCZ moves northward in the northern hemisphere summer.
• The Himalayan mountain range not only influences the movement of the ITCZ, but
also triggers very high rainfall on the Indian side during July.
7.1.2 What are the seasonal changes in the monsoon?
(a) (b)
FIGURE 3 8 The monsoon in south and south-east Asia: (a) winter, dry (b) summer, wet
© Via Afrika Publishers » G e o g r a p h y 11 Study Guide eBook 37
TOPIC 1 The atmosphere
Winter, dry monsoon (Figure 38 a):
• During the northern winter Central Asia experiences very cold weather. This causes
the development of a high pressure system over the Asian interior.
• Cold dry winds flow from the Asian interior, over the Himalayas and across India.
The winds become drier and hotter as they descend from the Himalayas.
Summer, wet monsoon (Figure 38 b):
• During the northern summer high temperatures over the Asian interior creates a
large low pressure system.
• Warm, moist air from over the Indian Ocean flows the land areas. This produces
high rainfall over the subcontinent.
7.2 Föhn winds
Föhn is a name used for any dry, hot wind that starts from a mountainous area The
name ‘Föhn’ is derived from a specific wind that blows on the northern slopes of the
Alps. The air descends towards the Mediterranean Sea and there is a rapid increase in
temperature of about 1 °C for every 100 m descent) and a drop in relative humidity (RH).
The low humidity dries out forest area, which can cause fires. The warm winds also melt
snow, which can result in avalanches and flooding.
FIGURE 39 The Föhn blows over the Alps, changing in temperature and relative humidity (%RH).
© Via Afrika Publishers » G e o g r a p h y 11 Study Guide eBook 38
TOPIC 1 The atmosphere
There are also other local winds with similar characteristics:
• the Berg wind in South Africa
• the Chinook on the eastern side of the Rocky Mountains in North America
• the Brickfielder, a northeast summer wind that blows dust and sand across
Australia
• the Sirocco that blows as a south wind across North Africa from the Sahara.
© Via Afrika Publishers » G e o g r a p h y 11 Study Guide eBook 39
TOPIC 1 The atmosphere
Unit 3 Africa’s weather and climate
1 Africa’s climate regions
FIGURE 40 The seven climate regions of Africa
TABLE 10 Climate regions
© Via Afrika Publishers » G e o g r a p h y 11 Study Guide eBook 40
TOPIC 1 The atmosphere
2 Subsidence and convergence
• Temperatures are high everywhere in Africa, except at high altitudes and during
winter in the extreme north and south.
• The variation in the amount and season of rainfall over Africa determines the
differences in the environment from region to region.
© Via Afrika Publishers » G e o g r a p h y 11 Study Guide eBook 41
TOPIC 1 The atmosphere
2.1 Impact of subsidence and convergence on rainfall
FIGURE 41 Air movement, rainfall and the shifting ITCZ in different seasons over West Africa. These maps and
diagrams should be studied together with Table 11 below.
TABLE 11 The impact of subsidence and convergence on rainfall in West Africa
The dry season in the winter months The wet season in the summer months
• With the ITCZ situated just north of the equator, • As the ITCZ now migrates in a northerly
the area experiences hot dry desert Harmattan direction moist, unstable mT air is brought in
winds. from the Atlantic Ocean by the south-westerly
• As air descends in the vicinity of 25−30 °N the winds.
air heats adiabatically and becomes even drier. • With the ITCZ over the interior, Calabar and
• Kano (in Nigeria), just north of the ITCZ Kano receive these warm and moist air
experiences a dry season. masses/winds.
• Atar (in Mauritania), furthest north has a longer • This results in high rainfall during the summer
dry season because of the Harmattan, and the months.
moisture-laden south-westerly winds do not • Areas north of the ITCZ (like Atar) have only a
reach there. brief wet season and low annual rainfall
• Rainfall is restricted to the far south. totals.
3 The role of oceans on climate in Africa
Oceans have a major impact on both climate and weather. They are the global ‘heat
engine’ driving climate.
© Via Afrika Publishers » G e o g r a p h y 11 Study Guide eBook 42
TOPIC 1 The atmosphere
3.1 What is the relationship between oceans and climate?
Clouds and rain are formed from the ocean surface as a result of evaporation. Winds
drive ocean currents.
3.2 How significant is the maritime effect?
Places near the sea have a maritime climate with little difference between day and night
and summer and winter temperatures. Places far from the sea have a continental
climate with larger differences between day and night and summer and winter
temperatures. This can be seen in Table 12.
TABLE 12 Comparison of average temperature and daily temperature ranges for Lagos and Timbuktu
Lagos (coastal) Timbuktu (inland)
Maritime climate Continental climate
31,6 °C (summer) 43 °C (summer)
Average temperature
28 °C (winter) 13 °C (winter)
Daily temperature range 5,7 °C average 17 °C average
3.3 What impact do ocean currents have on Africa?
Ocean currents move warm water towards the poles and move cold water towards the
equator. This means that ocean currents must have a modifying influence on
temperature. Along the west coast of Africa, both the Benguela and Canary currents
that flow towards the equator are cold currents. Cold currents cool the air masses that
pass over them thus providing little moisture. The Namib Desert is caused by the cold
Benguela current.
4 El Niño and La Niña
El Niño and La Niña are caused by changes in the temperature of the surface of the
tropical eastern Pacific Ocean. Warming is known as El Niño. Cooling is known as La
Niña.
4.1 What are the normal conditions for the Pacific Ocean?
Under normal atmospheric conditions, warm air descends over the South American
coast and atmospheric pressure rises over the eastern Pacific Ocean.
© Via Afrika Publishers » G e o g r a p h y 11 Study Guide eBook 43
TOPIC 1 The atmosphere
FIGURE 42 Air flow, atmospheric pressure and ocean circulation of the Pacific Ocean during normal conditions
4.2 What happens during an El Niño event?
The normal air and sea water circulation pattern reverse during El Niño episodes. Warm
water flows from the west Pacific towards the east Pacific. Sea surface temperatures of
over 28 °C extend much further eastwards across the Pacific. A high atmospheric
pressure zone develops over Indonesia and Australia. The descending air warms and
leads to dry conditions over the area. Near South America, rising air causes heavy
rainfall on the Pacific coast from Peru to California.
FIGURE 43 Air flow, atmospheric pressure and ocean circulation of the Pacific Ocean during El Niño conditions
© Via Afrika Publishers » G e o g r a p h y 11 Study Guide eBook 44
TOPIC 1 The atmosphere
4.3 What are the effects of El Niño?
Extreme weather conditions related to El Niño conditions can lead to local droughts or
floods, and the outbreak of epidemic diseases in affected areas.
4.4 How is a La Niña event different from El Niño?
A La Niña event is associated with climatic conditions that are the reverse of an El Niño
event. The increased difference in atmospheric pressure between these regions
strengthens the trade winds. As a result:
• large amounts of ocean water are pushed westwards, producing higher than normal
sea-levels in Indonesia and Philippines
• the stronger equatorial undercurrent leads to an increase in upwelling of cold water
off the Peruvian coast. The sea surface temperature across the Pacific drops by 5 to 8
°C.
5 Reading and interpreting synoptic weather maps
• A synoptic weather map is a map showing weather conditions at a particular time,
with different conditions and features indicated with special synoptic chart
symbols.
• An important feature of synoptic maps is the lines called isobars, connecting points
of equal atmospheric pressure.
• The number shown on many of the isobars gives the air pressure along the line,
measured in hectopascals (hPa).
• The pressure difference between two consecutive isobars is called the isobar
interval.
• The closer the isobars are spaced, the steeper the pressure gradient and the stronger
the winds.
• Isobars often occur in the form of closed circular areas called cells which may be
high pressure cells or low pressures.
• Feathers on the arrows show the wind speed.
• Each feather represents 10 knots.
• Winds are named after the direction from which they blow.
© Via Afrika Publishers » G e o g r a p h y 11 Study Guide eBook 45
TOPIC 1 The atmosphere
Unit 4 Droughts and desertification
1 World’s dry areas
The world’s dryland ecosystems are characterised by a lack of water. Drylands are
classified into four subtypes based on decreasing levels of dryness. These are hyperarid,
arid, semiarid and dry sub-humid.
2 Areas at risk
Drought and desertification are two challenges for populations in these dryland areas
(see Table 13). Degraded land due to desertification increases the effects of drought.
This reduces the chances of people and the environment coping with difficult periods.
As land dries up, it becomes unsuitable for farming. This increases poverty, food
insecurity, water scarcity and creates environmental refugees.
TABLE 13 Drylands occupy 41% of Earth’s land area and are home to more than 2 billion people. A least 90% of
these live in developing countries.
Hyper-arid areas Dryland subtypes
Arid areas Semi-arid Dry subhumid areas total
Africa 58 175 9% 41 366 6% 117 573 18% 109 038 16% 40%
Asia 29 506 1% 161 556 5% 500 695 15% 657 899 19% 39%
Australia 0 0% 275 1% 1 352 5% 5 318 19% 25%
Europe 0 0% 628 <1% 28 811 5% 115 146 21% 26%
South America 3 877 1% 6 330 2% 46 851 16% 33 777 12% 30%
North America 508 <1% 12 750 3% 53 900 13% 24 342 6% 22%
3 Drought
• Drought develops slowly, affects larger area and it exists for a long time. Drought is
often linked to aridity and desertification, but they are not the same thing.
• Aridity is a permanent and natural condition, and desertification is linked to human
activity.
© Via Afrika Publishers » G e o g r a p h y 11 Study Guide eBook 46
TOPIC 1 The atmosphere
3.1 What is drought?
Drought is defined as an extended period of below average rainfall. Reservoirs are
unable to supply water and wells dry up. It leads to crop damage, or complete crop
failure. The normal reliance of industry, business and households on adequate water
supply may be affected.
3.2 What are the different types of drought?
There are four different types of drought:
• Meteorological drought occurs when there is a long period of below average rainfall.
• Agricultural drought occurs when the lack of rain and soil moisture affect crop
yields.
• Hydrological drought occurs when water reserves fall below an established average.
It happens even during times of average or above average precipitation, if the
demand for water is high and increased usage lowers the water reserves.
• Socio-economic drought happens when reduced water supplies result in the
inability to supply social, economic and environmental demands.
3.3 What is the global extent of drought?
FIGURE 44 Drought events per African country from 1970 to 2004
Droughts occur on every continent. Australia is in a decade-long drought. The drought
in southwestern USA is under way since 2000. From Figure 44 you can see patterns of
© Via Afrika Publishers » G e o g r a p h y 11 Study Guide eBook 47
TOPIC 1 The atmosphere
drought in Africa.
• The highest incidence of drought occurs in the Sahel region (south of the Sahara
from Senegal to Sudan) and along the central east coast.
• The lowest incidence is found in the equatorial areas.
3.4 What are the causes of drought?
Causes of droughts:
• excessive build up of heat on the Earth’s surface
• meteorological changes, like a reduction in the amount of water vapour available
• reduced cloud cover leading to great evaporation rates
• oceanic and atmospheric weather cycles such as the El Niño.
The resultant effects of drought are increased by human activities such as
deforestation, overgrazing and poor cropping methods.
3.5 What are the effects of drought?
3.5.1 Short term
The short-term effects are stock losses, failed harvests, falling production and food
shortages causing higher food prices. Bushfires increase during dry times. Tourism is
affected. Wells dry up. Hydro-electric plants may stop operating. Water restrictions are
imposed and there are increased health risks.
3.5.2 Long term
In the long term, ecosystems are thrown out of balance. There is a decrease in the
effectiveness of water sources as irrigation dams silt up and more water evaporates.
4 Desertification
There is an expansion for the Earth’s drylands. This is called desertification and
involves turning formerly productive land into desert. Desertification occurs mainly in
semi-arid lands which border the world’s major deserts.
4.1 What is desertification?
Desertification is defined as a process of land degradation in mainly arid, semi-arid and
sub-humid dry areas. Land degradation involves soil erosion, water scarcity, reduced
agricultural productivity, loss of vegetation and biodiversity, drought and poverty.
© Via Afrika Publishers » G e o g r a p h y 11 Study Guide eBook 48
TOPIC 1 The atmosphere
4.2 What is the extent of desertification?
• Desertification is a serious and growing issue in many parts of the world.
• An estimated 12 million hectares of land become a desert every year. If the current
trend continues, the livelihoods of over 900 million people will be threatened.
• Many of the high risk lands are in Africa, Australia and Central Asia.
4.3 What are the causes of desertification?
The causes of desertification are complex and a combination of social, political,
economic, and natural factors. There are direct and indirect factors.
4.3.1 Direct factors
• Climate related processes, like global climate change, cause changing temperature
and rainfall patterns.
• More people means more food and resources, so farming is done on unsuitable land.
• Poor agricultural practices such as overgrazing
• Deforestation
• Soil erosion
4.3.2 Indirect factors
• Lack of knowledge encourages people to degrade the land.
• Policies leading to unsustainable use of resources encourage degradation.
4.3 What are the consequences of desertification at the local and
national level?
• Agricultural yields are reduced and become unpredictable.
• Food security in affected areas is threatened.
• Survival strategies of people result in increased over-use of natural resources.
• People start to migrate, which causes suffering and death.
• The economies of the affected countries are weakened.
4.3.1 Desertification also brings certain positive changes:
• Women who manage land in the absence of men who are seeking work elsewhere,
now demand greater access to land.
• Governments became more aware of their role in legislating for improved practices.
© Via Afrika Publishers » G e o g r a p h y 11 Study Guide eBook 49
TOPIC 1 The atmosphere
4.4 What are the consequences of desertification at the global
level?
• Carbon stored in the vegetation in the drylands declines when vegetation
disappears.
• The destruction of carbon-rich soils releases carbon and consequently boosts the
greenhouse effect.
• Biodiversity is reduced when the habitats of animals, plants, and micro-organisms
are destroyed.
• Desertification directly reduces the world's fresh water reserves.
• Desertification leads to an exploitation of underground reserves, and eventually
their depletion.
5 Management strategies
Effective prevention of desertification requires management and policy approaches that
promote sustainable resource use. Prevention is better than rehabilitation, which is
difficult and costly. The main weaknesses in management processes are:
• lack of awareness and access to information
• shortage of funds and support
• lack of integration and coordination of efforts
• lack of capacity in government agencies.
© Via Afrika Publishers » G e o g r a p h y 11 Study Guide eBook 50
TOPIC 1 The atmosphere
Questions
Question 1
State if the descriptions below about the differences between low and high pressure
cells indicate high pressure or low pressure.
1.1 warm, light air
1.2 lifting air
1.3 sinking air
1.4 diverging air
1.5 dense air
1.6 clockwise circulation in the southern hemisphere
1.7 anticlockwise circulation in the southern hemisphere
1.8 air warms
1.9 air cools and condenses
1.10 clear, sunny weather
1.11 cloudy with a chance of rain
1.12 depression
1.13 anticyclone
1.14 depression
(14 × 2) (28)
Question 2
Pressure
2.1 When atmospheric pressure readings are plotted on a synoptic weather map
they are represented by . . . . (2)
2.2 An isobar is a line . . . . (2)
(2 × 2) (4)
© Via Afrika Publishers » G e o g r a p h y 11 Study Guide eBook 51
TOPIC 1 The atmosphere
Question 3
FIGURE 45 Wind and pressure belts on a rotating Earth
3.1 What pressure is found at 1?
3.2 What pressure is found at 3?
3.3 What pressure is found at 5?
3.4 What pressure is found at 7?
3.5 Name the winds at 2.
3.6 Name the winds at 4.
3.7 Name the winds at 6.
3.8 Name the cell at 8.
3.9 Name the cell at 9.
3.10 Name the cell at 10.
(10 × 2) (20)
Question 4
Secondary circulation
4.1 The trade winds reach the Equator at the . . . .
4.2 This belt of clouds shifts a few degrees 4.2.1) . . . in the southern hemisphere
summer and a few degrees 4.2.2) . . . in the northern hemisphere summer.
4.3 The Tropical Easterlies are also known as the . . . .
© Via Afrika Publishers » G e o g r a p h y 11 Study Guide eBook 52
TOPIC 1 The atmosphere
4.4 The Tropical Easterlies blow from the subtropical 4.4.1) . . . pressure areas to the
4.4.2) . . . low pressure trough and are found from latitude 4.4.3) . . . in both
hemispheres.
4.5 On the 4.5.1) . . . side (at about 35° latitude) the air is usually 4.5.2) . . . and warm
because of the 4.5.3) . . . of air.
4.6 The west winds or westerlies, the most important winds of the 4.6.1) . . .
latitudes, originate in the subtropical 4.6.2) . . . pressure systems and from there
blow to the 4.6.3) . . . pressure areas of the subpolar regions in the vicinity of
latitude 4.6.4) . . . .
4.7 The 4.7.1) . . . easterlies originate in the 4.7.2) . . . pressure belt in the cold areas
near the 4.7.3) . . . and blow towards the low pressure areas of the 4.7.4) . . .
regions.
(18 × 2) (36)
Question 5
The migration of the wind systems
5.1 In the southern hemisphere summer (December) all the wind and pressure belts
have shifted a few degrees to the . . . . (2)
5.2 By June they have shifted a few degrees to the . . . . (2)
(2 × 2) (4)
[92]
© Via Afrika Publishers » G e o g r a p h y 11 Study Guide eBook 53
TOPIC 1 The atmosphere
Answers to Questions
Question 1
1.1 low
1.2 low
1.3 high
1.4 high
1.5 high
1.6 low
1.7 high
1.8 low
1.9 low
1.10 high
1.11 low
1.12 low
1.13 high
1.14 low
(14 × 2) (28)
Question 2
2.1 isobars
2.2 joining places with the same atmospheric pressure
(2 × 2) (4)
Question 3
3.1 high
3.2 low
3.3 high
3.4 low
3.5 easterlies or polar easterlies or north-easterlies
3.6 westerlies or south-westerlies
© Via Afrika Publishers » G e o g r a p h y 11 Study Guide eBook 54
TOPIC 1 The atmosphere
3.7 north-east trades
3.8 Hadley cell
3.9 Ferrel cell
3.10 polar cell
(10 × 2) (20)
Question 4
4.1 Inter-tropical Convergence Zone
4.2.1 south
4.2.2 north
4.3 trade winds
4.4.1 high
4.4.2 equatorial
4.4.3 5° to 35°
4.5.1 polar
4.5.2 dry
4.5.3 descent
4.6.1 middle
4.6.2 high
4.6.3 low
4.6.4 60°
4.7.1 polar
4.7.2 high
4.7.3 poles
4.7.4 subpolar
(18 × 2) (36)
Question 5
5.1 south
5.2 north
(2 × 2) (4)
[92]
© Via Afrika Publishers » G e o g r a p h y 11 Study Guide eBook 55
TOPIC 2 Geomorphology
Topic 2 Geomorphology
Unit 1 Topography associated with
horizontally layered rocks
1 What are horizontally layered rocks?
Rocks can be in horizontal layers, inclined layers, or massive. Topography associated
with horizontally layered rocks develops where layers of the rock are flat-lying.
1.1 How do horizontally layered landscapes develop?
The landscapes that develop are hilly landscapes, basaltic plateaus, canyon
landscapes, and Karoo landscapes.
1.1.1 Hilly landscapes
Hilly landscapes are influenced by the climate of the region and the resistance of the
rock. In hot and humid regions the slopes are gentle and rounded. High rainfall results
in mass wasting and sheet erosion, while higher temperatures encourage chemical
weathering.
1.1.2 Basaltic plateaus
Basaltic plateaus are also called lava plateaus. They are built up over millions of years
by lava pouring out of long narrow cracks in the ground. The lava floods the landscape
building up to form deposits hundreds to thousands of metres thick. The Drakensberg is
the remnants of a basaltic plateau, and a popular tourist and holiday destination in
South Africa.
1.1.3 Canyon landscapes
[a/w2.8]FIGURE 5 The edge of the Canyon landscapes develop where horizontal layers erode at different rates. At first the
Drakensberg basaltic lava plateau land is level, but running water soon finds weak places in the hard surface layer. The
rivers erode vertically into the land and form deep valleys. The valleys have stepped
sides. The resistant rock forms steep cliffs and the less resistant rock forms the more
gentle slopes.
© Via Afrika Publishers » G e o g r a p h y 11 Study Guide eBook 56
TOPIC 2 Geomorphology
Uses of canyons:
• Canyons sometimes are dammed to make very deep dams, often used for hydro-
electric power.
• The surrounding plateau itself may be too dry to be of agricultural value.
• Impressive scenery makes canyons good tourist attractions.
1.1.4 Karoo landscapes
• Karoo landscapes develop from canyon landscapes.
• Large areas are covered with horizontal layers.
• The plateau is protected by a resistant hard rock such as dolerite.
• Rivers erode vertically, forming canyons.
FIGURE 46 Features of a Karoo landscape
2 What is scarp retreat?
• The valleys widen by means of scarp retreat or back wasting.
• Scarp retreat is caused by lateral erosion, mass movement and weathering.
• It takes place over millions of years and reduces the original plateau to mesas,
buttes and conical hills.
FIGURE 47 The development of a mesa by scarp retreat or back wasting
© Via Afrika Publishers » G e o g r a p h y 11 Study Guide eBook 57
TOPIC 2 Geomorphology
FIGURE 48 A mesa undergoes lateral erosion to form a butte. When the resistant cap rock erodes, what
is left is a conical hill.
FIGURE 49Teebus and Koffiebus are a mesa and conical hill respectively: (a) Photograph; (b) Google Earth
vertical photograph; (c) Topographic map
The Karoo landscape is arid and the landforms are of no particular significance to
humans. A lack of rainfall, steep slopes and extremely shallow topsoil are not suitable
for growing crops but the Karoo is a successful sheep farming area.
© Via Afrika Publishers » G e o g r a p h y 11 Study Guide eBook 58
TOPIC 2 Geomorphology
Unit 2 Topography associated with
inclined rock strata
1 What does topography in inclined (tilted) layers look like?
• Large areas of South Africa have tilted or inclined sedimentary rock. Inclined strata
are layers of rock below the Earth’s surface which tilt at an angle.
• The tilting was caused by tectonic forces, resulting in both hard and soft layers of
rock being exposed at the surface. This is illustrated in Figure 50.
Figure 50 Inclined strata. Note the angle at which the harder layer dips, indicated in red.
As a result of the continued eroding action of running water, mass movements and
weathering the difference in resistance of the different layers causes homoclinal ridges.
• The softer layers will be removed more easily than the harder layers. Figure 51
shows how the harder layers remain as parallel ridges.
• These ridges are known as collectively homoclinal ridges. The steeper slope is called
the scarp slope and the more gentle slope is called the dip slope.
© Via Afrika Publishers » G e o g r a p h y 11 Study Guide eBook 59
TOPIC 2 Geomorphology
FIGURE 5 1 Valley and ridge topography in tilted strata
1.1 How are homoclinal ridges classified?
Homoclinal ridges are classified according to the angle of the dip slope. The type of
homoclinal ridge depends on the gradient at which the layers dip.
• cuestas, where the layers dip very gradually at 10° to 25°
• homoclinal ridges dip from 25° to 45°, for example the Magaliesberg
• hogsback ridges, where the dip slope is very steep, at an angle greater than 45°, for
example the Hogsback, north of Alice in the Eastern Cape.
(a) (b) (c)
FIGURE 5 2 Cuesta (a), homoclinal ridge (b) and hogsback (c)
1.2 What are cuesta basins and cuesta domes?
Cuestas can form basin-shaped or dome-shaped structures.
• In a basin, the scarp slope of a cuesta will face the outside and the dip slope will be
face the inside (Figure 53a).
• In a dome, the scarp slope faces the inside and the dip slope faces the outside
(Figure 53b).
© Via Afrika Publishers » G e o g r a p h y 11 Study Guide eBook 60
TOPIC 2 Geomorphology
(a) (b)
FIGURE 5 3 Cuesta basin (a) and cuesta dome (b)
1.3 Of what significance are cuesta landscapes to humans?
• When dipping layers erode, the harder layers provide less fertile soil. The slopes
may then be suitable for forestry.
• Cuestas are usually low, so they do not cause traffic obstacles.
• Underground water and oil can be trapped in and extracted from cuestas.
© Via Afrika Publishers » G e o g r a p h y 11 Study Guide eBook 61
TOPIC 2 Geomorphology
Unit 3 Topography associated with
massive igneous rocks
1 What are massive igneous rocks?
• Unlike sedimentary rocks, most igneous rocks do not form layers. Massive igneous
rocks are formed when magma cools down and solidifies.
• When these rocks are exposed by weathering and erosion, they usually appear at
the surface as granite domes or tors.
1.2 What are the intrusive bodies associated with massive
igneous rocks?
FIGURE 5 4 Intrusive bodies associated with massive igneous rocks
• Landforms such batholiths, laccoliths, lopoliths, dykes, sills and pipes are formed
by intrusive igneous activity (Figure 54).
• These rocks are formed when an enormous mass of magma does not reach the
surface, but instead pushes (intrudes) into spaces underground and then solidifies.
• These formations may be exposed on the surface of the Earth only after millions of
years of erosion.
© Via Afrika Publishers » G e o g r a p h y 11 Study Guide eBook 62
TOPIC 2 Geomorphology
TABLE 14 The various intrusive igneous rock bodies
Intrusion Description
Batholith Largest of all intrusive forms. It is usually made of granite. Paarl Mountain is an example of a
batholith.
Laccolith A mushroom-shaped intrusion. It pushes the overlying strata upwards.
Lopolith Magma intrudes between sedimentary layers. The layer underneath cannot support the
weight and sinks down. A saucer-shaped intrusion is formed. It is connected to the magma
source by means of a dyke or pipe.
Dyke A wall-like intrusion that cuts almost vertically across existing strata.
Sill A horizontal rock layer formed as magma spread between layers.
Pipe A chimney-shaped intrusion. Magma can move through a pipe, often to the surface.
2 Granite domes and tors
2.1 How are granite domes formed?
Granite domes usually arise from batholiths or laccoliths, which intrude into and
penetrate sedimentary layers. Erosion and weathering then occurs until a large granite
mass appears on the land surface.
FIGURE 5 5 Stages in the exposure of a batholith to form a granite dome by erosion
© Via Afrika Publishers » G e o g r a p h y 11 Study Guide eBook 63
TOPIC 2 Geomorphology
2.2 What are tors and how are they formed?
• Tors look like a heap of partially rounded boulders, called core stones looking like
they are piled on top of each other.
• They are found in regions where there are massive igneous rocks, usually granite.
This type of rock formation often consists of granite. In South Africa, there are many
tors in Namaqualand and the Lowveld.
• Tors are caused by chemical weathering below the surface. Vertical and horizontal
joints in the rock are formed as magma cools and contracts.
• When water passes through the joints they are widened by chemical weathering. As
the joints widen, distinctive rock shapes are formed.
• The rocks break down and become more rounded.
FIGURE 56 The formation of tors by weathering of jointed igneous rock
© Via Afrika Publishers » G e o g r a p h y 11 Study Guide eBook 64
TOPIC 2 Geomorphology
Unit 4 Slopes
1 Overview of South Africa’s topography
1.1 What does South Africa’s topography look like?
• South Africa has an average altitude of about 1 200 metres above sea level, and
nearly half of the surface is at a higher elevation. Parts of Johannesburg are more
than 1 800 metres above sea level.
• The land rises steadily from west to east to the Drakensberg Mountains, part of the
Great Escarpment, to a height of 3 408 metres above sea level.
• The country comprises five main physiographic regions (Figure 57):
• the south western Cape Fold Belt mountains
• the coastal plain, which extends from the Namibian border all along the coast to
Mozambique
• a vast saucer-shaped interior plateau
• the Great Karoo basin from 1 400−1 600 metres above sea level and the Kalahari
basin bordering on Namibia and Botswana
• the central Highveld situated at 1 600−1 700 metres above sea level.
FIGURE 57 The five main physiographic regions of South Africa
© Via Afrika Publishers » G e o g r a p h y 11 Study Guide eBook 65
TOPIC 2 Geomorphology
2 Types of slopes
2.1 What is a slope?
Slopes can be described as curved, inclined surfaces that form the boundaries of
landforms like mountains, plateaus, hills.
2.2 What do the different types of slopes look like?
The plan dimensions of slopes are illustrated by distinct contour patterns. Slopes form
spurs, valleys, cirques, hills and ridges. These are all combinations of slopes arranged
in particular patterns. Figure 58 shows the different types of slopes.
Regular slope Convex slope Concave slope
FIGURE 5 8 Types of slopes
3 Slope elements and characteristics
There are four slope elements. From the top to the bottom, they are:
• The crest, is at the top of the hill and usually has a convex shape. The main
geomorphological processes acting on it are weathering and soil creep.
• The free face, scarp or cliff, is the almost vertical slope. It is too steep for any loose
material to collect on it. The main geomorphological process acting on it is mass
movement.
• The talus, debris or scree slope, is the smooth slope at the foot of the free face.
Deposition is the main geomorphological process on the talus slope.
• The pediment is the plain at the base of a slope. It may be slightly concave in shape.
Between the talus and the pediment slope, there is sometimes a distinct break in the
profile, called the knickpoint. Erosion by running water is the main
geomorphological process.
© Via Afrika Publishers » G e o g r a p h y 11 Study Guide eBook 66
TOPIC 2 Geomorphology
FIGURE 59 The Four-element slope
All four slope elements are not present on all slopes. One or more of them may be
repeated, as in areas where there are alternating layers of hard and soft rock.
FIGURE 60 Duplication of slope features because of alternating layers of hard and soft rock
4 How do slopes develop over time?
There are various different theories to explain the origin of slopes. Here we will discuss
the concept of parallel slope retreat.
4.1 What is parallel slope retreat?
The slope angle and lengths remain constant as the slope retreats parallel to itself for
each part of the slope. The pediment increases in length over time.
FIGURE 61 Parallel slope retreat maintains the slope profile as the pediment widens.
© Via Afrika Publishers » G e o g r a p h y 11 Study Guide eBook 67
TOPIC 2 Geomorphology
Unit 5 Mass movements and human
responses
1 What is mass movement?
Mass movement is the movement of weathered materials down a slope. This movement
may be gradual or sudden, depending on:
• the gradient of the slope
• the weight of the debris
• the presence of any lubricating moisture.
1.1 What triggering events cause mass movement?
Triggering events can occur at any time, causing the slope to become unstable.
Examples of triggering events are:
• earthquakes
• modification of slopes by humans
• undercutting of cliffs by waves or rivers
• heavy rains
• volcanic activity.
FIGURE 62 Factors that influence slope stability
© Via Afrika Publishers » G e o g r a p h y 11 Study Guide eBook 68
TOPIC 2 Geomorphology
2 What are the different kinds of mass movement?
2.1 Soil creep
Soil creep is the slow down slope movement of soil. It takes place at an average rate of 1
mm a year.
FIGURE 63 The effects of soil creep
2.2 Solifluction
Solifluction is a very slow down slope movement of water-saturated soil, averaging
between 5 and 20 cm a year. It occurs in regions when debris become saturated after
heavy rain or in tundra regions when ground thaws in spring.
FIGURE 64 Solifluction
2.3 Landslides
Landslides occur when a large mass of land breaks loose and plunges down a slope. It
causes great economic loss by the destruction of infrastructure such as roads, railways,
dams and bridges.
© Via Afrika Publishers » G e o g r a p h y 11 Study Guide eBook 69
TOPIC 2 Geomorphology
2.4 Rock falls
Rock falls are very rapid movement of material on slopes exceeding 40°. Rocks break
loose from the slope due to weathering, frost action and earthquakes. These rocks
collect at the bottom of the slope.
2.5 Mud flows
Mud flows occur on steep slopes after very heavy rain. It is like a stream of mud and
exceeds 1 km/h. It happens in arid regions after heavy rain.
FIGURE 65 Mudflow
2.6 Slumps
Slumps are slope failure caused by rotational movement. The movement can be fast or
slow. It is downward and outward along a curved concave rupture surface (Figure 66).
It occurs in areas where softer materials overlie more resistant rocks.
FIGURE 66 Slump
© Via Afrika Publishers » G e o g r a p h y 11 Study Guide eBook 70
TOPIC 2 Geomorphology
3 Impact of mass movements
3.1 What are the effects of mass movement on the environment?
Mass movements produce a variety of effects. They include:
• Mass movement carries a material such as soil and rock from high altitudes to lower
altitudes, and is a major factor in natural erosion.
• A landslide may block a river, damming the water and causing it to form a lake.
• A sudden rush down a steep slope can cause great destruction to vegetation and
animal life.
• A landslide may cause floods by damming up bodies of water.
• Landslides can travel many kilometres from their source, growing in size as they
pick up trees, rocks and other materials along the way.
3.2 What are the effects of mass movement on people?
The most severe effect of mass movement on people is loss of life by landslides. The
other effects are mostly economic.
• The slow movement of creep does a lot of long term economic damage to railroads,
building structure and underground pipes.
• Landslides cause loss of productivity of agricultural lands.
• Interruption of transportation systems by landslides causes a loss of industrial
productivity.
• Road closures force road users to take long detours.
4 How can the effects of mass movement be minimised?
People can minimise mass movement in the following ways:
• plant natural vegetation on slopes
• safety nets to stop rockfalls
• build drainage and run-off channelling structures to remove access water
• build retaining walls
• fasten unstable rocks with rock bolts.
© Via Afrika Publishers » G e o g r a p h y 11 Study Guide eBook 71
TOPIC 2 Geomorphology
Questions
Question 1
Match column A with the correct description in column B. (12 × 20) (24)
A B
1.1 Cuesta A Asymmetrical ridge where the dip slope is at an angle of 25−45°
1.2 Tor B Gentle slope of a cuesta
1.3 Crest C Large flat-topped hill
1.4 Mesa D Steep slope of a cuesta
1.5 Butte E Very slow movement
1.6 Pediment G Asymmetrical ridge where the dip slope is at an angle greater than
45°
1.7 Soil creep H Slope at a constant angle that is formed of eroded material.
1.8 Talus slope I Almost vertical free face slope
1.9 Hogsback J Occurs after a butte is eroded
1.10 Dip slope K Small convex shaped slope
1.11 Scarp slope L Almost flat slope
1.12 Homoclinal ridge M Small flat-topped hill
N A landform caused by the chemical weathering of joints below the
earth’s surface.
O Asymmetrical ridge where the dip slope is at an angle of 10−25°
Question 2
Multiple choice. Match the question with the correct option. (14 × 2) (28)
2.1 What type of a slope is the scarp slope of a cuesta?
A dip
B ridge
C steep
D concave
E gentle
2.2 What factors determine the shape of relief associated with inclined strata?
A the degree of rock resistance and the flow of the water
B the angle of slope and running water
C tectonic forces and faults
D running water and rejuvenation
© Via Afrika Publishers » G e o g r a p h y 11 Study Guide eBook 72
TOPIC 2 Geomorphology
E the degree of rock resistance and the angle of slope
2.3 What is a mesa?
A a type of cuesta
B a type of inclined strata
C a type of dome
D a type of tor
E none of these
2.4 Which of the following landforms is associated with horizontal strata?
A homoclinal ridge
B hogsback
C cuesta
D all of the above
E none of the above
2.5 Which of the following landforms is associated with inclined strata
A cuesta
B homoclinal ridge
C butte
D A and B
E none of these
2.6 Tors are associated with . . . .
A igneous rocks
B inclined strata
C sedimentary rocks
D horizontal rocks
E fold mountains
2.7 Tors occur when . . . .
A wind erodes the joints to form boulders
B well-jointed mounds of rounded igneous boulders form
C igneous rock weathered into well-jointed boulders
D rounded boulders are deposited in mounds due to fluvial action
E both B and C
2.8 The pediment is . . . .
A slightly concave
© Via Afrika Publishers » G e o g r a p h y 11 Study Guide eBook 73
TOPIC 2 Geomorphology
B slightly convex
C at the top of the hill
D a stepped slope
E both A and C
2.9 What extremely large surface features are associated with massive igneous
rocks?
A mesas, buttes and domes
B hogsback ridges and tors
C cuestas, tors and homoclinal ridge
D granite domes and tors
E all of the above
2.10 Slopes that have been stable for many years may sometimes collapse. What is a
common trigger for these failures?
A removal of vegetative cover
B reducing the gradient of the slope
C draining of water from the slope
D growth of vegetation on the slope
2.11 A rockfall occurs when . . . .
A a block of bedrock breaks off and falls freely from a cliff
B rock layers are displaced slowly down the slope year after year
C soil, mud and debris move down the slope as a fluid
D all of these
2.12 One method of stabilising slopes to prevent mass movement is . . . .
A build appropriately engineered retaining structures
B cut away the base of the slope with heavy equipment
C add weight to the slope
D make the slope steeper
2.13 Which of the following is a form of mass movement?
A a landslide
B a rock avalanche
C a mudflow
D all of these are forms of mass movement
2.14 The downslope movement of soil under the influence of gravity is known as . . . .
© Via Afrika Publishers » G e o g r a p h y 11 Study Guide eBook 74
TOPIC 2 Geomorphology
A downslope movement
B soil creep
C mass movement
D rockfalls
E none of these
Question 3
Read the newspaper article below, study the diagram and answer the questions about
mass movement that follow.
400 buried in Taiwanese mudslide
Taipei: A mudslide touched off by a typhoon has buried a mountain village in Taiwan, leaving at least 400
people unaccounted for. Typhoon Morakot slammed Taiwan over the weekend with 2 000 mm of rain. A
disaster appeared to be unfolding at the southern village of Shiao Lin, hit by a mudslide on Sunday and
now cut off by land from the outside world. A Taiwanese official said 400 people were unaccounted for in
the village. [Daily News, 11 August 2009]
FIGURE 67 A mudslide
3.1 What is meant by the term mass movement? (2)
3.2 What evidence in the sketch indicates that a mudslide has occurred? (2)
3.3 How was typhoon Morakot responsible for triggering the mudslide in Taiwan? (2)
3.4 State three economic impacts of mass movements on small villages like the one
in Taiwan. (2 × 3) (6)
3.5 Describe three ways in which humans are responsible for causing mass
movements. (2 ×3) (6)
3.6 Explain any three precautionary measures (methods) that people should adopt
© Via Afrika Publishers » G e o g r a p h y 11 Study Guide eBook 75
TOPIC 2 Geomorphology
(put in place) before using slopes for development. (2 × 3) (6)
(26)
Question 4
Study the photograph in Figure 68 below showing a landform in the Karoo and answer
the questions that follow.
A
B
FIGURE 68 Photograph of a landform in the Karoo
4.1 Name the landform shown in Figure 68. (2)
4.2 Name the geomorphologic process taking place at A. (2)
4.3 Predict how this landscape will change over a long period of time. (4)
4.4 Sketch the landform shown in Figure 68. On the sketch label the four slope
elements. (10)
4.5 Discuss the economic potential of the area marked B. (4)
4.6 Outline three difficulties that this type of landscape poses to human activities. (6)
(28)
[104]
© Via Afrika Publishers » G e o g r a p h y 11 Study Guide eBook 76
TOPIC 2 Geomorphology
Answers to Questions
Question 1
1.1 O
1.2 N
1.3 K
1.4 C
1.5 M
1.6 L
1.7 E
1.8 H
1.9 G
1.10 B
1.11 D
1.12 A
(12 × 2) (24)
Question 2
2.1 C
2.2 E
2.3 E
2.4 E
2.5 D
2.6 A
2.7 E
2.8 A
2.9 D
2.10 A
2.11 A
1.12 A
2.13 D
© Via Afrika Publishers » G e o g r a p h y 11 Study Guide eBook 77
TOPIC 2 Geomorphology
2.14 C
(14 × 2) (28)
Question 3
3.1 The process by which soil, regolith, and rock move downslope. (2)
3.2 The mud that has moved down the slope from the hollow. (2)
3.3 The 2 000 mm of rain from Typhoon Morakot caused the mudslide. (2)
3.4 There will be huge economic impacts. Three of: damaged roads and railways, no
electricity, no clean water, houses, shops and factories destroyed, bread-
winners killed, loss of agricultural land, crops destroyed. Plus any acceptable
answer. (2 × 3) (6)
3.5 Three of: destroying vegetation, not building suitable drainage and run-off
structures, using slopes that are too steep, building on unsuitable soils. (2 × 3) (6)
3.6 Three of: avoid steeper slopes, don’t destroy vegetation on slopes, plant trees on
slopes, safety nets to stop rockfalls, build drainage and run-off channelling
structures to remove access water, build retaining walls, fasten unstable rocks
with rock bolts. (2 × 3) (6)
(24)
Question 4
4.1 Butte (2)
4.2 Parallel scarp retreat or scarp retreat or rockfalls (2)
4.3 The size of the butte will decrease to form a conical hill. (2) The size of the
pediplain will increase. (2). (4)
4.4 Sketch showing a butte: (2) Crest (2), cliff/free face (2), talus/scree (2), pediment
(2) (10)
FIGURE 69 Labelled sketch of a Karoo landform
© Via Afrika Publishers » G e o g r a p h y 11 Study Guide eBook 78
TOPIC 2 Geomorphology
4.5 Grazing for goats, sheep or ostriches. (2) Crops only possible with irrigation. (2)(4)
4.6 Three of: Area is dry, soils poor/thin, limited infrastructure such as roads and
railways, large distance to markets. (3 × 2) (6)
(28)
[104]
© Via Afrika Publishers » G e o g r a p h y 11 Study Guide eBook 79
TOPIC 3 Development geography
Topic 3 Development geography
Unit 1 The concept of development
1 What is meant by development?
Every country will develop in different ways according to the needs of its people.
Development is not just about wealth − it is about using resources and technology to
improve people’s quality of life, which is how happy and content people are.
Environmental care and development are interdependent.
• Development refers to characteristics that describe the stage a country has reached
on economic, cultural, social and technological levels.
• Development is about realising the natural and human resource potential of a
country, a region or a locality.
• It is one way to reduce poverty and improve the quality of people’s lives.
Development includes two aspects of improvement in the life of people:
• Standard of living is the value of their possessions and savings, the type of home
they live in and whether they own items such as a washing machine, television, car,
telephone and computer.
• Quality of life is the general well-being of a person. It includes standard of living,
but it is also affected by education, health care, services, utilities, environment, and
social, political and religious freedom.
A country’s wealth comes from its ability to develop its resources and produce goods
and services and the income that may be earned from providing goods and services to
other countries. The development of resources, goods and services makes up the
economy of a country. The economy can be divided into economic sectors or industries.
© Via Afrika Publishers » G e o g r a p h y 11 Study Guide eBook 80
TOPIC 3 Development geography
TABLE 15 The five economic sectors
Economic sector Explanation
Primary economic Extraction of natural resources such as mining, quarrying, agriculture,
activities fishing, forestry and hunting.
Secondary economic Processing of primary raw materials and the manufacture of products.
activities
Tertiary economic Service industries, whereby tangible or physical products are not made.
activities However, many service industries assist manufacturing such as banking,
transport or insurance.
Quaternary economic Research and development needed to produce products from natural
activities resources. It is concerned with providing information and expertise.
Quinary economic The highest levels of decision making in a society or economy.
activities
The percentages employed in the different sectors give an indication of economic
development as can be seen in Table 16.
TABLE 16 Economic classification of countries in terms of their development
LEDC – Less economically NIC – Newly industrialised MEDC – More economically
developed country (also ELDC) economy developed country (also EMDC)
• Primary economic activity • Strong manufacturing sector • Automation of
dominant • Many transnationals move to manufacturing or transfer of
• Mechanisation on farms is NICs to take advantage of manufacturing to NICs
low cheap labour and land • Very strong tertiary sector
• In early stages of economic with large numbers
development employed in health,
• Informal service sector in education and tourism
the cities is quite strong • Growth of jobs in the
knowledge economy
1.1 Why aim for development?
• The Millennium Development Goals (MDGs) provide a framework for the whole
world to work together towards making sure that human development reaches
everyone, everywhere.
• The MDGs were set to be achieved by 2015.
• If these goals are met, world poverty will be cut by half, millions of lives will be
saved, and billions more people will have the opportunity to benefit in the global
economy.
© Via Afrika Publishers » G e o g r a p h y 11 Study Guide eBook 81
TOPIC 3 Development geography
FIGURE 70 The Millennium Development Goals seek to improve the lives of billions of people by 2015.
2 Why is development unequal?
• The idea of development being a sliding scale is known as the development
continuum. There is no right or wrong way to approach development with countries
developing in different ways and at different speeds.
• Development success all over the world has been most visible in social rather than
economic matters.
• Developing countries have found it difficult to achieve the same sort of economic
success that richer nations have.
• The advances that poorer countries have made in health matters have been
impressive. Infant mortality has dropped and life expectancy is now much longer in
developing countries.
2.1 Economic, social and spatial aspects of development
The map in Figure 71 shows the Brandt line that divides the world into the MEDCs
mostly to the north and the LEDCs to the south.
© Via Afrika Publishers » G e o g r a p h y 11 Study Guide eBook 82
TOPIC 3 Development geography
FIGURE 71 The Brandt line ‘north/south divide’
2.2 Appropriate scale and sustainable development
• Sustainable development means meeting needs of the present populations without
compromising the opportunities open to future generations.
• The use of appropriate sustainable technology is vital to keep developing
communities from overusing natural resources.
2.2.1 Appropriate technology
• Methods suited to local people and environment in which they live
• Does not impose western ideology on development
• Addresses a basic human need – like access to clean drinking water
• Sustainable materials
• Appropriate to cultural aspects of local community
• Making daily tasks simpler
• No excessive resources required
• Increases standard of living.
© Via Afrika Publishers » G e o g r a p h y 11 Study Guide eBook 83
TOPIC 3 Development geography
3 How is development determined?
• Some regions are better off than others. This is called regional disparity because it
deals with inequality between different areas.
• We need to have a set of indicators showing these differences.
TABLE 17 Development indicators provide a measure of a country’s level of development.
Economic development Human and social development Demographic development
• Gross Domestic Product • Physical Quality of Life Index • Life expectancy – average
(GDP) (PQLI) life span in years
• Gross National Product • Human Development Index (HDI) • Infant mortality – number of
(GNP • Gini-coefficient infant deaths per thousand
• Purchasing Power Parity per year
(PPP)
• The GDP measures the • The PQLI is the average of three • Life expectancy is one of
total market value of all variables – literacy, life the traditional indicators of
goods and services expectancy and infant mortality. health. In the developed
produced for final use in a • HDI takes into account economic world people are living
year. and social development. Is longer. In Japan people
• The GDP considers only recorded as a score from 0 to 1, expect to live 80 years on
workers and capital spent with 1 being the most developed average. In Mozambique,
within the nation, while (index scale ranging from 0 to people only expect to live
the GNP considers 100). 36,6 years.
workers and capital spent • The global standard for
by citizens of a nation, calculating income disparity is
regardless of where they the Gini-coefficient.
live. • Limitation – due to lack of data
• Disadvantage – does not in many countries the Gini-
show differences in coefficient could not be
wealth within a country. calculated.
• PPP is the level of GNP
adjusted to local costs of
living.
© Via Afrika Publishers » G e o g r a p h y 11 Study Guide eBook 84
TOPIC 3 Development geography
4 How does development compare on local, regional
and global scales?
Growth and development become concentrated in a few favoured locations, leaving
other places relatively poor and under-developed by comparison.
FIGURE 72 World infant mortality rates show low infant mortality in high-income countries.
High-income countries display a low infant mortality rate. Access to medical care and
smaller families ensure lower levels of infant mortality. Low-income countries have a
high infant mortality rate.
© Via Afrika Publishers » G e o g r a p h y 11 Study Guide eBook 85
TOPIC 3 Development geography
Unit 2 Frameworks for development
1 What factors affect development?
Physical factors
Physical factors
Political factors
Access to resources
Trade Imbalances
Energy
History
Natural resource limitations
Factors
affecting
development
Cultural and social factors Environmental
Education and Training degradation
Population Growth
FIGURE 73 LEDCs often are trapped in the downward cycle of underdevelopment.
1.1 Access to resources
• One of the most important factors in development is geography, where the country
is located in the world, and the country’s climate.
• The poorest countries are in the tropics, where it is hot, the land is less fertile, water
is often scarcer and diseases flourish.
• Europe and North America have large tracts of very fertile land, a temperate climate
and good rainfall.
• In very hot or cold climates much energy goes into survival and there is not much
left over for economic development.
© Via Afrika Publishers » G e o g r a p h y 11 Study Guide eBook 86
TOPIC 3 Development geography
1.2 Energy
• The largest energy consumers are the richer countries of North America and Europe.
Global demand for energy is increasing rapidly. It is expected to double by 2030.
• Increasing fuel prices and concern about national fossil fuel emissions will mean
that our power generation industries have to become more efficient.
• It is difficult for developing countries to move away from fossil fuels like coal for
power generation.
1.3 Population growth
Countries with a rapidly increasing population may not have enough resources for
development.
FIGURE 74 Rapid population growth strains resources
1.4 Trade imbalances
• International trade is not always fair towards poorer countries.
• Poorer countries tend to export lower-value raw materials, often to richer countries.
• Richer countries tend to export higher-value manufactured goods, which poorer
countries struggle to afford.
1.5 Unstable governments
Historical factors may present an obstacle to the development of a country. War,
corruption and incompetence are the main factors here.
1.6 Environmental degradation
This continues the cycle of underdevelopment as it can ruin farming and fishing.
© Via Afrika Publishers » G e o g r a p h y 11 Study Guide eBook 87
TOPIC 3 Development geography
2 Which development path?
Various models have been proposed to explain the differences in world development.
FIGURE 75 Three development models: Rostow’s model, the Core-periphery model and the Sustainability model
Three development models are shown in Figure 75:
• Rostow’s model
• The Core and periphery model
• The Sustainability model
2.1 Rostow model
This says that all countries have the potential to go through five stages of growth. This
model accurately describes the economic growth of many industrialised countries.
2.1.1 Limitations and criticisms
• The theory does not fit every country perfectly. For example, New Zealand became a
very successful developed country without being highly industrialised.
• Not all developed countries have experienced a sudden ‘take-off’ stage.
• Development in most countries appears to have a gradual process of change.
• The conditions facing LEDCs today are very different from those which MEDCs faced
in the past.
• The assumption is that economic growth will ‘trickle-down’ to everyone in the
country. Some countries have developed into dual societies, divided into rich and
poor.
© Via Afrika Publishers » G e o g r a p h y 11 Study Guide eBook 88
TOPIC 3 Development geography
2.2 Core and periphery model
Economic growth and development are rarely even. Economic activity, including the
level of industrialisation and intensity of farming, decreases rapidly with distance from
the core regions and towards the periphery or outer regions.
2.3 Sustainability model
Sustainable development is probably the biggest challenge that humanity has ever
faced. Sustainable development is development that meets the needs of the present
without making problems for future generations to meet their own needs by conserving
the world’s resources. Sustainable development incorporates two key aspects:
1 that the essential needs of the world’s poor should be given priority
2 that the Earth’s environment is limited in its ability to meet present and
future needs.
2.3.1 Sustainability model: three elements
1 Economy – strategic planning for the life cycle of a community is necessary.
2 Social – a platform to discuss equity and social disparity features.
3 Environment – Understand the ecological health of communities by effective
use of natural resources.
3 Rural and urban community-based development
Since 1994, government has developed a strategy to formulate public policy and to plan
and establish economic policies that directly support community empowerment.
The most important aspects of community-driven projects for development are:
• Bottom-up approach to development
• Community driven
• Build local economies
• Alleviate poverty and vulnerability
• Sustainable development
• Capacity building
• Long-term economic development
• Community empowerment
• Increase access to market
• Focus on disaster preparedness
© Via Afrika Publishers » G e o g r a p h y 11 Study Guide eBook 89
TOPIC 3 Development geography
Unit 3 Trade and development
1 What is international trade?
• Trading happens because of the uneven distribution of raw materials over the
Earth’s surface.
• It plays a major role in the economy of all countries.
• No country has an adequate supply of the full range of minerals, fuels, foods,
manufactured goods or services to make it self-sufficient.
• Trade happens when a producing country is able to produce goods and services
more cheaply, or of a better quality, than the consuming country.
• International trade is the exchange of goods and services between countries.
• The raw materials, goods and services bought by a country are called imports and
those sold by a country are exports.
• Countries that earn more from their exports than they pay for their imports have a
trade surplus. This enables them to become richer.
• Countries that spend more on imports that they earn from their exports have a trade
deficit. They become poorer.
FIGURE 76 South–South trade is a growing component of international trade.
1.1 Trade commodities
Many of the world’s poorest countries still depend heavily on exporting primary
products. This has a number of disadvantages:
• OPrimary products or unprocessed raw materials are usually processed elsewhere, to
make more sophisticated products.
• Manufactured products have ‘added value’ because they can be sold at a greater
profit.
© Via Afrika Publishers » G e o g r a p h y 11 Study Guide eBook 90
TOPIC 3 Development geography
• Most processing of primary products is done in MEDCs, which benefit from the
profits and jobs this creates.
• Coffee is an example. LEDCs such as Uganda, Ethiopia and Rwanda depend on
coffee for more than half of their export earnings, yet for every jar of instant coffee
sold, the primary coffee producers receive less than a third of the supermarket price.
• The coffee processing, packaging, advertising and retailing are all done in MEDCs.
• World prices for primary products such as coffee often fluctuate wildly. Falls in
prices reduce the income of countries that export primary products.
1.2 Terms of trade
MEDCs make much more money from trade than LEDCs. Why is this?
• OLEDCs export raw materials (crops, timber, ores) to MEDCs.
• OMEDCs export manufactured and processed goods (processed food, vehicles,
electronics) to LEDCs.
• ORaw materials have much less value than manufactured goods.
2 Is trade fair?
World trade has increased considerable recently and LEDCs have gained the least from
this growth. Why is this?
• Countries try to protect their own economies by imposing tariffs and quotas on
foreign imports.
• The World Trade Organisation aims to promote free trade by removing these
restrictions.
• Trading groups, such as the European Union, are set up to promote free trade
between their members and to reduce the effectiveness of foreign competition.
• Countries try to protect their own economies by having different trade relationships.
These include free trade, trade barriers, subsidies and fair trade.
2.1 Free trade
Free trade occurs when the movement of goods and services between countries is not
restricted in any way.
• The benefit is that consumers can gain from lower prices from the efficient use of
resources through mass production.
• Free trade does not necessarily benefit all nations, as wealthier nations are able to
exploit the labour and resources of poorer nations.
© Via Afrika Publishers » G e o g r a p h y 11 Study Guide eBook 91
TOPIC 3 Development geography
• All nations control trade with other nations through various means such as tariffs
and price supports for their country’s firms.
FIGURE 77 An example of free trade benefiting both the USA and Brazil
2.2 Trade barriers
• Trade barriers are government-induced restrictions on international trade.
• Most trade barriers work on some sort of cost on trade that raises the price of the
traded products.
• Apart from tariffs and quotas, there are subtler forms of trade barriers. These are
non-tariff trade barriers. Examples are:
• Complex import and export regulations
• The need to obtain permits for using airports and harbours which delay a foreign
company’s attempts to distribute and sell its products.
• Packaging laws within a country drive up costs for foreign imports.
• One of the most effective and controversial non-tariff barriers is the imposition
of product quality standards. These standards are so tough that the foreign
product has no chance of meeting them.
© Via Afrika Publishers » G e o g r a p h y 11 Study Guide eBook 92
TOPIC 3 Development geography
2.3 Subsidies
A country’s government may give support to one of its own industries improving its
competitive position at home. For example, farming subsidies are always requested by
the rural community.
2.4 Fair trade
• Fair trade is different from free trade.
• When a product is labelled ‘Fair Trade’ it provides a guarantee that farmers and
producers in developing countries receive a fair deal.
• Fair trade is a way of doing business that ensures the people who produce the raw
materials benefit.
3 The concept of globalisation and its impact on
development
• Globalisation can be defined as the process of change, increasing
interconnectedness and interdependence among countries and economies.
• Globalisation brings countries closer through better communication, transport and
trade links.
• This process is changing the world dramatically and quickly.
• Globalisation involves the flow goods, ideas and values across national boundaries.
FIGURE 78 Globalisation involves the increasing flow of goods, ideas and people across national boundaries
© Via Afrika Publishers » G e o g r a p h y 11 Study Guide eBook 93
TOPIC 3 Development geography
The five major types of flows are:
• Money through investments, trade, loans and international control of the world
economy
• Ideas such as capitalism, democracy, and human rights
• Technology through machinery and business management
• Information through television, radio, movies, newspapers, magazines and books
• People through tourism, immigration, refugees and migrant workers.
Globalisation can positive and negative effects
TABLE 18 Comparison of the positive and negative consequences of globalisation
Positive effects Negative effects
• improvements in local productivity promote • the loss of employment in manufacturing in
prosperity developed countries such as Britain
• the movement and sharing of information, • a drift towards a more homogenised culture and
knowledge and expertise society internationally
• the improvement of international standards • local economies may be more vulnerable to fast
for variables such as education and health changes in the international economy
• increases the variety of goods available to • increased centralisation of power in the hands of
the world market large transnational corporations
• provides a bigger range of markets for • the location of industry in less developed
internationally sourced products countries, for many reasons, often leads to
environmental degradation
4 Is export-led development mutually beneficial?
• The adoption of export-led growth since the mid-1980s has had mixed results.
• Most countries that have had rapid growth have made exports an important part of
their economic policies.
• Some countries with export-led policies had low growth rates. Often these are
countries that export bulk raw materials with little or no processing.
© Via Afrika Publishers » G e o g r a p h y 11 Study Guide eBook 94
TOPIC 3 Development geography
Unit 4 Development issues and
challenges
1 What is the role of women in development?
• Understanding gender issues and applying gender analysis are essential tools for
development.
• Women make up about half the world’s population and in most countries there is
discrimination against women in the work place.
• Poverty reduction programmes rely on women for their implementation and
success.
• Women also find themselves at the front line of major global issues like food
production, population growth and climate change.
1.1 What are the gender issues related to attitudes, power and
access to resources?
1.1.1 Women’s rights
• The principle that everyone is entitled to rights ‘without distinction of any kind,
such as race, colour, sex...’ is stated in Article 2 of the 1948 Universal Declaration of
Human Rights.
• But, in many countries women are left out of most political decision making.
• In Africa, average female representation in parliaments is less than eight per cent.
• Women make up more than 25 per cent of members in parliament in only two
African countries, the Seychelles and South Africa.
1.1.2 Women and climate change
• In developing countries, the resources of food, water and energy are largely
controlled by women.
• In the 2010 Cancun agreements acknowledged that ‘gender equality and the
effective participation of women .... are important for effective action on all aspects
of climate change’.
1.1.3 Women and education
• Lack of access to formal education and training is a major barrier to women’s
employment and advancement in society.
• In Africa, female literacy rates were 20% lower than for men.
© Via Afrika Publishers » G e o g r a p h y 11 Study Guide eBook 95
TOPIC 3 Development geography
• Education beyond ten or more years of school leads to:
• lower fertility
• improved infant survival
• greater levels of infant and child development and education.
1.1.4 HIV/Aids
• Many African countries are struggling with high and increasing rates of HIV
infection and the costs in human lives.
• In sub-Saharan Africa, the HIV/Aids infection rates are four to six times higher
among women than men.
• Women and girls are particularly at risk because of their lack of personal power over
their sexuality and reproductive function.
1.1.5 Women’s employment
• Women provide the backbone of the rural economy globally and particularly so in
much of sub-Saharan Africa.
• Food production is the major activity of rural women. Their responsibilities and
labour inputs often exceed those of men in most areas in Africa.
• Women often work extremely hard for unjust rewards and an inferior quality of life.
• Economic development needs the talents and contributions of women.
2 What is the effect of development on the
environment?
• The growing population of the world and expanding economic development lead to
environmental management problems.
• Nature has to make space for people’s homes, farmlands and pastures.
• Great pressure is exerted on conservation areas.
• With industrial development environmental degradation and pollution may become
obstacles for social and economic development.
• The result is that the supply of material goods increases but the quality of life
deteriorates.
2.1 Pollution
Industrial pollution has a major impact on the environment.
• Air pollution is caused mainly from burning fossil fuels like coal, diesel and petrol
in the industrial and transport sectors, and wood for domestic use. South Africa has
a major problem with air pollution. Air pollution from our coal burning power
stations contributes to acid rain.
© Via Afrika Publishers » G e o g r a p h y 11 Study Guide eBook 96
TOPIC 3 Development geography
• Water pollution results from the discharge of untreated agricultural, industrial and
domestic waste into rivers and dams. Polluted water is harmful to humans and
plants, aquatic life and animals.
• Land pollution is caused by dumping refuse and builder’s rubble, poor agricultural
practices and mining. Industrial refuse includes waste from manufacturing
everyday items such as glass, paper, motor vehicles and tins.
3 What is the role of the state and business in
development in South Africa?
Government, business and individuals are all vital for economic development.
3.1 What should the state do?
The state has a critical role in promoting development. This includes:
• Passing laws. The government is responsible for passing laws that encourage
economic growth. This must also take the needs of the poor and marginalised into
account through job creation.
• Enforcing laws. The state must make sure its laws enforced. The rule of law provides
stability that encourages investment.
• Adopting development strategies. A successful development strategy has to
consider future needs and be sustainable, be realistic, involve communities and
provide new resources.
In South Africa, state owned companies like Eskom are crucial in supporting
development. Business cannot operate without sufficient electrical power.
3.2 What should business do?
• Most development projects need funding from sources other than the state.
• Businesses have to raise funds from investors and loans from commercial banks.
• Business has to take advantage of the opportunities created by government to
develop the economy. For instance:
• To boost exports and create jobs the state encourages new businesses in
designated Industrial Development Zones (IDZs). These are linked to Spatial
Development Initiatives (SDIs).
• The Department of Trade and Industry is responsible for the IDZs. The
management of business within these zones remains with the private sector.
© Via Afrika Publishers » G e o g r a p h y 11 Study Guide eBook 97
TOPIC 3 Development geography
FIGURE 79 Location of Spatial Development Initiatives (SDIs) and Industrial Development Zones (IDZs) in South
Africa
© Via Afrika Publishers » G e o g r a p h y 11 Study Guide eBook 98
TOPIC 3 Development geography
Unit 5 Role of development aid
1 What is development aid?
• Development aid, also known as development cooperation, is aid given by
governments and other agencies to support the economic, environmental, social
and political development of developing countries.
• It is distinguished from humanitarian aid by focusing on alleviating poverty in the
long term, rather than a short term response as might be done after an earthquake
or flood.
• Development aid is based on the idea that Third World nations don’t grow because
they lack financial resources.
• Development aid attempts to promote long-term growth of the LEDCs by:
• building large projects
• giving monetary help
• funding a variety of research and planning efforts.
• Despite the scale of the international aid, they have not led to sustained growth.
• Rather, aid has significantly slowed LDC progress as countries depend on aid rather
than finding solutions for their problems.
FIGURE 80 In 2004 the USA was the biggest development aid donor.
© Via Afrika Publishers » G e o g r a p h y 11 Study Guide eBook 99
TOPIC 3 Development geography
2 What are the types of development aid?
There are three main types of aid. These are:
• Bilateral aid which includes grants, loans and technical assistance between a donor
and a recipient country.
• Multilateral aid. This is the assistance given by large organisations such as the
United Nations, World Bank and the International Monetary Fund.
• Conditional aid has performance conditions attached to it.
• Non-government organisations or voluntary (NGOs). These are humanitarian
charities like Oxfam, Red Cross and Gift of the Givers. They donate money services
and goods. Most of their funds are come from public donations and are used to
support small-scale, local, self-help projects.
3 What is the impact of aid on development?
Aid given to LEDCs can be effective or non-effective for the receiving countries. Well
planned aid programmes can help a country develop and become less dependent on
aid. Aid is effective when:
• it contributes to the training of personnel and builds technical expertise
• it provides humanitarian relief after a disaster
• it encourages industrial development, creates jobs and improves infrastructure
• it supports better economic and social policies
• it provides resources for investment and finances projects
• it supports countries to develop their natural resources and power supplies
• it provides projects that develop clean water and sanitation leading to improved
health and standards of living.
Poorly-planned aid often makes a country more, rather than less, dependent on others.
Aid is ineffective when:
• it is not a gift or free, but a loan that has to be paid back, and poor countries may
struggle to repay
• much aid does not reach the people who need it most, that is, the poorest people in
the poorest countries
• corruption may mean local politicians use aid money for their own means or for
political gain. As a result the rich get richer and the poor get poorer.
© Via Afrika Publishers » G e o g r a p h y 11 Study Guide eBook 100
TOPIC 3 Development geography
• it may be a condition of investment that:
• the projects are run by foreign companies
• some of the resources or profits go back to the donor country
• sometimes aid is tied to the purchase of goods from the donor country.
Often foreign aid fails as a development policy because it destroys the incentives of the
marketplace and extends the power of rulers. Often it actually tends to increase Third
World poverty.
• In a few cases, like Korea and Botswana, aid has had a significant impact on poverty
reduction and improved social services.
• In a much larger number of countries, including Cuba, Zambia, Democratic
Republic of Congo, Haiti, Sierra Leone and Somali, western aid has not been
effective in lifting millions out of poverty.
© Via Afrika Publishers » G e o g r a p h y 11 Study Guide eBook 101
TOPIC 3 Development geography
Questions
Question 1
Multiple choice. Write the number of the question with the letter of the correct answer
next to it. Example, 1.1 A
1.1 International trade growth is most visible in . . . .
A developed countries
B European Union countries
C developing countries
D South Africa
1.2 In a(n) . . . . the vast majority of people engage in simple agriculture and
consume most of their output.
A emerging economy
B industrial economy
C subsistence economy
D industrialising economy
E raw material economy
1.3 . . . . has (have) been criticised by globalisation protestors all over the world,
especially when anti-American sentiment peaks.
A KFC
B Coca-cola
C McDonald’s
D Reebok
E All of the above
1.4 Which type of business is least likely to find it necessary to enter international
markets in order to survive?
A clothing manufacturers
B chain retailers
C motor car producers
D small, local businesses
E food distributors
1.5 In a(n) . . . . economy, manufacturing accounts for 10−20% of the country's
© Via Afrika Publishers » G e o g r a p h y 11 Study Guide eBook 102
TOPIC 3 Development geography
economy. This type of economy typically has a new rich class and a small but
growing middle class, both demanding new types of imported goods.
A subsistence
B industrial
C agricultural
D industrialising
E raw materials exporting
1.6 All of the following are obstacles to LEDC development except . . . .
A resource scarcity
B low levels of investment
C low population
D poor infrastructure
1.7 LEDCs often have a comparative advantage in the production of . . . .
A primary products
B intermediate products
C manufactured products
D tertiary services
E quinary activities
1.8 Southern hemisphere ocean routes between the southern continents carry little
traffic. Which one of the following explains this?
A the large distances between the continents
B the high winds and storms in the southern temperate latitudes
C the southern continents produce similar raw materials
D the southern continents import similar goods
E the southern continents trade their primary products for manufactured
goods from the northern hemisphere
1.9 Which of the following is the least developed?
A Africa
B Europe
C North America
D South America
1.10 90% of the world’s trade is carried on in . . . .
A LEDCs
B industrial countries of the northern hemisphere
© Via Afrika Publishers » G e o g r a p h y 11 Study Guide eBook 103
TOPIC 3 Development geography
C agricultural producers of the southern hemisphere
D developing countries of the southern hemisphere
(10 × 2) (20)
Question 2
Matching columns. Write the number of the question with the letter of the correct
answer next to it. Example, 2.1 A
2.1 Development A The total income of a country per year divided by the number of
people in the country
2.2 Standard of living B Includes life expectancy, literacy, years in education and
income per person
2.3 Gross Domestic Product C Those things needed to satisfy people’s needs
per capita
2.4 Gross National Product D Process of change which improves the well-being of a society
2.5 Gini-coefficient E Distribution of workforce in industry
2.6 Human Development Index F Measure of the quality of services and goods available
2.7 Resources G Monetary economic policies
2.8 Economic sectors H Degree of well-being felt by people
2.9 Quality of life I Development which not only meets people’s needs today but
also those of future generations
2.10 Sustainable development J The value of all the goods and services produced by a country
in a year
K Global standard for calculating income disparity
(10 × 2) (20)
© Via Afrika Publishers » G e o g r a p h y 11 Study Guide eBook 104
TOPIC 3 Development geography
Question 3
Study Figure 81 below showing the North/South divide and some information of the two
regions.
FIGURE 81 The Brandt line ‘North/South divide’
3.1 About what proportion of the North live in rural areas? Select one of 12%, 25%,
50%, 88%. (1)
3.2 According to the map, state if each of the following countries are in the North or
the South.
3.2.1 Australia
3.2.2 South Africa
3.2.3 New Zealand
3.2.4 Japan
3.2.5 Mexico (5 × 2) (10)
3.3 Describe the employment structure of:
3.3.1 the North (6)
© Via Afrika Publishers » G e o g r a p h y 11 Study Guide eBook 105
TOPIC 3 Development geography
3.3.2 the South (6)
3.3.3 Give reasons for the differences in the employment structure of the North
and the South. (6)
3.4 Study the population pyramids of the North and the South. Indicate if each of
the following statements are true or false.
3.4.1 The North has a lower birth rate than the South. (2)
3.4.2 The South has a smaller percentage of elderly people than the North. (2)
3.4.3 The North has a broad-based pyramid. (2)
(35)
[75]
© Via Afrika Publishers » G e o g r a p h y 11 Study Guide eBook 106
TOPIC 3 Development geography
Answers to Questions
Question 1
1.1 A
1.2 C
1.3 E
1.4 D
1.5 E
1.6 C
1.7 A
1.8 E
1.9 A
1.10 B
(10 × 2) (20)
Question 2
2.1 D
2.2 F
2.3 A
2.4 J
2.5 K
2.6 B
2.7 C
2.8 E
2.9 H
2.10 I
(10 × 2) (20)
Question 3
3.1 12 % (1)
3.2.1 Australia – North
© Via Afrika Publishers » G e o g r a p h y 11 Study Guide eBook 107
TOPIC 3 Development geography
3.2.2 South Africa – South
3.2.3 New Zealand – North
3.2.4 Japan – North
3.2.5 Mexico – South (5 × 2) (10)
3.3.1 The North: About 70% in tertiary (2), 20% in secondary (2), 10% in
primary (2)
3.3.2 The South: About 30% in tertiary (2), 10% in secondary (2), 60% in
primary (2)
3.3.3 The North is more developed than the South and so has far more people
engaged in secondary and tertiary activities (3). The South, being less
developed has most of its population engaged in primary economic
activities. (3)
(3 × 6) (18)
3.4.1 True (2)
3.4.2 True (2)
3.4.3 False (2)
(3 × 2) (6)
(35)
[75]
© Via Afrika Publishers » G e o g r a p h y 11 Study Guide eBook 108
TOPIC 4 Resources and sustainability
Topic 4 Resources and sustainability
Unit 1 Using resources
To use resources in a sustainable way is a life skill we all to needs to have. The world
needs be handed down to the next generation in a better state than we found it. We
need to prevent climate change by changing our lifestyles and reducing our use of
resources. We need to limit soil erosion, reduce our dependency on coal-generated
electricity and use renewable sources of electricity such as the sunlight and wind.
1 Resources and the relationship between resources
and economic development
• Resources are the things needed and used by people. They are the natural and
economic assets enjoyed by a country.
• Some resources are renewable. This means they can be used over and over again.
Some examples of renewable resources are solar energy, wind and water.
• Some resources are non-renewable. Their continued use can lead to exhaustion of
the resource. Some examples of non-renewable resources are gold, oil and coal.
• Countries try to develop to raise the standard of living and the quality of life of their
citizens This can only be done with a high resource base. Economically developed
countries like America, Britain, France and Germany owe their success to their huge
resource bases.
2 How are resources exploited and depleted?
Resource depletion refers to over-exploitation and exhaustion of raw materials within a
region. Some exploitation of natural resources is essential for human existence. If
resources are used faster than they can be replaced, they will be depleted.
The causes of resource depletion:
• Over-consumption
• Increasing population
• Technological and industrial development
• Mining for oil and minerals
© Via Afrika Publishers » G e o g r a p h y 11 Study Guide eBook 109
TOPIC 4 Resources and sustainability
FIGURE 82 Mind map showing causes of resource depletion
3 What problems are caused by exploitation of natural
resources?
• Deforestation. This causes increases in soil erosion and atmospheric CO2 levels,
which could be a cause of global warming.
• The greenhouse effect. When fossil fuels are burned, by industry, in power stations
and by vehicles and aeroplanes, gases enter the atmosphere. Most scientists think
this is causing climate change.
© Via Afrika Publishers » G e o g r a p h y 11 Study Guide eBook 110
TOPIC 4 Resources and sustainability
4 What is sustainability?
Sustainability means the ability to continue to do something without causing damage.
Another definition is ‘meeting the needs of the present without compromising the
ability of future generations to meet their own needs’. There are three parts to
sustainability: social, environmental, and economic. These factors must be in balance
to achieve sustainable resource use.
FIGURE 83 Sustainable resource use has three main parts that have to be maintained in balance.
TABLE 19 The difference between sustainable and non-sustainable resource use
Sustainable resource use Non-sustainable resource use
People and the Ecotourism, protecting scenery Large-scale tourism, especially at mountain and
environment and wildlife coastal resorts
People and Re-use, recycle and reduce, soil Continued use of fossils fuels such as coal and
resources conservation, reforestation, oil, unnecessary use of minerals, deforestation,
organic farming, renewable soil erosion, heavy fertilizer and agri-chemical
energy use, clean drinking water use, polluted drinking water
Socio-economic Controlled urban growth Rapid urbanisation and loss of farmland
© Via Afrika Publishers » G e o g r a p h y 11 Study Guide eBook 111
TOPIC 4 Resources and sustainability
Unit 2 Soils and soil erosion
1 Soil
Soil is a slowly renewed resource that provides most of the nutrients needed for plant
growth and also helps purify water. Soil is a thin covering over most land that is a
mixture of rock, minerals, decaying organic matter, water, air and billions of living
organisms most of them microscopic decomposers.
FIGURE 84 The constituents of soil. ‘OM’ stands for ‘organic matter’.
1.1 How soils are formed
The parent rock is weathered forming a loose layer of broken material known as the
regolith. True soil results from the addition of water, air, decaying and living organic
matter. Horizons start to develop and finally a mature soil is formed with A, B and C
horizons.
FIGURE 85 The formation of soils
© Via Afrika Publishers » G e o g r a p h y 11 Study Guide eBook 112
TOPIC 4 Resources and sustainability
1.2 Soil forming factors
• Time. Fully mature soils can take thousands of years to produce sufficient depth for
farming.
• Parent material. When a soil develops from an underlying rock its supply of
minerals is dependent on that parent rock.
• Climate. Moisture, temperature and wind are important climatic factors that
influence soil formation. Climate affects the rate of weathering of the parent
material with the most rapid breakdown in hot climates with a high rainfall.
Precipitation influences the type of vegetation which provides the organic material
and humus for the formation of soil. Temperature affects the length of the growing
season and the supply of humus.
• Organisms. The greater the amount of vegetation on the soil the greater the amount
of organic matter in that soil. The most fertile soils are those rich in humus
produced by soil organisms. When plants die the bacteria return the nutrients back
into the soil. Earthworms play a major role in converting organic matter into rich
humus, improving soil fertility.
• Relief. The direction the slope faces (its aspect) affects the amount of sun received.
North-facing slopes in South Africa are warmer than south-facing ones and are
therefore drier with more evaporation. The slope gradient also affects runoff – less
water will infiltrate soil on steep slopes.
1.3 Soil profiles
• A fully developed soil shows a series of layers each called a horizon.
• The O horizon is not true soil and consists of dead and decaying plant matter which
turns into humus or compost.
• The A horizon is topsoil and is the most fertile layer.
• The B horizon or subsoil is less fertile because it is further from the source of organic
matter.
• The C horizon is the weathered rock material which provides the soil with its
minerals.
• Below the weathered rock or regolith is the unweathered bedrock.
© Via Afrika Publishers » G e o g r a p h y 11 Study Guide eBook 113
TOPIC 4 Resources and sustainability
FIGURE 86 Soil profile showing the O, A and C horizons
1.4 The physical properties of soil
• Colour gives an indication of the conditions under which the soil was formed.
• The texture of the soil is graded according to its particle size (in descending order
from sand through silt to clay).
• The pH index or acid content. The acidity or alkalinity of the soil indicates the
degree of leaching. Different plants require a different pH for best growth but a
value between 5 and 7 is suitable for most plants.
• Structure. The way in which the soil grains are bound together into a larger unit is
called soil structure. It can be granular − looking like biscuit crumbs, columnar −
with vertical columns, blocky − in blocks − irregular blocks 1 to 4 cm in diameter or
platy − with flat horizontal plates.
© Via Afrika Publishers » G e o g r a p h y 11 Study Guide eBook 114
TOPIC 4 Resources and sustainability
2 Soils as a resource
While it is constantly being renewed it takes so long for soil to be formed that it can be
regarded as a non-renewable resource.
3 The causes of soil erosion
• Wind erosion. On fields that have recently been ploughed strong winds can cause
severe erosion. One single dust storm can blow away as much as six tons of soil per
hectare.
• Water erosion. In thunderstorms each raindrop acts as a tiny bomb which dislodges
a small amount of soil. This is then carried away by run-off causing gullies or
dongas.
FIGURE 87 The effect of raindrop splash on bare soil
FIGURE 88 How raindrop splash is reduced on soil with a vegetation cover
© Via Afrika Publishers » G e o g r a p h y 11 Study Guide eBook 115
TOPIC 4 Resources and sustainability
3.1 Poor farming practices causing erosion
• Overgrazing. Many of South Africa’s farms are too small to make a living on so more
cattle, sheep and goats are being kept on land that cannot provide enough food for
them. The vegetation cover is reduced and erosion occurs.
• Ploughing against the contour. Ploughing up and down the slope increases run-off
and the water removes the soil.
3.2 Erosion past and present.
While erosion has been going on for millions of years it is only recently that accelerated
erosion has occurred as humans have attempted to produce more food from the same
area. The average soil loss South Africa is 13 tons per hectare per year, which is one of
the highest in the world.
4 The effects of soil erosion on people and the
environment
• On-site effects. The main on-site effect is the reduction in soil quality which results
from the loss of the fertile upper layers of the soil.
• Off-site effects. The eroded soil may be transported considerable distances. This
gives rise to off-site problems, mainly the movement of soil and agricultural
pollution into rivers. This can lead to the silting-up of dams, disruption of the
ecosystems of lakes, and contamination of drinking water.
5 Management strategies to prevent and control soil
erosion
Once erosion has taken place nothing can be done to replace the lost soil. Management
strategies must prevent and control further erosion occurring. This can be done by:
• Government limits in the amount livestock that can kept on an area
• Educating the public
• Fencing paddocks and using rotational grazing
• Controlling veld fires
• Contour ploughing
• Adding humus to bind the soil
• Maintaining a good vegetation cover
• Planting shelter belts of trees limits the loss of soil by wind erosion.
© Via Afrika Publishers » G e o g r a p h y 11 Study Guide eBook 116
TOPIC 4 Resources and sustainability
Unit 3 Conventional energy sources and
their impact on the environment
Electricity is taken for granted by most of us but there is a lot that goes into making the
light come on at the flick of a switch. Coal has to be mined and transported to the power
station, a very expensive structure, and then the electricity has to be carried all over the
country. Coal dominates energy supply in South Africa with 77% of our country's
energy needs provided by coal. This is unlikely to change in the near future, due to the
lack of suitable alternatives to coal as an energy source. South Africa produces an
average of 224 million tonnes of coal annually, making it the fifth largest coal
producing country in the world. South Africa the third largest coal exporting country
and 25% of our production is exported. The important part played by coal can be seen
by the fact that Eskom is the 7th largest electricity generator in the world. South Africa
supplies two-thirds of Africa's electricity.
1 The principles and processes of generating electricity
from coal
• Producing electricity in a thermal power station from coal starts when the coal is
pulverised in huge mills into a fine powder before it is blown into boilers.
• In the boiler, the coal burns to generate heat to turn water into steam.
• The steam from the boilers is used to turn the blades of a giant fan or propeller,
called a turbine.
• The turbine turns a coil made of copper wire inside a magnet – the generator, which
produces an electric current.
• Then it is sent to the homes and factories of consumers via power lines.
© Via Afrika Publishers » G e o g r a p h y 11 Study Guide eBook 117
TOPIC 4 Resources and sustainability
FIGURE 89 Electricity generation by burning coal
2 The advantages and disadvantages of using coal to
generate electricity
TABLE 20 The advantages and disadvantages of electricity generation from coal
Advantages Disadvantages
• SA has abundant coal reserves. • Coal has the most waste problems of all energy
• Coal-fired power stations are reliable. sources. Waste includes sulphur and nitrogen oxides,
• South Africa's infrastructure to generate organic compounds, heavy metals, radioactive
electricity from coal is well established. elements, greenhouse gases and fly ash.
• Burning coal is the most cost-effective and • Building a coal-fired power station is a long and
energy efficient way of generating expensive process.
electricity. • South Africa's coal fields are mainly found in
Mpumalanga, which limits the location options for
power stations.
© Via Afrika Publishers » G e o g r a p h y 11 Study Guide eBook 118
TOPIC 4 Resources and sustainability
3 The impact on the environment of coal mining and
thermal power stations
3.1 Coal mining
• Much of our coal comes from open cast mines. Coal is stripped from the Earth in
surface mines. Surface coal mining may dramatically alter the landscape even
though mining companies are supposed to restore the mined area.
• Underground mining is dangerous, killing and injuring many people in accidents,
and causing chronic health problems.
• Acid mine drainage. Mining breaks up the rock mass, allowing free access of water
and sulphuric acid-producing reactions between iron sulphide and oxygen-bearing
water.
• Acidic water dissolves aluminium iron and manganese, which are toxic to animal
and most plant life. Acid mine drainage acidifies soil and rivers.
3.2 Coal burned by power plants
• Burning coal is a leading cause of smog, acid rain, global warming, and air toxics.
• A typical coal plant generates:
• 3,700,000 tons of CO2 every year, the primary human cause of global warming
• 10,000 tons of sulphur dioxide (SO2), which causes acid rain that damages
forests, lakes, and buildings
• 500 tons of small airborne particles, which can cause a variety of illnesses
• 25 million tons of fly ash which is the large matter left over when the pulverised
coal is burnt. Fly ash is a very toxic material.
• Acid rain: Most of South Africa's power stations are concentrated within a 100
km radius in Mpumalanga and this leads to pollution problems.
4 Nuclear energy
Nuclear energy is released from the nucleus of an atom. Nuclear reactions release very
high amounts of energy. Part of the mass of an atom gets converted into energy and this
energy is used to produce steam from water to drive the turbines and generate
electricity.
© Via Afrika Publishers » G e o g r a p h y 11 Study Guide eBook 119
TOPIC 4 Resources and sustainability
TABLE 21 Advantages and disadvantages of electricity generation from nuclear energy
Advantages Disadvantages
• Nuclear reactions release many times more • Nuclear energy can be used for production of
energy, compared to hydro or wind energy. nuclear weapons. They are a major threat to the
Hence, a large amount of electricity can be world as they can cause a large-scale devastation.
generated. • Though large amounts of energy can be produced
• Presently, 12-18% of the world's electricity is from a nuclear power plant, it is very expensive.
generated through nuclear energy. • The waste produced after fission reactions contains
• A big advantage of nuclear energy is that unstable elements and is highly radioactive. It is
there is no release of greenhouse gases very dangerous to the environment and human
(carbon dioxide, methane, ozone, health.
chlorofluorocarbon) so there is very little
effect on the environment.
5 South Africa’s potential to meet its long term energy
needs
• At present Eskom is building two of the biggest coal-fired power stations in the
world at Medupi in Limpopo and Kisule in Mpumalanga to help meet demand.
• Recently the government announced a 20-year plan.
• The country is planning to for 14% nuclear power
• South Africa’s electrical energy will, by 2030, comprise 48% coal, 14% nuclear, 16%
renewable energy, 14% gas turbine, 6% pump storage, and 2% hydro electric power.
• Eskom is also researching plans to increase renewable energy but coal is the
cheapest way to go.
• There is little scope for much more hydro-electric power, or HEP in South as we are
such a dry country.
• The possibility exists to import large quantities of electricity from HEP plants on the
Congo and Zambezi rivers.
• The objective of the plan is to develop a sustainable electricity investment strategy
for generation capacity for South Africa over the next 25 years.
© Via Afrika Publishers » G e o g r a p h y 11 Study Guide eBook 120
TOPIC 4 Resources and sustainability
Unit 4 Non-conventional energy sources
1 Solar radiation
Along with wind and wave power, hydroelectricity and biomass, account for most of the
available non-conventional energy on Earth. Only a tiny fraction of the available solar
energy is used. The energy that the Sun produces in one hour is enough to power the
entire planet for a year.
The process of solar power generating electricity is called ‘photovoltaics’. Silicon, an
element found in sand, creates an electric charge when it is exposed to lots of sunlight.
The silicon from just one ton of sand, used in photovoltaic cells, could produce as much
solar power as burning 500 000 tons of coal.
FIGURE 90 How the Sun’s energy is converted to electricity by photovoltaic cells
© Via Afrika Publishers » G e o g r a p h y 11 Study Guide eBook 121
TOPIC 4 Resources and sustainability
• The electric charge from the Ssun is converted into direct current, or DC. Batteries
store electricity to provide energy at night or on overcast days. Inverters convert the
DC power produced by the photovoltaic cells into alternating current or AC.
• Electricity can also be generated by the concentrating solar power, or CSP. CSP
systems use lenses or mirrors to focus a large area of sunlight into a small beam. The
concentrated heat is then used as a heat source for producing steam for a
conventional power plant.
1.1 Solar power in South Africa
At present there is very little solar power produced in South Africa but there is
enormous potential in the largely cloudless north-western parts of the country. Solar
photovoltaic electricity is used widely in rural areas. It is estimated that about 70 000
households, 250 clinics and 2 100 schools have photovoltaic panels.
2 Wind energy
For centuries, the energy created by wind has been caught and used for milling,
pumping water and sailing ships. Only in the past 50 years or so have we started to use
wind energy to generate electricity on a small and large scale.
2.1 The advantages of wind power
• Wind power is plentiful.
• It is renewable.
• It is widely distributed.
• It is clean.
• It produces no greenhouse gas emissions during operation.
• It uses little land.
• The overall cost per unit of energy produced is similar to the cost for new coal and
natural gas installations.
2.2 Wind power in South Africa
In 2011 only 2% of South Africa’s electricity was produced from wind but Eskom is
hoping to increase that with the construction of more wind farms. Private entrepreneurs
have built a small wind farm at Darling, 70 kilometres north of Cape Town. Eskom also
has a small one at Klipheuwel near Cape Town.
© Via Afrika Publishers » G e o g r a p h y 11 Study Guide eBook 122
TOPIC 4 Resources and sustainability
2.3 New renewable energy plants in South Africa
In November 2011 South Africa signed a R1,9 billion to develop renewable energy – the
Sere wind power and Upington solar power projects. These will each produce 100 MW
with the ability to increase this later. These are the largest renewable energy projects in
Africa.
3 The future of non-conventional energy in South Africa
• The situation in South Africa with coal the source for virtually all our electricity is
unlikely to change by much in the immediate future. Eskom currently is building
two huge new coal-powered stations at Mudupi in Limpopo and Kusile in
Mpumalanga.
• Biofuel, often made into diesel for tractors, is a less important energy source and
there is great debate surrounding whether burning certain crops such as maize
increases the price of these commodities, to the detriment of the poor.
• Solar and wind power are well-established technologies now, with continuously
improving efficiencies, decreasing costs and rapidly growing market shares all over
the world.
3.1 Innovations for the future
• High altitude wind power. The energy carried by wind streams at elevated levels in
the Earth’s troposphere has been estimated at over 850 terrawatts (TW). This
represents an incredible potential resource, considering that humanity’s total
annual energy budget amounts to ‘only’ about 17 TW.
• Artificial photosynthesis. A team of researchers has manufactured an ‘artificial leaf’
which copies the photosynthesis process in green plants by turning the energy of
sunlight into chemical fuel that can be stored and used to generate energy later.
• Underwater kites. Computer-controlled kite-like devices, are tied to the seafloor and
can be ‘flown’ in figure-of-eight patterns in tidal currents well below the water
surface.
• Solar buildings. A US company has recently started to mass-market roof shingles
that consist of photovoltaic solar panels, while a Norwegian outfit has patented
inexpensive thin film solar technology designed to be sprayed on surfaces like
windows and walls.
© Via Afrika Publishers » G e o g r a p h y 11 Study Guide eBook 123
TOPIC 4 Resources and sustainability
4 Possible effects of using more non-conventional
energy on the South African economy and the environment
4.1 The economy
If the South African economy is to grow the supply of electricity will have to grow with
it. Coal will remain our main source but energy from renewable sources will be
expected to make up a substantial 42% of all new electricity generation in South Africa
over the next 20 years.
4.2 The environment
To combat global warming and the other problems associated with fossil fuels, South
Africa must switch to renewable energy sources like wind and sunlight.
• Wind power produces no air or water pollution, greenhouse gases involves no toxic
or hazardous substances (other than those commonly found in large machines), and
poses no threat to public safety. Problems facing the wind industry are opposition
about the visibility and noise of wind turbines, and their impacts on wilderness
areas. Spinning turbine blades maim and kill birds and bats.
• Solar power. As solar power systems generate no air pollution during operation, the
primary environmental, health, and safety issues involve how they are
manufactured, installed, and ultimately disposed of.
© Via Afrika Publishers » G e o g r a p h y 11 Study Guide eBook 124
TOPIC 4 Resources and sustainability
Unit 5 Energy management in South
Africa
1 South Africa’s changing energy needs
For the South African government, the challenge is to balance the need to tackle
poverty and underdevelopment while bearing in mind the need for a sustainable energy
future.
The need for
The need for
greener,
more electricity
cleaner
to promote
electricty
develoment
South
Africa's
changing
energy
needs
FIGURE 91 South Africa has a dual electricity supply problem – the need for more electricity, and for cleaner
electricity.
2 Energy management, towards greener economies and
sustainable life style; responsibilities of governments,
businesses and individuals
South Africa will face further economic losses and hardship for the poor if the electricity
supply is not maintained and increased. To counter this we need green technologies,
and changes of lifestyle and consumption patterns. The South African Government has
been working with Eskom to increase capacity by boosting energy conservation
programs and investing in clean energy.
© Via Afrika Publishers » G e o g r a p h y 11 Study Guide eBook 125
TOPIC 4 Resources and sustainability
2.1 Greener economies
The United Nations has defined a green economy as one that results in improved
human well-being and social equity, while reducing environmental risks. A green
economy can be thought of as one which is low carbon, and has efficient use of
resources.
2.2 Sustainability
Sustainable living is a lifestyle that attempts to reduce the use of the Earth's natural
resources. People living sustainably try to reduce their carbon footprint by altering their
methods of transportation, energy consumption and diet.
2.3 The responsibility of governments, businesses and
individuals
• Governments can introduce legislation to reduce carbon emissions as well as taking
the lead in educating businesses and individuals to lead greener, more sustainable
living.
• Governments can also set the example by ensuring that government buildings
recycle their litter and avoid electricity and water wastage.
• COP 17 − In 2011 South Africa the government hosted, in Durban, COP 17 − the 17th
Conference of the Parties. The objective of the Convention is ‘to stabilise greenhouse
gas concentrations at a level that will prevent dangerous human interference with
the climate system’.
• Businesses can help by reducing carbon emissions, recycling, improving waste
management and reducing water and electricity consumption in their buildings or
factories.
• The role of individuals is to ‘Think globally, act locally’. This urges people to
consider the health of the entire planet and to take action in their own communities,
cities, countries and the world.
© Via Afrika Publishers » G e o g r a p h y 11 Study Guide eBook 126
TOPIC 4 Resources and sustainability
2.4 The carbon footprint
A carbon footprint is a measure of the impact our activities have on the environment,
and in particular climate change. The carbon footprint is a measurement of all
greenhouse gases we produce individually. It is up to each of us to reduce our carbon
footprints.
• The primary footprint is a measure of our direct emissions of CO2 from the burning
of fossil fuels including domestic energy consumption and transportation.
• The secondary footprint is a measure of the indirect CO2 emissions from the whole
lifecycle of products we use − those associated with their manufacture and eventual
breakdown. To put it very simply – the more we buy the more emissions will be
caused on our behalf.
FIGURE 92 The carbon footprint of the average person in the developed world
© Via Afrika Publishers » G e o g r a p h y 11 Study Guide eBook 127
TOPIC 4 Resources and sustainability
Questions
Question 1
Sustainability
Fill in the missing words. The missing words, and others, are given below the passage.
Write the number of the missing word and the correct word next to it. For
example, 1.14 Asian.
Sustainability means being able to carry on doing something without causing
permanent 1.1____________ . Another definition is ‘ 1.2 __________ the needs of the
present without compromising the ability of future 1.3 ____________ to meet their own
1.4 ____________’. There are three parts to sustainability: social, environmental, and 1.5
___________ . These factors must be in balance to achieve 1.6 __________ resource use.
When something is 1.7 ________________, this means it cannot continue. One of the
most important reasons for unsustainable development is the huge amount of materials
used by 1.8 ____________ societies. People use more resources. The current rate of
resource use by 1.9 ____________ and developing nations is unsustainable. This means
that future generations and developing nations will not have access to the same share
of scarce 1.10 ____________ . Unsustainable resource use can cause serious damage to
the 1.11 _____________ . It contributes significantly to the enhanced 1.12 ________ effect
and climate change. The environmental impact of our resource use will get worse when
the world uses resources at the same high rates as industrialised 1.13 __________
countries.
Asian, meeting, environment, developed, social, greenhouse, developing,
unsustainable, government, sustainable, industrialised, damage, resources, needs,
generations, economic
(13 × 2) (26)
Question 2
Soils
Study the orthophoto map, Figure 26, and the topographic map, Figure 27, of Gansbaai
on pages 23 and 24 of the Learner’s Book. Grade 11 learners doing their fieldwork
studied the soils at points A and C, both marked on the orthophoto map and the
© Via Afrika Publishers » G e o g r a p h y 11 Study Guide eBook 128
TOPIC 4 Resources and sustainability
topographic map. They saw that at one of the points the A and O horizons were
well-developed but at the other site the A and O horizons were very poorly-
developed. Explain their findings with the aid of a labelled diagram. (8)
© Via Afrika Publishers » G e o g r a p h y 11 Study Guide eBook 129
TOPIC 4 Resources and sustainability
Answers to Questions
Question 1
1.1 damage
1.2 meeting
1.3 generations
1.4 needs
1.5 economic
1.6 sustainable
1.7 unsustainable
1.8 industrialised
1.9 developed
1.10 resources
1.11 environment
1.12 greenhouse
1.13 developing
(13 × 2) (26)
Question 2
(4) (4)
A is on a steep slope and any humus and soil that is formed tends to get washed down
the hill almost as soon as it is formed, causing a thin A and O horizon. (2) There
© Via Afrika Publishers » G e o g r a p h y 11 Study Guide eBook 130
TOPIC 4 Resources and sustainability
is little evidence of vegetation so the O horizon will also be very small. (2)
C is on a much gentler slop causing very little erosion so the O and A horizons are much
better developed. (2) The greater vegetation at A causes more organic matter to
develop causing a larger O horizon. (2)
Learners should also be given credit for saying that the top soil and humus forming on
the mountains could be deposited on the flatter areas lower down the slope.
(4 ×2) (8)
[34]
© Via Afrika Publishers » G e o g r a p h y 11 Study Guide eBook 131
Exam Papers
FET PAPER 1
TIME: 3 HOURS
ANSWER ANY THREE QUESTIONS OF 75 MARKS EACH.
SECTION A
QUESTION 1 − PHYSICAL GEOGRAPHY
1.1 Multiple choice. Choose the correct letter to each of the following. Write the question number and
the letter of the correct answer, for example: 1.1.1 A.
1.1.1 At high altitudes air pressure will be _______ the adjacent lowlands.
A the same as
B higher than
C lower than
1.1.2 In South Africa, daily net radiation tends to be largest at the:
A summer solstice
B winter solstice
C spring equinox
D autumn equinox (2)
1.1.3 Continental locations like Kimberly tend to experience ___________ than coastal
locations like Durban at the same latitude.
A warmer summers and warmer winters
B warmer winters and cooler summers
C cooler winters and warmer summers
D cooler summers and cooler winters (2)
1.1.4 In a northern hemisphere anticyclone, the wind flow is:
A anticlockwise inward
B anticlockwise outward
C clockwise outward
D clockwise inward (2)
1.1.5 The band of fast flowing air above the polar front is a:
A polar easterly
B pressure gradient
C trade wind
D jet stream
E inter polar convergence zone (2)
© Via Afrika Publishers » G e o g r a p h y 11 Study Guide eBook 132
Exam Papers
1.1.6 What type of a slope is the scarp slope of a cuesta?
A dip
B ridge
C steep
D concave
E gentle (2)
1.1.7 What factors determine the shape of relief associated with inclined strata?
A the degree of rock resistance and the flow of the water
B the angle of slope and running water
C tectonic forces and faults
D running water and rejuvenation (2)
E the degree of rock resistance and the angle of slope
1.1.8 What is a mesa?
A a type of cuesta
B a type of inclined strata
C a type of dome
D a type of tor
E none of these (2)
1.1.9 Tors are associated with:
A igneous rocks
B inclined strata
C sedimentary rocks
D horizontal rocks
E fold mountains (2)
1.1.10 Tors occur when:
A wind erodes the joints to form boulders
B well-jointed mounds of rounded igneous boulders form
C igneous rock weathered into well-jointed boulders
D rounded boulders are deposited in mounds due to fluvial action
E both B and C (2)
(10 × 2) (20)
1.2 Climate regions
1.2.1 These six climate regions are all found in Africa. Match each of the climate regions with
the following descriptions: Equatorial, Semi-desert, Desert, Mediterranean, Highveld,
Humid sub-tropical. Write the name of the climate region and correct letter next to it. For
example: Equatorial a.
a Low and unreliable rainfall with hot summers and cold winters.
b Constant high summer temperatures with all year heavy rainfall.
c Warm dry summers with mild wet winters.
d Hot summers with high rainfall, cool winters.
© Via Afrika Publishers » G e o g r a p h y 11 Study Guide eBook 133
Exam Papers
e Very little rain. Very high summer temperatures, warm winters.
f Mild summers and winters with a winter rainfall maximum.
g Hot summers with convectional thunderstorms, dry winters with frost at night.
(6 × 2) (12)
1.2.2 The Savanna region is not included in the list of climate regions in 1.2.1.
a What is meant by the term climate region? (2)
b Draw a simple sketch map of Africa to show:
the position of the Equator (2)
the location of the Savanna regions of Africa. (4)
c Describe the temperature and rainfall conditions of the Savanna region. (8)
(28)
1.3 Study the figure below showing a landform with horizontal strata and four numbered slopes.
4
3
2
1
Clare Hambly
1.3.1 Name the landform shown in the figure. (2)
1.3.2 Using evidence from the figure explain what is meant by the term ‘horizontal strata’. (4)
1.3.3 Name the slopes numbered 1 to 4. (8)
1.3.4 Name and describe the mass movements that occur on the slope numbered 3. (4)
1.3.5 Draw a simple diagram to show how the landform in the figure will look in a few million
years time. (2)
© Via Afrika Publishers » G e o g r a p h y 11 Study Guide eBook 134
Exam Papers
1.3.6 Which one of the slopes in the figure increases in size with the passage of time? (1)
1.3.7 Explain why this slope increases in size. (4)
1.3.8 What use could be made of this slope? (2)
(27)
[75]
QUESTION 2 – PHYSICAL GEOGRAPHY
2.1 Matching columns. Match the number of the description with the correct letter, for example: 2.1.1
A.
2.1.1 Dryland A Hot wind in Canada
2.1.2 Desertification B Also called back wasting
2.1.3 Drought C Left when cap rock has been eroded off a butte
2.1.4 Fossil water D Caused by run-off from heavy rainfall
2.1.5 Temperature inversion E El Niño
2.1.6 Tectonic forces F The cap rock of a butte
2.1.7 Chinook G Formed from tilted strata
2.1.8 Sheet erosion H Layer of cold air near the ground with warmer air above
2.1.9 Scarp retreat I Not replaced under present climatic conditions
2.1.10 Conical hill J Produced by movement of the Earth’s crustal plates
K Ecosystem characterised by a relative lack of water
L An extended period of deficient rainfall
M Destruction of formerly productive land
(2 × 10) (20)
© Via Afrika Publishers » G e o g r a p h y 11 Study Guide eBook 135
Exam Papers
2.2 Study the figure below and then answer the questions which follow.
Horizontal and vertical air movements in an air pressure cell. Diagram X shows a pressure system from
above. Diagram Y shows the same pressure system from the side.
2.2.1 What type of atmospheric pressure system is over place A? Give TWO reasons for your
answer. (3 ×2) (6)
2.2.2 The numbers 1008 and 1004 refer to the atmospheric pressure. In what units is pressure
shown on a map? (2)
2.2.3 What are the pressure lines in X called? (1)
2.2.4 Estimate the atmospheric pressure at A. (2)
2.2.5 Will the atmospheric pressure be higher or lower at C and D? Give a reason for your
answer. (2 × 2) (4)
2.2.6 Using compass directions, name the wind at C (1)
2.2.7 In which hemisphere is this pressure system situated? Give evidence from the figure to
support your answer. (2 × 2) (4)
2.2.8 Describe the nature of air flow at A and D. (2 × 2) (4)
2.2.9 How will the air temperature at A be affected? Give a reason for your answer.
(2 × 2) (4)
(28)
2.3 Igneous activity. Indicate if each of the following statements is true or false.
2.3.1 When igneous rocks form they are laid down in horizontal strata. (1)
2.3.2 Igneous rocks, such as granite, may be weathered, while still below Earth’s surface to
eventually form tors. (1)
© Via Afrika Publishers » G e o g r a p h y 11 Study Guide eBook 136
Exam Papers
2.3.3 Sills form when magma solidifies in vertical cracks in the crust. (1)
2.3.4 Mesas and buttes have a hard resistant layer as a cap. (1)
2.3.5 The most common type of igneous rock is limestone. (1)
2.3.6 Batholiths are mushroom shaped features formed on the surface. (1)
2.3.7 Igneous rocks which cool slowly below the surface have small crystals. (1)
2.3.8 Magma which reaches the surface is called lava. (1)
2.3.9 Dykes form when horizontal rock formed as magma spread between layers. (1)
(9)
2.4 Mass movement: Study the figure below and answer the questions that follow.
Mass movement has caused a building to fall down a slope.
2.4.1 What does the term ‘mass movement’ refer to? (2)
2.4.2 What part does water play in the process of mass wasting? (2)
2.4.3 State how the construction of the building could have caused the slope to slide. (2)
2.4.3 Human activities are often main causes of mass movement. Write paragraph of about 12
lines suggesting possible solutions to prevent mass movement. (6 × 2) (12)
(18)
[75]
© Via Afrika Publishers » G e o g r a p h y 11 Study Guide eBook 137
Exam Papers
SECTION B
QUESTION 3 − DEVELOPMENT AND RESOURCES
3.1 The passages below is about renewable and non-renewable resources and development. Certain
words have left out but the missing words, and others, are listed below the passage. Write down
the number of the blank with the correct word next to it, for example 1.1 hydrogen.
Renewable Resources
There are many sources of 3.1.1 __________ that are renewable, meaning they are naturally replenished. In
some cases, such as 3.1.2 _______ which is burned for fuel, it can be grown again and again.
However, other renewable energy sources do not have to be grown or created; they simply need
to be harnessed. Water is one 3.1.3 __________ energy source. Artificial 3.1.4 ___________ have
been constructed to collect and store water from mountain runoff, to be used for human
consumption at a later date. Some of the water is used for drinking and other household needs,
and some is used for the 3.1.5 _________ of crops. The water is also to power turbines that
generate electricity; this is called 3.1.6 ___________.
Non-renewable Resources
Most of the energy we use today to heat our homes and fuel our cars comes from the lithosphere in the
form of 3.1. 7 _______________ . These fuels are 3.1.8 __________, meaning that once they are
gone they can never be replaced. The majority of the world's populations rely on fossil fuels to
generate 3.1.9__________, to heat homes, and to power motor cars. Eighty-five percent of the
world's energy comes from fossil fuels, namely 3.1.10 ________, oil, and natural gas.
Development
The term development refers to a number of characteristics that describe the stage a country has reached
on 3.1.11 _____________, cultural, social and technological levels. Development is about realising
the natural and human resource 3.1.12 __________ of a country, a region or a locality. It is one
way to reduce 3.1.3 ____________ and improve the quality of people’s lives. Development
includes two aspects of improvement in the life of people:
Standard of 3.1.14 ____________ is the material well-being of a person, the value of their
possessions and savings, the type of home they live in and whether they own items such
as a washing machine, television, car, telephone and computer.
3.1.15 ____________ of life is the general well-being of a person. It is also affected by education,
health care, services, utilities, environment, and social, political and religious freedom.
Possible answers: hydrogen, poverty, quality, energy, renewable, wood, electricity, wind power, coal,
hydroelectric power, demographic, fossil fuels, potential, living, non-renewable, irrigation,
economic, reservoirs, engines (15 × 1) (15)
© Via Afrika Publishers » G e o g r a p h y 11 Study Guide eBook 138
Exam Papers
3.2 Study the projections for Africa in the figure below and answer the questions that follow.
What will Africa look like in 2060? (Source: The Africa Report, No 36 December 2011 – January 2012)
3.2.1 Explain the concept GDP. (2 + 2) (4)
3.2.2 Often the concept of GDP per capita is used in development studies. What does the term
‘GDP per capita’ mean? (2)
3.2.3 Why is GDP per capita a better measure of development than the GDP? (2)
3.2.4 What is the difference between Africa’s GDP in 2010 and the projected GDP in 2060? (2)
3.2.5 Explain the expected big increase in the middle-class population in Africa. (4)
3.2.6 Describe the relationship between life expectancy and literary rates as depicted in the
figure. (4)
3.2.7 What is meant by the term ‘broadband internet’? (2)
3.2.8 Why is broadband internet included in figures relating to development? (4)
(24)
3.3 Provide short answers to the following:
3.3.1 Which company generates most of South Africa’s electricity? (2)
3.3.2 What fuel source is used to generate this electricity? (2)
3.3.3 List four advantages of generating electricity from coal in South Africa. (4 + 2) (8)
3.3.4 Through which harbour is most of South Africa’s coal exported? (2)
3.3.5 What is acid mine drainage? (2)
3.3.6 List three disadvantages of generating electricity from nuclear power. (3 + 2) (6)
© Via Afrika Publishers » G e o g r a p h y 11 Study Guide eBook 139
Exam Papers
3.3.7 Describe how photovoltaics convert the Sun’s energy into electricity. (2)
3.3.8 List the two main factors facing South Africa’s changing energy needs. (2 + 2) (4)
3.3.9 What is meant by a green economy? (2 + 2) (4)
3.3.10 COP 17, or the 17th Conference of the parties was held in Durban in 2011.
What was its objective? (2 + 2) (4)
(36)
[75]
QUESTION 4 − DEVELOPMENT AND RESOURCES
4.1 Multiple choice questions. Options are given for each of the following questions/statements.
Select the letter of the correct answer and write it next to the number of the question, for
example: 1.1.1 A.
4.1.1 Which of the following best summarises the meaning of development?
A Development refers to the economic improvements in a country.
B Development refers to the social improvements in a country.
C Development refers to the economic and social improvements in a country.
D Development refers to the improvement in the birth rate in a country.
E None of these.
4.1.2 Wind power:
A is an unlimited source of energy at favourable sites.
B requires long construction time.
C has a low net useful energy yield.
D emits moderate air pollution.
E produces CO2 emissions.
4.1.3 Which human activity has added the most carbon to the atmosphere?
A mining of fossil fuels
B increasing soil erosion
C burning fossil fuels
D cutting down the rain forests
4.1.4 The greenhouse effect is the phenomenon by which:
A biological diversity is dominant in agricultural production.
B the globe’s water pollution affects plankton.
C the Earth's atmosphere traps infrared radiation.
D climatic changes occur naturally in the forest.
© Via Afrika Publishers » G e o g r a p h y 11 Study Guide eBook 140
Exam Papers
4.1.5 Which of the following energy sources does not produce carbon dioxide?
A oil
B uranium
C coal
D natural gas
4.1.6 In Rostow’s model of development most countries go through . . . . stages.
A Three
B Four
C Seven
D None of these
4.1.7 Which of the following follow the concept of sustainable development?
1 Fishing the mature fish instead of the young fish.
2 Using wind power instead of burning coal to generate electricity.
3 The prohibition of trading endangered species.
A 1 and 2 only
B 1 and 3 only
C 2 and 3 only
D 1, 2 and 3
4.1.8 Excess of greenhouse gases cause:
A an increase in atmospheric temperature.
B a decrease in atmospheric temperature.
C no change in temperature.
D water vapour formation.
4.1.9 Scientists believe that greenhouse effect is the result of:
A using natural fertilisers to increase crop production.
B using large amounts of gasoline, oil and coal in developed nations.
C melting ice caps and glaciers.
D overgrazing on land in developing nations.
4.1.10 Human Development Index, HDI, is a better member of human development than GDP
because HDI measures:
A both economic and social aspects.
B only economic aspects.
C only social aspects.
D none of these.
(10 × 2) (20)
© Via Afrika Publishers » G e o g r a p h y 11 Study Guide eBook 141
Exam Papers
4.2 Soils and soil erosion: Study the figure below and answer the questions that follow.
Causes of accelerated soil erosion
4.2.1 Describe the difference between natural soil erosion and accelerated soil erosion.(4 × 2) (8)
4.2.2 Which of the factors in the figure leads to the most soil erosion? (2)
4.2.3 Explain how this factor causes accelerated soil erosion. (4)
4.2.4 What is meant by the term deforestation? (2)
4.2.5 Describe the stages that lead to the formation of soil. (8)
4.2.6 A soil scientist drew soil profiles at A and B on the topographic map extract shown on
the next page. The profiles are numbered X and Y. Match the soil profiles X and Y with
the positions they were drawn, A and B on the map, and explain your answer. (2 × 4) (8)
(32)
© Via Afrika Publishers » G e o g r a p h y 11 Study Guide eBook 142
Exam Papers
Extract from 2531CC Barberton
Profile X Profile Y
O O
A
A
B
B
C C
Soil Profiles X and Y
© Via Afrika Publishers » G e o g r a p h y 11 Study Guide eBook 143
Exam Papers
4.3 Study the figure below showing aspects of development and resource utilisation and answer the
questions that follow.
Development and resource utilisation
4.3.1 What is meant by the term ‘primary activity’. (2)
4.3.2 List three primary activities evident in the figure. (3 × 1) (3)
4.3.3 Name the mineral being mined that causes the most greenhouse gases. (2)
4.3.4 What is meant by the term ‘renewable energy’? (2)
4.3.5 Using examples from the figure state what is meant by the term ‘tertiary activity’. (4)
4.3.6 List three sources of renewable energy shown in the image. (3 × 2) (6)
4.3.7 Explain why it is important for South Africa to increase renewable electricity generation
if the country is to develop successfully. (2 × 2) (4)
(23)
[75]
© Via Afrika Publishers » G e o g r a p h y 11 Study Guide eBook 144
Exam Papers
Answers and mark allocation
QUESTION 1.1
1.1.1 C
1.1.2 A
1.1.3 C
1.1.4 C
1.1.5 D
1.1.6 C
1.1.7 E
1.1.8 E
1.1.9 A
1.1.10 A
(10 × 2) (20)
QUESTION 1.2
1.2.1
Equatorial b
Desert e
Mediterranean c
Highveld g
Humid sub-tropical d
Semi-desert a
(6 × 2) (12)
1.2.2
a A geographical area which has similar weather conditions. (2)
b
(2 + 4) (6)
c High temperatures (2) with high daily and seasonal range (2)
High rainfall in summer (2) with dry winters (2) (4 × 2) (8)
© Via Afrika Publishers » G e o g r a p h y 11 Study Guide eBook 145
Exam Papers
QUESTION 1.3
1.3.1 Mesa (2)
1.3.2 On slope 3 you can horizontal layers of rock (2). These sedimentary layers were laid
down millions of years ago when there was a large inland sea. (2)
1.3.3 1 = pediment, 2 = talus, scree, 3 = cliff, free face, 4 = cliff (4 × 2) (8)
1.3.4 3 – rockfalls (2). Rocks break loose from the slope due to weathering. (2)
1.3.5 Drawing of a butte (2)
1.3.6 Slope 1 – the pediment (1)
1.3.7 Back wasting or parallel scarp retreat (2) causes the other slopes to reduce in size making
the pediment larger. (2) (4)
1.3.8 Grazing for sheep or goats or ostriches. (2)
(27)
[75]
QUESTION 2.1
2.1.1 K
2.1.2 M
2.1.3 L
2.1.4 I
2.1.5 H
2.1.6 J
2.1.7 A
2.1.8 D
2.1.9 B
2.1.10 C
(10 × 2) (20)
QUESTION 2.2
2.2.1 Low pressure because (a) the isobar interval decreases towards the centre of the pressure
system (2) and (b) air movement is inwards towards the centre. (2)
2.2.2 HectoPascals or hPa. (2)
2.2.3 Isobars (1)
2.2.4 Between 1000 hPa and 996 hPa. Probably about 998 hPa. (2)
2.2.5 Higher (2), because air always flows from a high to a low pressure. (2)
2.2.6 South-east or south-south-east (1)
2.2.7 Southern hemisphere (2), because the air circulation towards a low pressure system is
clockwise (2).
© Via Afrika Publishers » G e o g r a p h y 11 Study Guide eBook 146
Exam Papers
2.2.8 A: air converges (2) D: air diverges (2)
2.2.9 The air temperature may drop (2). As the air pressure decreases and the air rises, the air
will cool adiabatically. (2)
(28)
QUESTION 2.3
2.3.1 F
2.3.2 T
2.3.3 F
2.3.4 T
2.3.5 F
2.3.6 F
2.3.7 F
2.3.8 T
2.3.9 F (9)
QUESTION 2.4
2.4.1 Mass movement is the movement of weathered materials down a slope. (2)
2.4.2 Water acts as a lubricant and increases the chances of mass movements. (2)
2.4.3 Any ONE of:
Slope became unstable as a result of the building works (2)
The weight of the building caused the slope to slide (2)
Removal of vegetation during building (2)
Road works during building (2)
2.4.4 People can minimise mass movement in the following ways – any 6 points:
Elimination and restriction of activities
Plant natural vegetation on slopes
Engineering techniques to prevent landslides
Ssafety nets to stop rockfalls
Cut and fill of slopes
Ddrainage and run-off channelling structures to remove access water
Retaining walls
Reduce deforestation
Fasten unstable rocks with rock bolts. (6 × 2) (12)
[75]
QUESTION 3.1
3.1.1 energy
3.1.2 wood
3.1.3 renewable
3.1.4 reservoirs
3.1.5 irrigation
3.1.6 hydro-electric power
3.1.7 fossil fuels
3.1.8 non-renewable
© Via Afrika Publishers » G e o g r a p h y 11 Study Guide eBook 147
Exam Papers
3.1.9 electricity
3.1.10 coal
3.1.11 economic
3.1.12 potential
3.1.13 poverty
3.1.14 living
3.1.15 quality
(15 × 1) (15)
QUESTION 3.2
3.2.1 GDP or Gross domestic product (2) refers to the market value of all final goods and
services produced within a country in a given period. (2)
3.2.2 GDP per capita means the total GDP divided by the number of people in the country. (2)
3.2.3 A very large country may have a large GDP but the average wealth of the citizens may be
small. A small, but rich, country would have a smaller GDP but its citizens would be
much wealthier. (2)
3.2.4 Africa’s GDP has grown approximately eight times. (2)
3.2.5 A middle class population would have greater life expectancy, literacy levels and
broadband connection. (2) These all will have increased between 2010 and 2060. (2)
3.2.6 Life expectancy has increased from about 58 to 71 years (2). Literacy has also increased
66% to 96.8% (2).
3.2.7 High speed internet connection (2)
3.2.8 Internet connection is now regarded as a human right and is becoming essential for
many forms of communication and doing business (2). Having a fast, reliable and cheap
internet connection is a mark of a developed country (2).
(24)
QUESTION 3.3
3.3.1 Eskom (2)
3.3.2 Coal (2)
3.3.3 SA has abundant coal reserves. (2) Coal-fired power stations are reliable. (2) South
Africa's infrastructure to generate electricity from coal is well established. (2) Burning
coal is the cheapest and most efficient way of generating electricity. (2)
3.3.4 Richard’s Bay (2)
3.3.5 Acid mine drainage is the flow, or seepage, of polluted water from old mining areas. (2)
3.3.6 Nuclear energy can be used for production of nuclear weapons. They are a major threat
to the world as they can cause a large-scale devastation. (2) Though large amount of
energy can be produced from a nuclear power plant, it is very expensive. (2) The waste
produced after fission reactions contains unstable elements and is highly radioactive. It
is very dangerous to the environment and human health. (2)
3.3.7 Silicon, an element found in sand, creates an electric charge when it is exposed to
sunlight. (2)
3.3.8 The need for greener, cleaner electricity. (2) The need for more electricity to promote
development. (2)
3.3.9 A green economy results in improved human well-being and social equity, (2)while
significantly reducing environmental risks and ecological scarcities. (2)
© Via Afrika Publishers » G e o g r a p h y 11 Study Guide eBook 148
Exam Papers
3.3.10 To stabilise greenhouse gas concentrations at a level (2) that will prevent dangerous
human interference with the climate system (2)
(36)
[75]
QUESTION 4.1
4.1.1 C
4.1.2 A
4.1.3 C
4.1.4 C
4.1.5 B
4.1.6 D
4.1.7 D
4.1.8 A
4.1.9 B
4.1.10 A
(10 × 2) (20)
QUESTION 4.2
4.2.1 Natural soil erosion has taken place for millions of years (2) and is where soil is formed
at the same rate it is removed (2). Accelerated soil erosion takes place when human
activities (2) have caused the soil to be removed faster than it is formed. (2)
4.2.2 Overgrazing. (2)
4.2.3 Overgrazing by animals removes the vegetation cover (2). The roots of trees, bushes and
grass bind the soil reducing soil loss (2). OR Vegetation also breaks the force of raindrops
which dislodge soil (2).
4.2.4 Deforestation is the deliberate clearing of forested land by burning or cutting. (2)
4.2.5 1 The first stage in the formation of soil is the weathering of the parent rock (2) to give a
loose layer of broken material known as the regolith (2). 2 The second stage in the
formation of true soil results from the addition of water, air, decaying and living organic
matter (2). Horizons start to develop and finally a mature soil is formed (2).
4.2.6 Profile X was drawn at position A. (2) Any organic matter and A horizon soil is likely to
be washed down the steep slope as soon as it forms making for small O and A horizons.
(2) OR it could be very rocky at A. Profile Y was drawn at position B. (2) The level slope
means that the O and A horizons are not eroded away and are well-developed and much
larger than at X. (2)
(32)
4.3.1 An activity where resources are extracted directly from the ground without further
processing. (2)
4.3.2 Mining, farming, fishing, accept forestry (3)
4.3.3 Coal (2)
4.3.4 Renewable energy comes from natural resources which are constantly being replaced.
(2)
4.3.5 This sector provides services to the population and to businesses (2)such as tourism and
transport of which there are examples in the image. (2)
4.3.6 Solar power, wind power, hydro-electric power (6)
© Via Afrika Publishers » G e o g r a p h y 11 Study Guide eBook 149
Exam Papers
4.3.7 Using coal to generate generates pollution and greenhouse gases. (2) Wind, solar and
hydro power are renewable, non-polluting and once the infrastructure has been paid it is
very cheap. (2)
(23)
[75]
© Via Afrika Publishers » G e o g r a p h y 11 Study Guide eBook 150
Exam Papers
FET PAPER 2
TIME: 1½ HOURS
ANSWER ALL THE QUESTIONS.
Greyton, 130 kilometres east of Cape Town, is a place that has grown from being a small remote village to a
bustling tourist paradise with many hotels, B&Bs and other forms of accommodation. Study the extract
from the 1:50 000 topographic map of Greyton 3419BA (Learner’s Book page 42) and answer the following
questions.
QUESTION 1: MULTIPLE-CHOICE QUESTIONS
The questions below are based on the 1:50 000 topographical map 3419BA. Various options are provided
as possible answers to the following questions. Choose the answer and write only the letter (A–D)
in the block next to each question.
1.1 Which line of latitude forms the southern edge of the map?
A 19° 30' 00" S
B 34° 04' 00" S
C 34° 04' 00" E
D 19° 34' 00" S (2)
1.2 What spatial object is found at 34° 03' 55" S, 19° 33' 45" E?
A sewerage works
B quarry
C railway line
D recreational area (2)
1.3 State the coordinates of spot height 704 in block B3
A 34° 01' 25" S, 19° 32' 30" E
B 19° 32' 30" S, 34° 01' 25" E
C 34° 00' 25" S, 19° 31' 30" E
D 19° 31' 30" E, 34° 00' 25" S (2)
1.4 In what province is Greyton?
A Western Cape
B Northern Cape
C Eastern Cape
D Gauteng (2)
1.5 The index of the map sheet directly east of this Greyton map is . . . .
A 3419BA east
B 3420BB
C 3419BB
© Via Afrika Publishers » G e o g r a p h y 11 Study Guide eBook 151
Exam Papers
D 3419AB (2)
(5 × 2) (10)
QUESTION 2: TRUE OR FALSE
State if each of the following statements is true or false. If the statement is false provide the correct
answer.
2.1 There is a river confluence in A7.
2.2 There are no human constructed objects in block B7.
2.3 Growing fruit is an important activity in block D2.
2.4 In block D7 the Gobas river drops over 40 metres.
2.5 In block D7 the general direction of flow of the Gobas river is towards the north-north-east.
2.6 There is evidence of secondary economic activity in block D3.
2.7 The oldest roads in the area covered by the map were developed about 100 years ago.
2.8 There are perennial streams in B6.
2.9 The Greyton area receives most of its rain in winter.
(19)
QUESTION 3: GEOGRAPHICAL TECHNIQUES AND CALCULATIONS
3.1 Hikers walk from spot height 438 (D3) to the excavation in D4.
3.1.1 In what direction are the hikers walking? (2)
3.1.2 What is the true bearing of the walk? (2)
3.1.3 Why would the hikers not get the excavation if they walked on a compass bearing of
your answer to 3.1.2? (2)
3.1.4 State the straight line distance between these points. Express your answer in metres. (2)
3.1.5 State the height above sea level of the excavation. (2)
3.1.6 Calculate the gradient of the hike. (4)
3.1.7 Calculate the area of block A7 outlined in red. Express your answer in hectares.
(1 hectare is 10 000 m2) (4)
(18)
3.2 Landform recognition
Four sketch sections labelled A,B,C and D are shown in the figure.
© Via Afrika Publishers » G e o g r a p h y 11 Study Guide eBook 152
Exam Papers
3.2.1 Which of the above sketch sections best represents the slope marked A−B on the
topographic map? (2)
3.2.2 Which of the above sketch sections best represents the slope marked E−F on the topographic
map?(2)
(22)
QUESTION 4: DEVELOPMENT AND RESOURCES
4.1 The Greyton municipality wishes to build a solar-powered electricity station in the area. A non-
geographer suggests that the point marked B (B6) would be a good place to site it. Provide two
reasons why you think this is not a good site. (4)
4.2 You wish to build a hotel for tourists coming to the area.
4.2.1 List two attractions that might attract encourage tourists to visit. (4)
4.2.2 You are offered two sites for the hotel. Site 1 is at Gifkloof in D8 and the Site 2 is between
the reservoir and the excavation in C7. State which site you think is the better and give
two reasons for your choice. (4)
4.2.3 Provide one reason why the site you did not choose would be unsuitable. (2)
(14)
QUESTION 5: GEOGRAPHIC INFORMATION SYSTEMS
5.1 Heavy rainfall sometimes results in flooding along the Gobas river. Provide three ways in which
the local government could use GIS to manage this disaster? (3 × 2) (6)
5.2 Urbanisation has a negative impact on rivers. Provide two methods of how buffering will prevent
the mismanagement of the GobasRiver? (2 × 2) (4)
(10)
[75]
© Via Afrika Publishers » G e o g r a p h y 11 Study Guide eBook 153
Exam Papers
Answers and mark allocation
QUESTION 1
1.1 D
1.2 B
1.3 B
1.4 A
1.5 C
(5 × 2) (10)
QUESTION 2
2.1 True (1)
2.2 True (1)
2.3 False (1) – There are no orchards marked or there is cultivated land marked there. (2)
2.4 False (1), it only crosses one contour. (2)
2.5 False (1), it is towards the south-south-west. (2)
2.6 True (1)
2.7 False (1) – The Breinbrecht bridge was built nearly 200 years ago in 1820. (2)
2.8 False (1), the streams are non-perennial. (2)
2.9 True (1)
(19)
QUESTION 3
3.1.1 ENE (2)
3.1.2 70° (2)
3.1.3 Because a magnetic bearing of 70° is different from a true bearing of 70°. (2)
3.1.4 2 200–2 300 m (2)
3.1.5 240 m (2)
3.1.6 1:11 or 1:12 (4)
3.1.7 270−280 ha (4)
3.2.1 Sketch 3(2)
3.2.2 Sketch 1(2)
(24)
QUESTION 4
4.1 It is on a south-facing slope and thus would not receive the direct rays of the Sun. (2) B is on a
very steep slope – building would be expensive and very difficult. (2)
4.2.1 Two of: hiking trails, mountain scenery, nature reserves, historical sites, fishing, boating
or canoeing. (4 × 2) (4)
4.2.2 Two of: close to Greyton, gently sloping ground, north-facing slope, good views of the
mountains and nature reserve, easy access to a hiking trail. (2 × 2) (4)
4.2.3 Site 2 is in a wetland. Possibility of flooding. (2)
(14)
© Via Afrika Publishers » G e o g r a p h y 11 Study Guide eBook 154
Exam Papers
QUESTION 5
5.1 Three of:
The government could have used GIS in predicting floods.
Planning should have been done on how to control floods.
Communicate the occurrence of floods to the inhabitants.
GIS could enable the government to distribute information to the disaster management centres.
Use GIS to create a buffer zone around the river.
Any three of the above – Accept other reasonable answer. (3 × 2) (6)
5.2 Two of:
Indicates where no agriculture and industries can be located.
Prevent pollution from pesticides and industrial wastes being deposited.
Leave areas clear for urban expansion.
Conserve natural areas / maintaining green belts. (2 × 2) (4)
(10)
[75]
© Via Afrika Publishers » G e o g r a p h y 11 Study Guide eBook 155
Study this subject
Notes, quizzes and topic questions for Grade 11 Geography.
- Grade 11 Geography notes
CAPS revision notes with worked examples.
- Geography questions by topic
Past exam questions sorted by CAPS topic, with memos where available.
- Grade 11 Geography quizzes
Short topic quizzes with instant feedback.
- All Grade 11 Geography past papers
Past papers by year, with memos where available.
- Grade 11 Study guides
More Geography and other subjects in this collection.
Recommended for this subject
More papers and memos for this grade and subject.
Memorandum
Geography Grade 11 Paper 1 Eastern Cape November 2025 Memo
Memorandum
Geography Grade 11 P2 Eastern Cape November 2025 Memo (English)
Question paper
Geography Grade 11 P1 Eastern Cape November 2025 Question Paper
Question paper
Geography Grade 11 P2 Eastern Cape November 2025 Question Paper
Question paper and memo
Geography Grade 11 Free State March Test 2025 Paper & Memo
Memorandum
Geography Grade 11 Paper 1 Eastern Cape November 2024 Memo
Related documents
Question paper
Geography Grade 11 P2 Eastern Cape November 2024 QP (Eng)
Question paper
Geography Grade 11 P2 North West November 2024 QP (Eng)
Memorandum
Geography Grade 11 P1 Eastern Cape November 2023 Memo (English)
Question paper
Geography Grade 11 P2 Eastern Cape November 2023 QP (Afr)
Question paper
Geography Grade 11 MAPS 2023 Question Paper
Question paper
Geography Grade 11 MAPS 2023 Question Paper
More from Grade 11 Geography
Question paper
Geography Grade 11 Paper 2 MAPS 2023 Question Paper
Question paper
Geography Grade 11 Paper 2 MAPS 2023 Question Paper
Question paper
Geography Grade 11 Paper 2 MAPS 2023 Question Paper
Memorandum
Geography Grade 11 P1 Eastern Cape November 2022 Memo (English)
Memorandum
Geography Grade 11 P2 Eastern Cape November 2022 Memo (Afrikaans)
Memorandum