
Via Afrika
Geography
Grade 12 Teacher’s Guide
I’m so grateful that I’ve had an opportunity to Grade 12 Study Guide
be involved in making someone’s life better.
A.W. Hambly, P.A.D. Beets, G.D. Samaai, K. Najjaar, S.D.
— Janet Thomson, Teacher Gear, U.J. Fairhurst, Z.P.L. Shabalala, J.A. Jacobs
Via Afrika understands, values and supports your role as a teacher. You have the most important job in education, and we
Via Afrika Geography
realise that your responsibilities involve far more than just teaching. We have done our utmost to save you time and make
your life easier, and we are very proud to be able to help you teach this subject successfully. Here are just some of the things
we have done to assist you in this brand-new course:
1. The series was written to be aligned with CAPS. See page 4 to see how CAPS requirements are met.
2. A possible work schedule has been included. See page 5 to see how much time this could save you.
3. Each topic starts with an overview of what is taught, and the resources you need. See page 61 to find out how this will
help with your planning.
4. There is advice on pace-setting to assist you in completing all the work for the year on time. Page 29 shows you how this
is done.
5. Advice on how to introduce concepts and scaffold learning is given for every topic. See page 29 for an example.
6. All the answers have been given to save you time doing the exercises yourself. See page 58 for an example.
7. Also included is a CD filled with resources to assist you in your teaching and assessment. See the inside front cover.
8. A question bank with tests you may photocopy will help you assess your learners effectively. See the Question Bank on
page 271.
The accompanying Learner’s Book is written in accessible language and contains all the content your learners need to master.
The exciting design and layout will keep their interest and make teaching a pleasure for you.
We would love to hear your feedback. Why not tell us how it’s going by emailing us at geography@viaafrika.com?
Alternatively, visit our teacher forum at www.viaafrika.com.
Language: English
ISBN 978-1-415422-72-4
www.viaafrika.com
Skip to contentStudy guide %20June%202025%20Question%20Paper--a52dca5e-efc4-4060-84c3-24f7269a2a79/v1-a9ef6866fc707402ff5a/card.webp)
%20June%202025%20Question%20Paper--ba0a3969-240a-4bba-bdb6-7d02a7f80205/v1-98bc441a090fdcbd55aa/card.webp)

%20June%202024%20Possible%20Answers_hlayiso.com_--7e728632-059d-401a-ba75-fd45632f6091/v1-269fb55ac60eebf555e6/card.webp)
%202024%20Possible%20Answers_hlayiso.com_--e19dd834-ffaf-4fe6-a8a4-9ee8f8597c29/v1-cd443ecc5afd789f654b/card.webp)
View all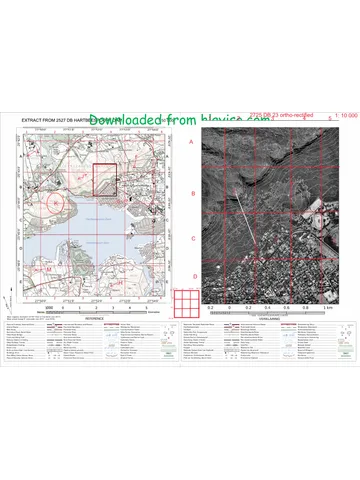

%20QP_hlayiso.com_--cc0a9c5e-7556-4aa2-a8c6-caf4da66af7f/v1-b59d47c1a7139a0ae375/card.webp)
Gr12 Geography Study Guide LR
Grade 12 Geography study guide, 184 pages. Read online or get the free PDF download.
Geography · Grade 12. Study guide, 184 pages. Read online or download the PDF.
- Subject
- Geography
- Grade
- Grade 12
- Document type
- Study guide
- Curriculum
- CAPS
- Pages
- 184
- File size
- 16.5 MB
Loading document…
Loading document…
1 of 184
Document textSearch extracted text and jump to a page.
S t ud y G ui de
Geography
Grade 12
ISBN: 978-1-41546-320-8
Introduction
Contents
General introduction...
Geographical skills and techniques
Unit 1 Mapwork techniques
Unit 2 Topographic maps (rnc ne 12
Unit 3 Aerial photographs and orthophoto maps..
Unit 4 Geographical information systems
QUESTIONS oo... eeeseeceeseeeceseeeceecesseeecseeesesseeeesseeecesaeeesseeeeeaeeeesaeeeseaeeeesseeeeseeeees
Topic 1 Climate and Weather... eeccssscsssececessecessessseeseseeecesseesssseescssseesseeesesseees
Unit 1 Mid-latitude cyclones ..
Unit 2 Tropical cyclones ..
Unit 3 Subtropical anticyclones and associated weather...
Unit 4 Valley climates ..
Questions ...
Topic 2 Geomorphology
Unit 1 Drainage systems in South Africa...
Unit 2 Fluvial processes woo... cesecssscesscsssecsscesscessscssssssscesssessssssssscesssssssssesseseees
Unit 3 Catchment and river management..
Questions
Topic 3 Rural and urban SettleMent.v..ececccesccsccscesscsseesscssscessesssecsscesessesseseees 95
Unit 1 Study of settlements.
Unit 2 Rural settlements
Unit 3 Rural settlement issues..
Unit 4 Urban settlement
Unit 5 Urban hierarchies... cc ccsccssccsccsccsscssscessscssscssscesssessscssssssssesenssseneseees
Unit 6 Urban structure and patterns...
Unit 7 Urban settlement issues
QUESTIONS oo... eeeesceesssseeessseeeeeeesseeeeesseeeesseeeeesaseessaeeesaeeseesseesessaesessaeeseeaeeeeaaeees
© Via Afrika Publishers >> Geography 12 Study Guide eBook
Introduction
Topicg Economic geography Of SOUL APICAL ee eeesteeeeseeceeseeceeeeesseeeeeeaeeeeaee 129
Unit 1 Structure of the CCONOMY.........cccesessseeseesscsseesseesssessseesesessssessensanesenees 129
Unit 2 Agriculture..
Unit 3 Mining
Unit 4 Secondary and tertiary S@Ctors ....... i seccesseeesseeeeeesesseesssseeesesseesseseeesees
Unit 5 Strategies for industrial development ..
Unit 6 The informal sector...
Questions
EXAM PapelS......cscceccesscesseessscssscscesscessscssscesscesssessscesscsssesssessseesssessseesssessoesseses
Be er poncocee nnoocnnccononoc coor ococncoosor poco nooo ooo oconcooncoc ooncccoonnooonnconnnooc ceca
© Via Afrika Publishers >> Geography 12 Study Guide eBook
Introduction
Introduction to our Geography 12 Study Guide eBook
Welcome to the Grade 12 Geography Study Guide. The subject of Geography has
changed considerably over time and it continues to change because it is one of the most
dynamic subjects in the curriculum. The Earth and its biosphere, the home of
humankind, is changing all the time and that is what makes our subject so special.
This guide must be used in conjunction with the main textbook, as it is a summary of
the main components of the textbook. Geography, like any other subject, does contain
facts which must be understood and learnt, but it also emphases skills. It is necessary
for the learner to analyse and use these facts to understand phenomena and to try to
solve problems. Our lives depend on the ways in which we treat our environment. Thus,
as citizens of the Earth, we must understand the changes that are constantly taking
place and our own impact on our surroundings.
Geography is all around us at all times. Get into the habit of looking at a city, town,
village, landscape and trying to work out the processes that act on it. Why is that shop
there, why are there so many people there, why is that hill shaped liked that, how is
that river being used? These are the sort of questions that you must get into the habit of
asking yourself and trying to answer. Do this regularly and you will be a much better
Geographer.
Once you have studied the detail in the main textbook, use this guide as a summary.
Concentrate on the key concepts and build your knowledge around them. Do this
regularly and you will develop into a genuine geographer ready to take your place as a
keeper of our vital environment.
© Via Afrika Publishers >> Geography 12 Study Guide eBook 1
Geographical skills and techniques
Geographical skills and techniques
Unit 1 Mapwork techniques
1 Applying map skills and techniques
1.1 What is scale?
A map represents a given area on the Earth’s surface. Maps are produced at various
scales. This relationship between the map and the ground is shown in different ways.
Word scale — The map distance and the ground distance it represents are written in
words such as 1 cm represents 500 m.
Representative fraction or ratio scale — The unit of the map distance is the numerator
and the equivalent ground distance is the denominator. A representative fraction of
1:50 000 means that one unit on the map such as a centimetre represents 50 000 of the
same units on the ground.
Line scale — The ratio between the map distance and the equivalent ground distance is
shown on a scale bar (Figure 1).
1000 0 1 2 3
metres HOEY FY EY {FF -_-———————— kilometres
Figure 1 The line scale on a 1:50 000 map
1.1.1 Large and small scale maps
Large scale maps show a lot of detail over a small area and small scale maps show little
detail over a large area. A 1:10 000 orthophoto map has a larger scale than a 1:50 000
topographic map. A map of the world at a scale of 1:10 000 000 is a very small scale
map.
© Via Afrika Publishers >> Geography 12 Study Guide eBook 2
Geographical skills and techniques
1.2 How do you calculate distance and area?
Calculating distance, area and converting to hectares
Calculating distance
Remember to distinguish between measuring straight line and
curved-line distances.
1:50 000
(topographic maps)
1¢m represents 50 000 cm
1¢m represents 500 m
acm represents 0,5 km
or1mm represents 50m
1:10 000
(orthophoto maps)
1cm represents 10 000 cm
1cm represents 100 m
1cm represents 0,1 km
or1mm represents 10m
Estimating area of a rectangle
When calculating a regular area apply
the formula: length x breadth.
Use ground distances when calculating
area.
First convert the map distances to
ground distances before doing the
calculation.
You must be able to convert both your km? or m? area to hectares (ha).
One hectare (1 ha) =100 mx 100m
= 10000 m?
1km?=10 ha x 10 ha =100 ha
To convert km? to hectares:
To convert m? to hectares:
multiply your answer by 100 divide your answer by 10 000
© Via Afrika Publishers >> Geography 12 Study Guide eBook 3
Geographical skills and techniques
1.3 What is the relationship between contours and cross-sections?
¢ Acontour is a line joining places of the same height above sea level.
¢ The vertical distance between two consecutive contours is always the same. It is the
contour interval.
Contour patterns Slope profile
Very widely spaced Very gentle slope (plain)
x
L-100-—~| ~—1
Widely spaced Gradual slope
a ; Ry, ae
L
Closely spaced oteep slope
EES SOS
es)
3 ya
v 27 F SF YP LS
vl
—
~<
Grouped in pairs Terraced slope
x
, Convex slope
x Concave slope
Noe
we
be be |
oe od
ate
call
Figure 2 Contour patterns and slopes
© Via Afrika Publishers >> Geography 12 Sludy Guide eBook 4
Geographical skills and techniques
Figure 3 A cross section — various slope profiles
2 How do we indicate direction?
Direction is locating a feature in relation to another one. When we refer to direction we
use the points of a compass rose to describe the general direction from one feature to
another.
Figure 4 A compass rose is used to indicate direction
Bearing is a much more accurate way of indicating direction. Bearing is an angle
measured clockwise from magnetic north (magnetic bearing) or true north (true
bearing) (Figure 5). The starting point to determine bearing is the north-south line.
North will then always be 0°. Bearing is always measured clockwise from north at 0°
through a full circle to 360°. Bearings are measured using a protractor and given in
degrees.
© Via Afrika Publishers >> Geography 12 Sludy Guide eBook 5
Geographical skills and techniques
2.1 What is true north?
True north is also known as geographical north. It is the actual point on the Earth’s
surface that coincides with the north pole.
2.2 What is magnetic north?
Magnetic north is the northern magnetic pole of the Earth. Presently it lies
approximately north west of Canada and about 1 000 km from the true north pole.
Magnetic north is the north that a compass will point to and it shifts slowly east or west
of true north.
true north
magnetic north
Figure 5 True north, magnetic north and true bearing
© Via Afrika Publishers >> Geography 12 Study Guide eBook 6
Geographical skills and techniques
2.3 What is magnetic declination and how is it calculated?
Skills file How to calculate magnetic declination
A
h >>" 4 Mean magnetic declination 23° 22' west of true north (uly 2002)
4 \ = 2 Mean annual change 12' westwards (2000-2005)
ch \ = (Supplied by Hermanus Magnetic Observatory)
a\ |s
ale
¥
1 Determine the difference in years. 1 2010 - 2002 =7 years
Current year minus first date in
brackets. 2 Annual change 12' west
2 Multiply these years with the mean 7 * 12’ =84'
annual change.
84'=1° 24'
3 Add or subtract this total annual
change from the magnetic 3 Annual change is west
declination. ADD to magnetic declination
If the average change is westwards — =r 23° 22' + 1° 24'= 24° 46’
ADD!
If the average change is eastwards —
SUBTRACT!
© Via Afrika Publishers >> Geography 12 Sludy Guide eBook 7
Geographical skills and techniques
3 What is grid referencing?
The absolute position of any place can be located by determining the latitude and
longitude of the place. This consists of latitude north or south of the equator.
e All latitudes in South Africa are south of the equator.
e All longitudes in South Africa are east of Greenwich, or the Prime Meridian.
How to determine location accurately
1 Draw a very light pencil line in the minute frame
(that surrounds the map on the outside) opposite the 34°15)
relevant feature. Do this for both the latitude (left or
right) and the longitude (top or bottom).
2 Start by counting the latitude minutes from the
top of the map to the minute section directly opposite ( a)
the geographic object in question marked with the pencil ee
line. This will be 16"
3 Subdivide the minute section as follows: %
a Divide it halfway — this will be the 30" “U1
value.
b Divide each half (30") into two Fe) b —F 35" o Cn )
(quarters). These will be the 15" and 45" values Reacts 20, pad
respectively. a 30"
C Divide the relevant quarter (where the b 45"
pencil line has been drawn) now into three
equal parts that will each represent 5".
4 The correct number of seconds can now be
easily and accurately determined as 18". The latitude rT
value will than be 34° 16'18" S.
5 To determine the longitude value, repeat these
steps by counting the minutes from left to right.
© Via Afrika Publishers >> Geography 12 Study Guide eBook 8
Geographical skills and techniques
4 Map and photo interpretation
Questions on map interpretation can be set from anywhere in the Grade 12 syllabus. You
should use the topographic maps, aerial photographs and orthophoto maps in Via
Afrika Geography Grade 12 to work through Table 1, finding as many examples as
possible.
Table 1 How to systematically read and analyse a map or aerial photograph
Climate and weather
Position
latitude (climate of place) and longitude; proximity of mountains and oceans;
distance from the sea (maritime or continental)
Rainfall
year round: perennial rivers; seasonal (summer or winter): farm dams,
irrigation, non-perennial rivers, agronomy; dry to arid: wind pumps, large
farms, stock farming; sufficient rain: forests 0750 mm)
Temperature
latitude position determines how cold/cool/hot a place is; height above sea-
level (cold or warm) and slope front (shadows or sunlight); temperature
inversions at night
Wind
rows of trees or windbreaks; landing strips and aerodrames; valley winds:
catabatic (night) and anabatic (day)
Relief and topography
Regions
mountains and plains, high and lowlands, highest and lowest points
Terrain forms
size, average height above sea-level, extent (direction)
Slope
steepness, convex, concave, straight, uniform, slope type (crest, cliff, talus
slope, knickpoint, pediment)
Type of landform
valley, spur, gorge (ravine), cliff, waterfall, terrace, saddle (neck), pass
Landscape
mountainous, undulating, hills, plains, floodplains
Landforms associated with structural landscapes
Horizontal strata
plateaux, table mountains (mesas), buttes, conical hills
Inclined strata
cuestas, hamoclinal ridges, hogsbacks, dip slopes and scarp slopes
Massive igneous rock
dome shaped landforms (batholiths, laccoliths, lopoliths), tors, dykes
Fluvial process
Drainage basins
watersheds, trunk (main) and tributary rivers
Stream pattern
dendritic, trellis, radial, rectangular, centripetal, deranged
Stream orders
lengths, number, gradient, basin area
Stage and shape length-profile (upper, middle lower course) cross-profile (V-shaped,
broad/wide)
Features waterfalls, rapids, braided streams, undercut river bank, slip-off river bank,
© Via Afrika Publishers >> Geography 12 Study Guide eBook 9
Geographical skills and techniques
meanders, flood plains
Stream direction
always to the sea; from high to low areas; contours bend upstream; dam wall
on the downstream side; tributaries join trunk with an acute angle
Stream piracy
watershed, capturing river, misfit stream, elbow of capture, wind gap
Features of the fluvial cycle stages
Upper course
high watershed:., V-shaped valleys, steep gradient, short, small and many
tributaries, waterfalls and rapids, fast flow, erosion vertical
Middle course
gentle slopes, watershed on lower levels, open valleys, longer and less
tributaries, gentle river bends, erosion and transport start to be sideways
Lower course
broad valleys, gentle gradients, flood plains, meanders and oxbow lakes,
deposition, slow flow, braided streams
Settlements
Site physical nature of the exact piece of land on which a settlement is located
Situation relationship of a settlement with its immediate and wider environment
(geographic placement with reference to relief, drainage, transport routes,
and utilisation of soil)
Function unifunctional (rural with primary activities); multifunctional (urban with
secondary, tertiary and quaternary functions)
Rural settlement
Patterns dispersed/isolated (buildings far from each other), farmsteads;
nucleated/clustered (buildings close to each other), farm villages
Factors determining
site
drinking water, plough land, grazing land, building material, fuel
Factors determining
shape
linear (road, river, mountains, sea); circular (central point — town square,
market, church); crossroad (junction/intersection of roads)
Urban settlements
Factors determining
site
water supply, nature of soil, relief (flat surface), roads, rivers, railway lines,
sea, defensibility, function
Type
central place, commerce, transport, specialised
Morphological
structure
shape (circular, linear, star shaped); street plan (grid, radial, irregular);
physical expansion (commercial ribbon development, multiple cores,
exclusive residential and work areas, residential differentiation)
Land use zones
central business district, retail area, residential, light and heavy industries,
rural-urban fringe
Economic activities
Primary activities
commercial — good infrastructure, irrigation, large farms, winery, saw mill,
sugar mill, abattoir, mines, fishing harbours, and so on; subsistence —few
roads, no power lines, footpaths, small areas of cultivated fields
© Via Afrika Publishers >> Geography 12 Study Guide eBook 10
Geographical skills and techniques
Secondary activities light industries — close to CBD, road transport, raw materials agriculture;
heavy industries — far fram CBD, rail transport, raw materials, mainly mining;
factors influencing site — level area, raw materials, transport, electricity,
water, market
Tertiary activities provision of services such as education (schools, colleges, universities),
tourism, holiday resorts, commerce, medical and health care, airports,
electricity supply
Also take note of the following
Tourist attractions, holiday resorts and monuments
Recreation facilities such as sport stadiums, golf courses, racetracks, shooting ranges
Airports and aerodromes are determined by flat surfaces, far from build-up areas (safety and noise)
Uses of large dams: drinking water; water purification plants; irrigation: canals and furrows,
cultivated fields and orchards; recreation: camping sites, sail and ski (slipways), and angling
Infrastructure: type and number of roads, railway lines, power lines, harbours as well as how
infrastructure relates to the topography and drainage
© Via Afrika Publishers >> Geography 12 Study Guide eBook 11
Geographical skills and techniques
Unit 2 Topographic maps
1 What are the conventional map signs and symbols?
Every 1:50 000 topographic map has a key or reference at the bottom of the map (Figure
6). The reference explains the symbols used on the map and helps you to understand
the map information.
National Freeway; National Route
Arterial Route
Main Road
Secondary Road; Bench Mark
Other Road; Bridge
Track and Hiking Trail
Railway; Station or Siding
Other Railway; Tunnel
Embankment; Cutting
Power Line
Built-up Area (High, Low Density)
Buildings; Ruin Y
Post Office; Police Station; Store
Place of Worship; School; Hotel
Fence; Wall
Windpump; Monument
Communication Tower
Mine Dump; Excavation
Trigonometrical Station; Marine Beacon
Lighthouse and Marine Light
Cemetery; Grave
plantation
waterfall
weir
railway
cable car
cemetery
river
vineyard
excavation
ruin
trig beacon
lighthouse
windpump
harbour
International Boundary and Beacon
Provincial Boundary
Protected Area
Perennial River
.. Perennial Water
Non-perennial River
Non-perennial Water
Dry Water Course
Dry Pan
Marsh and Vlei
Pipeline (above ground)
Water Tower; Reservoir; Water Point
Coastal Rocks
- Prominent Rock Outerop
Erosion; Sand
Woodland
Cultivated Land
Orchard or Vineyard
Recreation Ground
Row of Trees
Original Farms
bridge
‘communication
are
place of worship
Figure 6 1:50 000 topographic map symbols and images of what some of them represent
© Via Afrika Publishers >> Geography 12 Study Guide eBook
12
Geographical skills and techniques
2 What are contours and landforms?
Maps are two dimensional representations on a flat sheet of paper but height can be
shown by spot heights, bench marks, trigonometrical beacons and contours.
2.1 How are landforms recognised on a topographic map?
Contour patterns Landforms Contour patterns Landforms
Concentric circles Conical hill V-shaped contours overlap Waterfall (long profile)
x
ee ae 9
se Fe
She
me x YY ly
Closed lines arround wide centre Table mountain (mesa) V-shaped contours point uphill _ Valley (cross profile)
_) ep tote | Y
tte oat
oe CEE
ee x , .
Contour lines overlap Vertical slope (cliff) V-shaped contours point downhill Spur (cross profile)
Xe eS as Y
hia ae Ae y 1
Figure 7 Contours and their landforms
3 How do you construct cross-sections from 1:50 000
maps?
Cross-sections are constructed in four steps, illustrated in Figure 8 on the next page.
Prepare the profile framework.
Gather the data.
Transfer the data.
Complete the profile.
WN
© Via Afrika Publishers >> Geography 12 Study Guide eBook 13
Geographical skills and techniques
£Fort Ss
Step 1.
‘got : —120
penny ae ork Cross-section across Montagu
rotile framewor! 00+) 400
Base line represents 4. s g
exact map distance. 300 ia © maa
Mark vertical lines %o-+ 3 S| tr
with scale ranging £ <
between one division cae a wba TReeTTTT Retad
beyond the lowest eH 3 2 ORB 2k 2 33
and highest points. ao} Ai wt a3 8 3
— 280
8
=—- —— £2 260
Step 2. e
Gather the data 52) a ae
On the edge of astrip | & EE See SS =
of paper mark ofthe | 2 a Cj
position and height of 200 eanesital stale e008 200
each contour line. +418 Vertical exaggeration = 12,5 times 370,6 m
Figure 8 Four steps to construct a cross-section across 3320CC Montagu
4 What is vertical exaggeration?
>, Diggings"*S
Step 3.
Transfer the data
Hold the strip of paper
between the vertical
lines. At each height
transfer the points
where the contours
cross onto the profile.
Step 4.
Complete the profile
Join the points to
represent the natural
rise and fall of the
landscape and shade
the profile. Add title,
end heights, feature
labels, vertical and
horizontal scales and
vertical exaggeration.
Vertical exaggeration is the deliberate vertical expansion of the cross-section’s vertical
scale in order to see height variations more clearly (Figure 9). Vertical exaggeration is
calculated by dividing the vertical scale by the horizontal scale, where both scales are
expressed as representative fractions.
© Via Afrika Publishers >> Geography 12 Study Guide eBook
14
Geographical skills and techniques
iver
460m
420m g ey
= 600 :
s
E500 500
>
= 400 400
x Profile (a) ¥
Vertical exaggeration 2,5 times
hX / |
| rae H
Z !
P ‘ee tS< H \
F3 4 al ie
r jo. f “i
1 - “f ye ef 2
fa ~ £ x Profile (b) Y
Extract from 3226DD ALICE Vertical exaggeration 5 times
Figure 9 Cross section X-Y shown at different vertical exaggerations
4.1 Calculating vertical exaggeration
vertical scale 1 1 _ 50000
horizontal scale ~ 2000 ~ 50000 ~ 2000 ~-> mes
5 What is intervisibility?
Intervisibility is when you can see one point from another and it can be determined by
examining the contours.
¢ Two points of the same height are intervisible if there is no higher terrain between
them.
e Where contours show a convex slope, the summit of the hill is not visible from the
foot of the hill.
¢ Where contours show a concave slope the summit and foot of the hill are
intervisible.
© Via Afrika Publishers >> Geography 12 Sludy Guide eBook 15
Geographical skills and techniques
6 What is gradient?
Gradient is the relationship between height and distance. It is written as a ratio. The
gradient tells us how steep a straight line is. We calculate gradient to find out how steep
or gentle a slope is. An easy way to remember the ratio for gradient is RISE:RUN. Learn
this formula and write it down when doing gradient calculations. You might be given a
mark even if you get the calculation completely wrong.
Calculating gradient (Calculate the gradient between the top of a slope (490 m) and
the foot of the slope (430 m). Horizontal distance between
spot heights is 2,1 cm measured on 1:50 000 map.
Vertical distance (RISE) I: Horizontal distance (RUN)
Height at top of slope 490m 2,1cm IMap distance between top and bottom of|
slope
Height at bottom of slope 430m 2,1¢m x 50 000 |(always convert to same unit of
100 measurement)
RISE 60m I: 1050m IRUN
Reduce height to 1, divide both 60 I 1050
sides by the height value 60 60
Gradient of slope = 1 I 1755
Gradient expressed as a fraction 1
1755
© Via Afrika Publishers >> Geography 12 Study Guide eBook 16
Geographical skills and techniques
Unit 3 Aerial photographs and
orthophoto maps
Orthophotos are aerial photographs with the distortions caused by camera angle
removed so they are true to scale. An orthophoto map has added details such as contour
lines, place names, spot heights and trigonometrical stations added. They are drawn to
a scale of 1:10 000.
Unit 4 Geographical information systems
GIS is a computerised system consisting of hardware, software and methods designed
to capture, manage, manipulate, analyse, model and display spatial and non-spatial
data to solve planning and management problems.
Table 2 Key terms in GIS
Concept Term
Spatial data This is all data that are shown with symbols on a map. The spatial data
for a school could be its exact latitude and longitude.
Attribute or non-spatial data This is that information which describes the spatial characteristics of
the spatial features. The attribute data for a school could that it is a
high school for 345 boys and 360 girls.
Vector data This is data of geographic features shown in point (a node such as a
school), line (an are such as a river) and area (a polygon such as a dam)
format.
Raster data This is data of geographic features shown with grid cells.
Spatial resolution This determines how clear and easy the detail is to see.
Buffering This is the creation of a zone of equal width around a point, line or area
feature in GIS. An example of buffering is where it is not allowed to
plant any trees in a plantation closer than 50 metres from any river.
Remote sensing This is the gathering of information about the Earth from weather
balloons, aeroplanes and satellites.
Data or thematic layering This is when different types of information are placed one on top of the
other in layers to see the overall picture. Such layers on a topographic
map could be: vegetation, contour lines, roads, rivers or built up areas.
Work through the activities on GIS in the Learner’s Book on pages 51, 247 and 253 to
revise this topic. There will always be questions on GIS in Exam Paper 2 and they could
also appear in Exam Paper 1.
© Via Afrika Publishers >> Geography 12 Study Guide eBook 17
Geographical skills and techniques
Questions
Work through the map interpretation questions of the June and End-of-year exam
papers. These exams are similar to those one will get in Grade 12. Also answer the
multiple choice questions below, which are good revision work.
Question1
|
Show the letter corresponding to the best answer to the questions below.
11 Which of the following scales is the best representative of a small-scale map?
A 1cmto1ikm
B 1:1,000,000
Cc 1:50 000
D 1:10 000
E icm to20m
1.2 A large-scale map shows...
A a large amount of detail for a large amount of area
B a large amount of detail for a smal] amount of area
Cc asmall amount of detail for alarge amount of area
D a small amount of detail for a small amount of area
1.3. Which of the following representative fractions would show the most detail on a
map?
A 1:1 000 000
B 1:10 000
Cc 1:50 000
D 1:10 000 000
1.4 The ratio between the measurement of something on the map and the
corresponding measurement on the earth is known as...
A distance
direction
Cc projection
D scale
E GIS
© Via Afrika Publishers >> Geography 12 Sludy Guide eBook 18
1.5
1.6
ry /
1.8
Geographical skills and techniques
How are latitude and longitude lines drawn on a globe of Earth?
A latitude lines are parallel and longitude lines meet at the poles
B latitude lines are parallel and longitude lines meet at the equator
Cc longitude lines are parallel and latitude lines meet at the poles
D longitude lines are parallel and latitude lines meet at the equator
An airplane takes off from a location at 17° S latitude and flies to a new location
55° due north of its starting point. What latitude has the plane reached?
A 28°N
B 38°N
Cc W225
D 72°N
38°S
Which of the following are correct latitude and longitude coordinates?
A 110° N, 78° E
B 110° N, 78° N
Cc 5° N, 120° W
D 100° S, 123° N
Figure 1 shows various compass readings. N represents true north.
N
A
X
70°
° 110°
y 20
0
90 70°
w
Z
Figure 1
© Via Afrika Publishers >> Geography 12 Study Guide eBook 19
1.8.1
1.8.2
1.8.3
1.8.4
1.8.5
1.9
Geographical skills and techniques
In Figure 1 the true bearing of X from O is...
A 110°
B 290°
Cc 90°
D 700°
In Figure 1 the true bearing of Y from O is...
A 270°
B 160°
Cc 90°
D 7o°
In Figure 1 the true bearing of O from X is ...
A 110°
B 250°
Cc 90°
D 70°
In Figure 1 the true bearing of O from Zis ...
A 0°
B 180°
Cc 90°
D 270°
In Figure 1 the true bearing of O from Wis...
A 110°
B 250°
Cc 290°
D 270°
Figure 2 shows a cross section line which has been drawn through a series of
contour lines (interval 100 m). Three places, X, Y and Z are marked on the line.
O]o| ojo
joo Ke} fe)
Of in| Sen
200
°
S Y
= |
005
009
itt |
Figure 2
© Via Afrika Publishers >> Geography 12 Study Guide eBook
—_ | 00€
1.9.1
1.9.2
1.9.3
1.10
Geographical skills and techniques
In Figure 2 which of the following statements is true?
A Y is equally distant from X and Z
Y is just visible from Z
X is not visible from Y
Y is visible from X
“oO ow
Zis visible from Y
In Figure 2 the slope from X to Yis...
A stepped
B uniform
Cc concave
D convex
In Figure 2 the slope from Z to Y is ...
A stepped
B uniform
Cc concave
D convex
Figure 3 shows a contour map with four spot heights, W at 218 m, X at 140 m, Y
at 183 m and Z at 235m.
S
Figure 3
1.10.1 In Figure 3 which of the following lines of sight does NOT have intervisibility?
A WX
B YW
Cc ZX
D ZW
E XY
© Via Afrika Publishers >> Geography 12 Study Guide eBook 21
Geographical skills and techniques
1.10.2 The contour interval represents the ...
A
B
Cc
D
E
accuracy of the surveying work
horizontal spacing between the contour lines
number of contour lines on a map
vertical spacing between contour lines
none of these
1.10.3 Contour lines on a topographic map that are close together indicate that ...
A
B
Cc
D
the land slopes gradually
the land is very steep
the elevation is very high
the elevation is very low
1.10.4 Contour lines on a topographic map that are spread far apart indicate that ...
A
B
Cc
D
the land slopes gradually
the land is very steep
the elevation is high
the elevation is low
1.10.5 Contour lines ...
A
B
Cc
D
can never cross
can cross in very steep areas
can cross on very precise maps
can cross where there are cliffs
20x2=(40)
TOTAL MARKS [40]
© Via Afrika Publishers >> Geography 12 Study Guide eBook 22
Geographical skills and techniques
Answers to Questions
11 B (2)
1.2 B (2)
13. «=B (2)
1.4 D (2)
1.5 A (2)
16 B (2)
bly/ Cc (2)
18.1 B (2)
1.8.2 A (2)
1.8.3 A (2)
1.8.4 A (2)
1.8.5 C€ (2)
1.9.1 D (2)
1.9.2 C€ (2)
1.9.3 D (2)
1.10.1 C (2)
1.10.2 D (2)
1.10.3 B (2)
1.10.4 A (2)
1.10.5 A (2)
20x2=(40)
TOTAL MARKS [40]
© Via Afrika Publishers >> Geography 12 Study Guide eBook 23
TOPIC 1 Climate and weather
Topic 1 Climate and weather
Unit 1 Mid-latitude cyclones
1 General characteristics
Mid-latitude cyclones are also known as frontal depressions, depressions and extra-
tropical cyclones. They are low pressure systems (lows) associated with the meeting
of warm and cold air masses.
As the two air masses have different densities, they do not mix readily but will be
‘separated’ by a front.
In the Southern Hemisphere winds rotate clockwise into the centre of the low. In the
Northern Hemisphere winds rotate anti-clockwise into a low.
The diameter of mid-latitude cyclones ranges from 1 000 to 4 000 km.
They occur all year round, but in South Africa their influence is strongest in winter,
bringing the familiar cold fronts often accompanied by rain. In summer they move
further south of the country.
These travelling cyclones range in strength from a mild disturbance to a powerful
storm.
1.1 Definitions
Cyclone: A cyclone is an area of low pressure usually associated with wet and
windy weather.
Front: A front is a boundary separating two air masses with different temperature
and moisture characteristics.
Warm front: A warm front is found where warm air replaces cold air.
Cold front: A cold front is found where cold air replaces warm air.
2 Where do mid-latitude cyclones form?
These weather systems occur between approximately 30° and 60° north and south of
the Equator. In both hemispheres they move from west to east within the westerly wind
belts (Figure 10).
© Via Afrika Publishers >> Geography 12 Study Guide eBook 24
TOPIC1 Climate and weather
Tropics
— latitudes:
Tropics
Figure 10 Mid-latitude climate zones (and other major latitudinal zones)
Sometimes a series of fronts will develop, in which three or four fronts follow one after
the other in a ‘family’ of fronts. In the Southern Hemisphere the oldest frontal system
(which arrives first) will be furthest towards the south-east. Each younger member is
slightly further north and west than its predecessor (Figure 11).
Figure 12 A family of fronts
© Via Afrika Publishers >> Geography 12 Sludy Guide eBook 25
TOPIC 1 Climate and weather
3 What are the conditions necessary for the formation of
mid-latitude cyclones?
A mid-latitude cyclone is a large spiral of air that forms and breaks up, along the polar
front. The conditions favourable to the formation of a mid-latitude cyclone are:
¢ Two large high pressure systems (anti-cyclones) are in contact on the polar front.
¢ The warm, subtropical high pressure contains a warm, moist maritime air mass.
¢ The polar high pressure contains a cold, dry air mass.
¢ The air flow converges from opposite directions on the two sides of the polar front.
¢ Disturbances on the polar front cause a local low pressure into which air will flow
and around.
4 What are the stages of development and related weather
conditions of mid-latitude cyclones?
The diagrams below show the four stages in the development of a mid-latitude cyclone.
4.1 The initial stage
¢ Warm, moist subtropical air meets cold, drier air along a stationary polar front.
¢ There is no movement across the polar front (Figure 12).
e The air masses do not mix, but move parallel to each other in opposite directions on
both sides of the front.
1008 hPa
rs
a
polar front
boundary zone between the two air masses
a -
1006 hPa
COLD AIR
.————
1008 hPa
Figure 12 The initial stage
© Via Afrika Publishers >> Geography 12 Study Guide eBook 26
TOPIC 1 Climate and weather
4.2 Development or wave stage
e A disturbance occurs on the polar front and it now has a wave-like appearance
(Figure 13).
cold front warm winds blow polar front bends due
to disturbance
\ 4 warm Lt 4 ne
‘ \ front \ No Se
cold winds. \ - ;
\ \ cold winds
blowonto ~~ blow onto
cold front t cold front
Figure 13 The development or wave stage
4.3 Mature stage
¢ Cold air moves in a northerly direction, west of the low pressure centre. A cold front
develops.
e Warm air is pushed in a southerly direction, east of the low pressure centre. A warm
front develops.
¢ Winds blow clockwise around and into the low pressure, in the Southern
Hemisphere (Figure 14).
y i: warm sector
% ema
% a
f 7004 hp,
fom” 1002 hp. oe
/ C
cold air
low
Figure14 The mature stage
4.4 Occluded stage
¢ Cold air wedges in under the warm air, lifts it up and isolates the warm air from the
Earth’s surface. This process is called occlusion. The front that is formed is called an
occluded front (Figure 15).
e Figure 16 shows what happens three-dimensionally as the system develops to the
occlusion stage.
© Via Afrika Publishers >> Geography 12 Study Guide eBook 27
TOPIC1 Climate and weather
warm sector
4004 i
_—_—>
cold air warm air
4002
4.000 cold
| air
low /
occluded
front
Figure 15 The occlusion stage
cumulonimbus clouds
stratiform clouds, often nimbostratus
stratus clouds ahead
of the cold front
Figure 16 A three-dimensional representation of the occlusion process
4.5 Dissipating stage
In the dissipating stage, cold air completely isolates warm air from the ground as all the
warm air has been lifted high above the ground (Figure 17).
(Ga
P surrounded by cold air
nr
Figure 17 The dissipating stage
© Via Afrika Publishers >> Geography 12 Sludy Guide eBook 28
TOPIC1 Climate and weather
5 What is the weather associated with mid-latitude
cyclones?
Questions on the weather associated with mid-latitude cyclones and the reasons are
often set in exams and you should make sure you know and understand Tables 3 and 4.
Table 3 The weather associated with mid-latitude cyclones
DEPRESSION MOVES IN THIS DIRECTION
COLD AIR
cold heavier %
polar air sinks —
undercuts warm air
\ cumulonimbus
cumulus:
COLD AIR
ground level
fewer and lighter heavy and short period fair or lengthy period cloud getslower —_ high, thin cloud
showers frequent of heavy rain - drizzle of steady rain and thicker develops
showers possible hail and
thunder
Figure 18 The weather associated with a passing mid-latitude cyclone
As the cold front approaches Warm sector As the warm front approaches
¢ The temperature falls. e The temperature is at its ¢ The temperature is low but
¢ = The warm air rises and highest. rises slowly.
cumulonimbus clouds start e The pressure is at its lowest. | ¢ Rain falls.
to form. e = The wind is northerly or e = The wind is north easterly.
e The pressure starts to drop. north westerly. e Warm front conditions are
e Rain falls. seldom experienced over
e = There is a drop in humidity. South Africa as they are
e ~The wind backs and becomes usually too far south.
south westerly.
Table 4 Reasons for weather changes at the cold front
Changes Reasons
Temperature falls. The cold air behind the cold front has arrived.
Wind backs. Air blows in a clockwise direction around a Southern Hemisphere low pressure
system.
Cloud cover increases. The warm rises over the cold air, is cooled and condenses.
Pressure drops. Pressure is at its lowest just ahead of the cold front.
Rain falls. If the rising air is sufficiently moist and unstable heavy rain falls.
© Via Afrika Publishers >> Geography 12 Sludy Guide eBook 29
TOPIC 1 Climate and weather
Unit 2 Tropical cyclones
1 What are the general characteristics of tropical
cyclones?
Tropical cyclones cause considerable loss of life and damage to property, vegetation
and economic activities, mostly along the east coasts of continents.
Tropical cyclones are intense low pressure systems.
They originate in late summer or autumn over warm tropical oceans (at least 26 °C),
except in the southern Atlantic Ocean.
They need Coriolis force to form, which is zero within 5° of the Equator, so they
develop within latitudes 5° and 20° N and S.
They move westwards at a rate of 40-200 km a day. Near 20-30° N and §, they tend
to curve back eastwards at a rate of 500-700 km/ day.
As low pressure areas, their rotation is clockwise in the Southern Hemisphere and
anti-clockwise in the Northern Hemisphere.
The source of energy in tropical cyclones is the large amount of latent heat released
as rising warm, moist tropical air condenses.
They are accompanied by heavy rain, storm surges and high winds.
2 Where do tropical cyclones form?
Tropic of Cancer---S2>
(Hurricanes
Equator
: on T Niaie
lovember = = Z
iN ~ ) J @®Tropical cyc ejben
Tropic of Capricorn g. December—Mai cyclones|
June-October
luaty-March
ein” u Sf
®
Mean number of tropical | january-March
cyclones per year occurrence cycl
Time of Tropical Local name Sea temperatu re
Figure 19 Tropical cyclones: global location and mean frequency
© Via Afrika Publishers >> Geography 12 Study Guide eBook
30
TOPIC1
Climate and weather
3 What are the factors necessary for tropical cyclones to
form?
Exam questions are often set on the requirements and reasons for the formation of
tropical cyclones and you should make sure you know and understand Table s.
Table 5 Requirements and reasons for the formation of a tropical cyclone
Requirements
Reasons
Ocean temperatures over 27°C
¢ Heat is needed for convection.
e = Friction is at a minimum over the ocean.
e = The air is heavily charged with water vapour in a
tropical maritime atmosphere.
Unstable air
Atmospheric instability makes convection possible.
Very low pressure and steep pressure gradient
e Rapid convergence helps the air to rise.
¢ The steep pressure gradient helps Coriolis Force
to develop and causes the rotation.
An undisturbed period of several days
Time is needed for the slow convergence of warm
moist air towards the low pressure centre.
Some upper-air triggering action
A strong horizontal divergence of air at upper levels
stimulates the circulation and formation of a vortex.
Winds must be light and variable before the
formative period.
Strong winds or winds from a constant direction:
e will prevent the development of a vortex
e = disturb the low level distribution of water vapour
e reduce the surface temperature of the water.
4 What are the stages of development of tropical
cyclones?
The life cycle of a tropical cyclone, which may last a number of days, can be divided in
four stages (Table 6). Nevertheless, unfavourable conditions may stop the development
at any stage.
© Via Afrika Publishers >> Geography 12 Study Guide eBook 31
TOPIC 1 Climate and weather
Table 6 The stages in the development of a tropical cyclone in the Southern Hemisphere
Formative stage
e The pressure is still above 1 000 hPa but dropping
quickly.
e Winds are already at gale force in the front left-hand
quadrant.
Developing stage
¢ Pressure is now below 1 000 hPa and continuing to fall.
e Winds are now hurricane strength in the front left-hand
quadrant near the eye, with gales further away
Mature stage
e Pressure is now very low, as low as 900-940 hPa in the
eye but has stopped falling.
¢ Weather and winds (hurricane strength) are at their
worst especially in the worst weather quadrant.
Degenerating or dissipating stage
e =Pressure begins to rise.
e Winds drop in strength.
e = There is still heavy rain.
© The system is by probably over land or over cooler water
and does receive latent heat.
© Via Afrika Publishers >> Geography 12 Study Guide eBook
32
TOPIC 1 Climate and weather
5 What are the associated weather patterns?
Table 7 Weather conditions at the passage of a tropical cyclone
As the cyclone approaches
As the eye is overhead
As the cyclone moves away
e Temperature rises
e Calm though there is a sea
swell which begins to
increase
e = High cirrus clouds on the
horizon
e Pressure begins to fall
¢ Wind strength increases
e Temperatures increase
slightly
¢ Wind drops suddenly
¢ Pressure is at its lowest
e = Light scattered cloud
¢ Sunshine
¢ Calm conditions for an hour
or two
¢ First set of conditions
repeated
¢ Winds have reversed their
direction
e Conditions gradually
improve until the cyclone
has passed
¢ Cumulonimbus clouds
approach
¢ = Torrential rain
e Storm surge swamps low
lying areas
e Temperatures drop.
6 Across-section through a mature tropical cyclone
tony Ss
ioe =
Toe = eye
atmosphere Ox \ a iM
\
\ ee
\
\
\
/ ma /
{ (a / cA spiral band of
| thunderstorms.
\
: \ee
near surface ocean
convergence of
moist warm air
Figure 20 A cross-section through a tropical cyclone
© Via Afrika Publishers >> Geography 12 Study Guide eBook 33
TOPIC 1 Climate and weather
7 How do you recognise tropical cyclones on synoptic
maps?
Characteristics of a tropical cyclone on synoptic maps are:
¢ alow pressure cell with closed isobars between 5° and 30° N and S of the Equator
(Figure 21)
¢ symbol for tropical cyclone in the eye (centre of low pressure)
e name of the tropical cyclone written next to system
¢ the date of the map in late summer or early autumn.
_|_ Bulawayo@e—IS
a pA
2 |
1016.
Figure 21 Synoptic weather map of 25 January 2012
© Via Afrika Publishers >> Geography 12 Study Guide eBook 34
TOPIC 1 Climate and weather
8 What are the impacts of tropical cyclones on human
activities and the environment?
Tropical cyclones are the most destructive natural hazards in terms of frequency and
number of deaths. Not only people, but also the natural and constructed environments
are affected. The main causes of the destruction are heavy rain, strong winds and, in
coastal areas, the storm surge. The storm surge often causes the most damage.
In more developed regions, such as the USA, the damage is mainly monetary while in
the less developed areas, such as Mozambique, there is more loss of life and less
monetary damage.
9 What are the strategies to help prepare for and manage
the effects of tropical cyclones?
Warnings about impending tropical cyclones are normally given by the local weather
office. You should listen regularly to the radio and/or watch TV and pay attention to
advice and instructions.
10 The differences between tropical cyclones and mid-
latitude cyclones
Table 8 The difference between tropical cyclones and mid-latitude cyclones
Tropical cyclones
Mid-latitude cyclones
Names Typhoons (China, Japan) Extra-tropical cyclones, mid-latitude
Hurricanes (America) cyclones, depressions
Origin Tropical oceans 5-30° N and S At polar front 40-60° N and S
Pressure Very low Low
Pressure gradient Very steep Less steep
Movement East to west carried by tropical West to east carried by the
easterlies westerlies
Wind speed Very fast Not as fast
Size 250-500km diameter 1000-3500 km diameter
Weather Hot, destructive winds, heavy rain | Cool, cloudy and rainy
© Via Afrika Publishers >> Geography 12 Study Guide eBook
35
TOPIC 1 Climate and weather
Unit 3 Subtropical anticyclones and
associated weather
1 South Africa's climate and weather are determined by
three controlling factors
¢ The influence of the surrounding ocean. The oceans moderate the temperatures of
coastal areas. The warm Agulhas current promotes rainfall on the east while the
cold Benguela current makes for a dry west coast.
¢ The plateau of the interior (altitude). Most of the interior of South Africa lies at an
altitude of 1 500 metres above sea level. This lowers the temperature of the interior.
¢ The subtropical anticyclones. This means that South Africa generally has a dry
climate with high temperatures.
4, Oceans surrounding the 2, The plateau 3. The subtropical anticyclones
sub-continent
Its high altitude lowers temperatures. With South Africa is situated in the subtropical
They have a moderating influence on the the steep escarpment ‘along the coast” high pressure zone where air sinks and
weather and climate. The cold Benguela preventing moist air coming into the interior, _results in higher temperatures and dry,
current brings cooler, dry air into the west _—_drier conditions are caused inthe interior. _ cloudless weather.
coast. Along the east and south coast, the
warmer Mozambique and Agulhas currents
bring warm, moist air over the adjacent
coastal regions.
~~~ Cold current High pressure H
“—& Warm current Central plateau jum
The South Atlantic high-pressure
system is usually situated far
off the Namibian coast. As air
‘The warm air lying over cold air
‘The position of the South Indian high-
above the cold ocean causes a
pressure system over the sea east of
Durban fluctuates more than that of the
South Atlantic high. Ittends to move away
from the coast during summer, but moves
nearer again in winter. The anti-cyclonic
circulation causes north-westerly winds
blowing over the eastern parts of South
Africa. As these winds blow over the warm
‘ocean, it brings warm, moist and unstable
air which may cause rain when reaching
the cooler land area.
1
y
1
descends, itwarms adiabatically. | == ~
1
{
‘
‘
t
‘
|. permanent inversion and stable 4
' air. South-westerly winds, caused |! The Kalahari high-pressure system over the central plateau is
( not as well developed as the Atlantic and Indian cells. Apart
f from a slight weakening and southward displacement during
{ summer, this cell remains fairly stable throughout the year,
‘ and its influence on circulation therefore remains constant.
f This pressure system is a towering three-dimensional system
f leaning slightly to the west. While its base is usually above the
{ plateau in the east, at a height of 6 000 m above sea level, itis
q situated above Namibi
by anticyclonic circulation blowing:
towards the land, are common.
These winds that blow towards
the north-east, tend to retain their
moisture as they move from a colder
to warmer latitude, This causes dry
conditions along the west coast of
South Africa,
Figure 22 Main factors controlling South Africa’s climate
© Via Afrika Publishers >> Geography 12 Study Guide eBook 36
TOPIC 1 Climate and weather
2 What are the characteristics of the high pressure cells?
The high-pressure cells are weather systems characterised by:
e descending air (Figure 23)
¢ air that comes from the drier upper atmosphere
e descending air warming at around 1 °C / 100 m
e clear, sunny and dry weather conditions
¢ moving northwards in winter and southwards in summer.
1026 hPa
convergence
winds bent
by Coriolis
force
meee > divergence
general movement of air
Figure 23 Air movements round a Southern Hemisphere anticyclone
3 How does the anticyclonic air circulation around South
Africa influence the weather and climate?
Winter: Subsiding air in the Kalahari cell heats lower layers causing a dry interior.
Because of the cold plateau with no rising air, an inversion layer is formed. This is often
lower than the escarpment and prevents moist air moving in from the Indian Ocean.
Summer: The sinking air of the Kalahari high pressure cell is weaker. The plateau is hot
and air rises, causing thermal lows. The inversion layer is now higher, above the
escarpment. Warm, moist air can flow in from the ocean, causing extensive rainfall in
the eastern part of the country.
© Via Afrika Publishers >> Geography 12 Study Guide eBook 37
TOPIC1 Climate and weather
dry sinking air
version layer: temperature
* increases with height
rising warm moist air
from the sea
WINTER
Seasonal impact of the ee
Kalahari HP cell and
inversions
air from the sea
we rising warm moist
SUMMER Pe ae
Kalahari HP cell weakens
over interior
Figure 24 Seasonal impact of the Kalahari high-pressure cell and inversions
4 What are the travelling disturbances associated with
anticyclonic air circulation in South Africa?
4.1 Line thunderstorms and moisture fronts
Most thunderstorms over the interior are associated with a moisture front extending
from the north-west to the south-east.
© Via Afrika Publishers >> Geography 12 Sludy Guide eBook 38
TOPIC 1 Climate and weather
4.1.1 How the moisture front develops
Moist, warm, unstable air from the South Indian high comes in from the north-east.
Drier, cooler, more stable air comes in from the South Atlantic high from the south-
west. The contact zone between these different air masses is known as the moisture
front.
The dry, cooler air from the south-west is denser and heavier and it ridges in under the
north-east air mass, forcing it to rise and causing cooling and cloud formation in the
moist, north-east air mass. Thunderstorms develop in a wide strip north-east of the
moisture front or trough axis (Figure 25). Line thunderstorms only develop in summer
because of the lifting of the inversion layer in summer.
NE |
warm, moist air.
* es
H \
\
Seca” 7 / \ \ NON ! \,
Cid “ Ms \ mae System moving in this direction
Figure 25 Line thunderstorms develop along the eastern side of the moisture front
4.2 The coastal low
A coastal low-pressure system is a weak low pressure cell, about 100 km wide, in the
lower layers of the atmosphere (Figure 25). Coastal lows occur when the wind blows
from the land to the sea. This results in warm, often strong, offshore berg winds in front
of the low and cool onshore flow behind it.
© Via Afrika Publishers >> Geography 12 Study Guide eBook 39
TOPIC 1 Climate and weather
The clockwise circulation causes an off-shore air flow on the leading side. As this air is
heated adiabatically it reaches the coast as a dry, warm (berg) wind. On the non-leading
side of the coastal low the air is on-shore and brings cool, cloudy weather.
4.3 Berg winds
Berg winds are warm, dry offshore winds, descending from the high-lying areas and
blowing towards the sea. Berg winds occur mainly in winter, but they can also cause
very dry and hot days during other seasons. Berg winds can he recognised on synoptic
charts by:
¢ temperatures much higher than the normal for winter especially along the coast
¢ low humidity — a large depression to the dew point
e winds blow from the interior to the sea.
Coastal LP
moves south and
east along coast
and berg winds
shift ahead of it.
Betg wind
Cape Town ey Na
Port Elizabeth
erg wind
Figure 26 A coastal low and berg wind
© Via Afrika Publishers >> Geography 12 Study Guide eBook 40
TOPIC 1 Climate and weather
5 Synoptic weather maps linked to subtropical
anticyclonic conditions
5.1 Summer conditions
¢ The westerly wind belt and its depressions move south of the continent (Figure 27).
¢ Temperatures generally are high.
¢ The South Indian high is situated eastwards and anticlockwise circulation
transports moisture on its way to the continent.
¢ Uplift along the escarpment can cause clouds and precipitation.
¢ The South Atlantic high is closer to the west coast and brings in dry air.
¢ A moisture front forms where the different air masses from the Indian and Atlantic
Oceans meet (west of the low pressure trough).
¢ Thunderstorms develop along the moisture front.
¢ Note the position of tropical cyclone Dando on Figure 27.
my,
a7
5 10 15
Figure 27 A synoptic map showing summer conditions
© Via Afrika Publishers >> Geography 12 Study Guide eBook 41
TOPIC 1 Climate and weather
5.2 Winter conditions
The synoptic weather map in Figure 28 illustrates weather patterns typical of winter
conditions.
e The pressure systems shift northwards.
¢ The cold fronts are closer to the continent.
¢ Temperatures are generally lower than summer conditions
e The Kalahari anticyclone is over the interior. This results in dry conditions with little
cloud cover.
Walvis oy SEY
Figure 28 A synoptic map showing winter conditions
© Via Afrika Publishers >> Geography 12 Study Guide eBook 42
TOPIC 1 Climate and weather
6 Reading and interpreting synoptic maps
Isobars close together show a steep pressure gradient and strong winds. When
isobars are far apart there is a gentle pressure gradient with weak winds.
In the Southern Hemisphere air circulates clockwise round low pressure and anti-
clockwise round high pressure.
Low pressure cells show that air is converging and rising and there is a possibility of
rain. High pressure cells show diverging subsiding air and the skies will be clear.
Onshore winds bring moist air onto the land. Offshore winds are dry.
The sub-tropical high pressure helt is split into three: the South Atlantic high, the
Continental or Kalahari high and the South Indian high.
These pressure cells are further south in summer and further north in winter. The
Kalahari high is usually only seen in winter.
A trough of low pressure can usually be found over the land in summer. It extends
from the north-west (Namibia) to the south east (Eastern Cape).
Mid-latitude cyclones usually blow over the land in winter but are usually further
south in summer and miss the land.
Sometimes there is a coastal low pressure cell on the coast. It usually moves around
the coast from west to east.
Tropical cyclones are sometimes seen in the Indian Ocean in summer.
The Western Cape receives its rain in winter while the plateau receives its rain in
summer.
Temperatures over the land in summer will be higher than they are in winter.
Most exams have questions on a synoptic map. You must be able to tell the difference
between winter and summer maps (Table 9).
Table 9 The differences between summer and winter synoptic maps
Summer Winter
¢ Temperatures in the high 20s and low 30s ¢ Temperatures in the low 20s and high 10s
e Kalahari high seldom seen e Kalahari high often seen
¢ Low pressure trough usually over land e Low pressure trough seldom over land
e ©Mid-latitude cyclones usually to the south of e =©Mid-latitude cyclones usually over the land
the land ¢ Never a tropical cyclone in the Indian Ocean
¢ Sometimes a tropical cyclone in the Indian e =Never rain on the plateau
Ocean ¢ Often rain in Western Cape
e Sometimes rain on the plateau
e Seldom rain in Western Cape
© Via Afrika Publishers >> Geography 12 Study Guide eBook 43
TOPIC 1 Climate and weather
Unit 4 Valley climates
1 How is the micro-climate in valleys influenced by the
slope?
Micro-climatology deals with the climates of small areas. Aspect refers to the direction a
slope faces, and thus to the exposure of the slope to the Sun.
The direction of the valley sides influence the angle at which the Sun's rays strike the
Earth's surface. Although an equal amount of sunlight strikes each place, the sunlight
striking the north-facing slope is distributed over a small area. On this slope the Sun's
rays will be most effective and this slope will be warmer. The effects of aspect are more
noticeable in winter when the Sun’s rays are at more of an angle. In the Southern
Hemisphere the north facing slopes are warmest (Figure 29).
Figure 29 Sun’s rays falling ona valley in winter in the Southern Hemisphere
2.1 The effects of aspect on human activities.
Because in the Southern Hemisphere south-facing slopes are cooler there is less
evapotranspiration. In the Natal Midlands the south-facing slopes are often wooded
while the warmer north-facing ones consist of grass. In South Africa traditional
communities prefer the warmer north-facing slopes of the escarpment rather than the
valley floors and the south-facing slopes. In cities north-facing slopes are more
popular for residential areas. In Europe agricultural activities are usually confined to
the warmer south-facing slopes.
© Via Afrika Publishers >> Geography 12 Sludy Guide eBook 44
TOPIC1 Climate and weather
3 What weather phenomena are associated with the micro-
climate in valleys?
3.1 Anabatic and katabatic winds
Valleys produce their own winds due to unequal heating of the valley slopes during the
day (Figures 30 and 31).
3.1.1 During the day
e Inthe morning, air above the valley slopes heats up more than air on the valley
floor. Warm air rises towards crests, causing up-slope winds.
¢ Later in the day, with more heating, air from the valley floor becomes less dense and
rises, causing an up-valley anabatic wind.
calm sunny day high level return flow
cloud over summit
strong
updraught
above valley |
Figure 30 Anabatic or valley wind
© Via Afrika Publishers >> Geography 12 Sludy Guide eBook 45
TOPIC1 Climate and weather
3.1.2 During the night
e Asa result of terrestrial radiation, air on the high slope sides cools, becomes denser
and flows down the valley sides to form a down-slope wind.
e Later in the night, the air in the upper part of the valley cools, become denser and
starts to flow down the valley. This causes a down-valley katabatic wind.
e If the down-valley flow is not fast, frost and fog may develop, particularly in
hollows.
These winds, although usually gentle, affect the microclimates and human activities.
For example, along the slopes in the Franschhoek valley rows of dense hedges are
planted to obstruct the downward flow of cold air and keep it away from the vineyards
below. During the dry season both anabatic and katabatic winds may become
dangerous in the spread of bush and forest fires.
Figure 32 Katabatic or mountain wind
© Via Afrika Publishers >> Geography 12 Sludy Guide eBook 46
TOPIC 1 Climate and weather
3.2 Inversions and frost pockets
e Oncalm, clear, winter nights the air on the high ground on the sides of the valley is
cooled by terrestrial radiation (night time cooling).
¢ The cold, more dense air sinks down the valley sides and collects on the floor of the
valley, sometimes causing a frost pocket.
¢ The warm air that was on the valley floor rises onto the middle slopes of the valley,
causing a thermal belt of warmer air (Figure 32).
air on upper slopes or
z hill tops cool due to
cold air terrestrial radiation
Figure 32 Temperature inversion: emissions are trapped by a layer of warm air in a valley.
3.4 Radiation fog
¢ Radiation fog, typically found in valleys is formed when nights are cold, clear and
cloudless.
e Under such conditions the Earth’s surface and the layer of the atmosphere in
contact with it cool rapidly.
e Ifthe dew point temperature is reached, condensation occurs and many minute
droplets are formed and are suspended in the air.
e Fog on the valley floor disappears rapidly during the course of the morning after
isolation starts, when the Earth radiates heat into the atmosphere.
3.5 Utilisation of valley floors
e Valley floors are often popular sites, because of their level topography, agricultural
land and the availability of water. Frost hardy plants are grown on valley floors
while sensitive plants are grown on the valley sides. Settlements develop in the
thermal belt, which is the warmest part of the valley and its sides.
¢ Nocturnal inversions and katabatic airflow in valleys tend to create pollution in
cities as the pollution cannot escape.
© Via Afrika Publishers >> Geography 12 Sludy Guide eBook 47
TOPIC 1 Climate and weather
4 Urban climates
4.1 What are the differences and the reasons for the differences
between rural and urban climates?
Table 10 The urban climate compared to that of rural surroundings
Local climate in Differences Reasons for these differences
urban areas
Annual mean 0,5-4 °C Urban areas consist mainly of artificial surfaces (like bricks,
temperature higher concrete, tar) which absorb more heat. High-rise buildings have
Winter minimum | 1-3 °C higher | larger surface areas, which absorb and retain heat. Fuel
temperature combustion in factories and vehicles also contribute to
temperature rise.
Cloud cover 5-10% more Condensation can take place only if there are hygroscopic nuclei
Fog in winter 100% more around which droplets can form. Pollutants like smoke and dust
Fog in summer 30% more serve as condensation surfaces. Smog lowers visibility.
Precipitation 5-15% more More precipitation is likely, because of a higher possibility of
Snow fall 5% less condensation and cloud formation. The relatively warmer
Thunderstorm 16% more, conditions in winter reduce the possibility of snow fall. Greater
frequency especially in instability and strong convection over built-up areas can cause
summer vertical cloud development, resulting in more frequent
thunderstorms.
Wind speed 25% lower; Buildings create a sheltering effect. This causes friction and they
greater act as windbreaks. Buildings create wind channels and turbulent
turbulence eddies form in streets aligned with high-rise buildings.
Relative humidity | 6% less Lack of sources of moisture like vegetation and water bodies in
cities limits evapotranspiration. Surface water is removed quickly
by the urban drainage system and does not penetrate the ground.
Dust, pollutant 10 times more | Combustion processes, the burning of fossil fuels, traffic and
particles building activities add dust and smoke into the air over a city.
Amount of solar Up to 30% The amount of sunshine reaching the surface is reduced due to
radiation less the increased amounts of pollutants and clouds over cities.
© Via Afrika Publishers >> Geography 12 Study Guide eBook 48
TOPIC 1 Climate and weather
4.2 What is an urban heat island?
e A heat island is the hotter area of a city surrounded by the cooler urban fringe and
rural areas (Figure 33).
e The higher urban temperatures cause an urban heat island to develop over the city.
This heat island reaches its greatest intensity above the city centre and diminishes
towards the suburbs. Within this heat island the air is less dense and begins to rise.
Cooler air from the suburbs moves in to replace this.
¢ Urban heat islands exist throughout the year, but their effect is more pronounced at
night and in winter when temperatures are lower. This is also the situation when
there is an anticyclonic subsidence of air, which often happens in southern Africa in
winter.
warm air from CBD can rise, dark brick buildings,
resulting in convection concrete and tarmac store
central heating from shops gutters and drains remove thunderstorms and release heat, which is released at
rain quickly so less heatis of latent heat
used to evaporate ge
and offices in CBD can warm nights
air in the streets
high-rise buildings
reduce wind speed at
the surface — warm air
can build up
rivers can provide cool areas
as heat is absorbed and used
in evaporation
suburbs increase
urban sprawl, but low
cool air comes in from sea —> I ; ‘ density land use, so
more limited impact
industry and offices release
large quantities of heat,
especially if buildings are
poorly insulated concentrations of people in
cities add to heat
traffic pollution
creates a dust zone,
large park with grass, trees and adds heat as well
and bushes, use up heat as CO,, SO, and diesel
(evaporation) particulates
Figure 33 Factors influencing urban heat islands
4. 2.1 What effects do urban heat islands have?
e Increase human discomfort especially in summer.
¢ Cause heat stress and deaths during heat waves.
e Increase conditions suitable for the spread of disease caused by insects such as
mosquitoes and fleas.
¢ Reduce visibility due to smog, particularly in winter.
e Increase smog.
e Increase air conditioner use leading to release of more heat and greenhouse gases,
which degrade local air quality.
e Increase biological activity, for example, growing season length, which is positive.
¢ Reduce ice and snow in winter, which is positive.
© Via Afrika Publishers >> Geography 12 Study Guide eBook 49
TOPIC1
Climate and weather
Table 11 The urban heat island during the day and night
Features
Vertical dimension
Day
e Heating results in
increased turbulence,
thus a relative decrease in
stability of the lower
atmosphere.
© Heat island grows
vertically and therefore is
less concentrated.
e Pollution is dispersed
over a greater area.
cC" sinking warm air from anticyclone
Lie sll lh, eta al tt th
800m
rural suburbs i suburbs rural
Night
e = Asitis cooler at night the
height decreases and is
more concentrated.
° The ‘heat bubble’ is now
denser and shallower and
takes on a dome shape
due to the cooling of the
air.
¢ Pollution is concentrated
in the dome.
rural suburbs city suburbs rural
4.3 What is a pollution dome?
A pollution dome is a mass of polluted air in and above a city or industrial area. This air
is prevented from rising by the presence of an inversion above it. If there is a wind, the
pollution will be carried downwind to form a pollution plume.
© Via Afrika Publishers >> Geography 12 Sludy Guide eBook 50
TOPIC 1 Climate and weather
4.3.1 What are the effect of a pollution dome on people and the environment?
Urban pollution has both seasonal and long-term effects on humans and the
environment.
¢ Lead poisoning may result from petrol fumes and old paint peeling off buildings.
e Respiratory discomfort and asthmatic attacks may increase due to smoke emissions.
e The pollutants tend to increase cloud cover and precipitation.
¢ Insolation is reduced by pollution, especially in the morning when the Sun’s
oblique rays have to penetrate an even thicker layer of pollution.
e The pollutants cause smog, which contributes to higher temperatures, reduces
visibility and is harmful to humans and plant life.
¢ The release of oil and coal combustion emissions in the air forms acid rain. This
pollutes rivers and lakes, causes damage to buildings and kills plants and fish.
e Increased use of fossil fuel powered plants also increases emissions of greenhouse
gases, such as carbon dioxide (CO:), which contribute to global climate change.
sinking cold air creates an inversion layer
cold air drains
into valley
Pollutants mixing depth is
conceal. ba: shallower in winter
the basin —
Figure 34 The formation of air pollution on a winter's morning in Pietermaritzburg
4.4 How can the heat island effect be reduced?
The reduction of the urban heat island effect depends on a number of factors. Some of
them are within and some outside of a community’s control. Climatic conditions and
the relief cannot be changed. Decision makers can select energy-saving strategies that
will create a healthier and more sustainable environment. Creating urban green spaces
like parks and roof gardens, appropriate building design and public transport, can all
contribute to reducing urban heat islands.
© Via Afrika Publishers >> Geography 12 Study Guide eBook 51
TOPIC 1 Climate and weather
Questions
Question1
|
Match the definitions in the left hand column with the key concepts in the right hand
column. You should try to do Question 1 as a closed-book test. If this is difficult you
could do it as an open-book test (using the glossary at the back of the Via Afrika
Geography Grade 12 Learner’s Book) and then do it again as a closed-book test. A
knowledge of these concepts is vital for success in the final examination. You should
keep working at it until you can do it correctly.
11 Surface of contact between two air masses of A 30°S
different temperatures
1.2 Name in Japan for tropical cyclones B_ | Advection
1.3. | Another name for a high pressure cell c Air mass
1.4 Climatic conditions on a local scale D Anabatic
1.5 | Gravity or mountain winds E | Anticlockwise
1.6 | Causes mid-latitude cyclones to move from west to F Anticyclone
east
1.7. | Urban area of higher temperatures surrounded by G_ | Aspect
tural area of lower temperatures
1.8 | Vertical movement of air HK | Backing
1.9 | Horizontal movement of air | Berg wind
1.10 | Surface of contact between the cold polar air andthe | J Berg winds
warm westerlies
1.11 | Another name for a low pressure cell K Clockwise
1.12 | Second stage in the formation of tropical cyclones L Coastal low
1.13. | An elongated low pressure cell M_ | Cold front
1.14 | Direction of movement around a high pressure cellin | N Condensation nuclei
the southern hemisphere
1.15 | Climatic conditions on a regional scale QO | Convection
1.16 | Refers to the direction in which a slope faces in P Cumulonimbus
relation to the Sun’s rays
1.17 | Causes tropical cyclones to move from east to west Q_ | Cut off low
1.18 | Large body of air which has distinct characteristics in | R Depression
temperature
1.19 | Area of calm in the centre of a tropical cyclone Ss Dew
1.20 | An elongated high pressure cell T Dust dome
1.21 | Direction of movement around a low pressure cell in U Easterlies
the southern hemisphere
1.22 | Upslope winds in a valley Vv Eye
1.23. | Type of front where warm air overrides cold air W_ | Family of depressions
© Via Afrika Publishers >> Geography 12 Study Guide eBook 52
TOPIC1
Climate and weather
1.24 | Cloud type associated with tropical cyclones x Front
1.25 | Another name for the continental high Y Heat island
1.26 | Hot, dry winds that are common in winter Zz Immature
1.27 | Term used to describe incoming solar radiation AA | Insolation
1.28 | 3-D representation of the heat island. AB | Inversion
1.29 | Type of front where cold air undercuts warm air AC | Isobar
1.30 | Another name for the interior low AD | Isohyet
1.31 | Inland depression that is prevented from moving ina | AE | Isotherm
south easterly direction by the ridge of the South
Atlantic high
1.32 | The area between the cold and warm fronts AF | Kalahari high
1.33 | Average latitudinal position of the South Atlantic / AG | Katabatic
South Indian high.
1.34 | Low pressure cell associated with berg winds AH | Macroclimatology
1.35 | Phenomenon whereby a cold front overtakes a warm Al | Microclimatology
front
1.36 | A grouping of temperate cyclones A) | Occlusion
1.37. | The anticlockwise change of direction of a wind AK | Polar front
1.38 | Warm dry wind experienced on the South African AL | Ridge
coast
1.39 | Hydroscopic particles, such as dust or grains of salt AM | Storm surge
which may attract water vapour and cause
condensation
1.40 | Moisture condensed from the air and deposited on AN | Thermal low
grass and other plants especially during the night
1.41 | Aline joining places on the map having the same AO | Trough
temperature
1.42 | Aline joining places on the map having the same AP | Typhoon
pressure
1.43 | Aline joining places on the map having the same AQ | Warm front
rainfall
1.44 | The piling up of water against a coast caused by AR | Warm sector
strong on-shore winds
1.45 | An increase in temperature with height AS | Westerlies
45x2=(90)
© Via Afrika Publishers >> Geography 12 Study Guide eBook 53
TOPIC 1 Climate and weather
Question 2
|
Indicate the best answer to the multiple choice questions below. As with Question 1 try
to do it with your books closed. If it is too difficult do it as open-book test and later
again, as a closed-book test.
2.1 Extra-tropical cyclones have both cold fronts and warm fronts. What weather is
associated with cold fronts as they pass over a point?
A
D
wind veers, decrease in temperature, rise in dew point and there is cloud
cover
wind veers, increase in temperature, pressure increases, rise in dew point
and there is cloud cover
wind backs, rise in dew point temperature, increase in temperature,
pressure drops and there is cloud cover
wind backs, decrease in temperature and pressure drops
2.2 What effect do extra-tropical cyclones have on South African weather?
A
B
Cc
D
rain and cool air onto the Highveld
rain throughout South Africa
winter rainfall in the SW Cape and cold air in the interior
lower coastal temperatures only
2.3. The main difference between tropical and extra-tropical cyclones is that extra-
tropical cyclones have fronts. What are fronts?
A
B
Cc
D
warm air found in front of cold air
the one side of an extra-tropical cyclone
the beginning of cyclogenesis
the transition zones that separate the different air masses
2.4 In what season do extra-tropical cyclones usually occur?
A
moo Ww
winter in the Southern Hemisphere
autumn in the Southern Hemisphere
summer in the Southern Hemisphere
spring in the Southern Hemisphere
at all seasons
© Via Afrika Publishers >> Geography 12 Sludy Guide eBook 54
TOPIC 1 Climate and weather
2.5 Figure 1shows a graph of weather conditions over a 48 hour period of a tropical
cyclone.
®
42 48 hour
direction of movement
Figure 1
2.5.1 Line 1 on the graph (Figure 1) shows the relationship between time and...
A wind speed
dew point temperature
air temperature
atmospheric pressure
moo Ww
rainfall
2.5.2. Line 2 on the graph (Figure 1) shows the relationship between time and ...
wind speed
dew point temperature
air temperature
atmospheric pressure
BOO wD PP
rainfall
2.5.3. Line 3 on the graph (Figure 1) shows the relationship between time and...
A wind speed
dew point temperature
air temperature
atmospheric pressure
moO Ww
rainfall
© Via Afrika Publishers >> Geography 12 Study Guide eBook 55
TOPIC 1 Climate and weather
2.5.4 Line 4 on the graph (Figure 1) shows the relationship between time and...
A
B
Cc
D
E
wind speed
dew point temperature
air temperature
atmospheric pressure
rainfall
2.6 — Ifa tropical cyclone does not reach land, what other factors can account for its
dissipating?
A
B
Cc
D
E
decrease in air pressure
decrease in moisture
rise in temperature
increase in air pressure
both B and D
2.7. Howcan you identify a tropical cyclone on a synoptic chart?
ed
0 ao DW
warm and cold fronts
synoptic symbol, closed isobars and high wind speed
isobars and synoptic symbol
the existence of a high pressure
both A and B
2.8 What is the basic pattern of air movement over South Africa?
A
D
E
South Africa is dominated by the easterlies, the westerlies and tropical
cyclones
South Africa is dominated by extra-tropical cyclones and berg winds
South Africa is dominated by three shifting high pressure cells and
frontal depressions that originate in the westerly wave belt
South Africa is dominated by the Kalahari cell, thunderstorms and the
plateau
Both A andB
2.9 How does the ocean affect the South African weather?
A
moo Ww
leads to extremes of temperature and reduces precipitation
moderates the temperature and increases the chances of precipitation
influences the aspect, relief and summer rain
leads to high rainfall on the east and west coasts
raises the temperatures on the plateau
© Via Afrika Publishers >> Geography 12 Study Guide eBook 56
2.10
2.13
2.14
TOPIC 1 Climate and weather
From where does interior of South Africa get most of its rain?
ed
0 oO DW
disturbances along the moisture front
the Zimbabwe air boundary
the westerly wave belt
the Inter Tropical Convergence Zone
tropical cyclones
How does the interior plateau affect South Africa’s climate?
A
B
Cc
D
E
increases winter precipitation with height above sea level
decreases winter precipitation with height above sea level
increases temperature with height above sea level
decreases temperature with height above sea level
both A and D
The interior of South Africa is dominated by sub-tropical anticylonic circulation.
What does this mean?
ed
0 ao DW
the easterlies and the westerlies join together
there is a high pressure belt within the easterlies
there are mid-latitude cyclones affecting the Western Cape
winters are generally dry and sunny
both C and D
What causes the westerly wind belt to move north in winter?
A
B
Cc
D
E
the apparent movement of the rainfall belt
summer air temperature
winter air temperature
ocean currents
the apparent movement of the overhead sun from the Tropic of Capricorn
to the Tropic of Cancer
An important aspect of climatology is micro-climatology. What is micro-
climatology?
A
moO
the climate of places with a small range of temperature
the climate of towns and their surrounding rural areas
the climate of a small area
the climate close to the ground
both A and C
© Via Afrika Publishers >> Geography 12 Study Guide eBook 57
TOPIC 1 Climate and weather
2.15 Why is there a greater frequency of fog and precipitation in cities as compared to
the surrounding rural countryside?
A
moo Ww
artificial heat sources
higher population density
more hygroscopic nuclei
artificial materials
both A and D
2.16 What makes up air pollution in the cities?
A
B
Cc
D
E
combustion, chemical gases and exhaust fumes
smog and dust particles
carbon monoxide and lead in petrol
BandC
A, Band C
2.17. What is a temperature inversion?
ed
0 ao DW
a dry adiabatic lapse rate in the atmosphere
when temperature decreases with height in the atmosphere
a wet adiabatic lapse rate in the atmosphere
when temperature increases with height in the atmosphere
both A and C
2.18 Which of the following best describes a heat island?
A
cities form a small island of higher temperatures surrounded by cooler
temperatures in the rural area
because of global warming both rural and urban areas are heat islands
is a city that is, on average, warmer than other world cities
the area in the city that is hotter by day but colder by night than the rural
areas
an area above a city that has more pollution than the surrounding rural
area
2.19 Which is correct about an urban heat island during the day?
A
B
due to general subsidence the horizontal component increases
due to a decrease in stability and an increase in turbulence the vertical
dimension of the heat island decreases
due to an increase in stability and an decrease in turbulence the vertical
dimension of the heat island increases
© Via Afrika Publishers >> Geography 12 Study Guide eBook 58
TOPIC 1 Climate and weather
D due to a decrease in stability and an increase in turbulence the vertical
dimension of the heat island increases
E none of these
2.20 What effect does the location of mountain and hill slopes have on a valley
climate?
A at lower latitudes slopes facing the equator are coolest
B at higher latitudes slopes facing the equator are warmest
Cc at the poles the slopes facing the equator are coolest
D at the equator the slopes facing away from the Sun are coolest
E both A and C
2.21 Table 1 below shows temperatures on two consecutive July days at 06:00 ona
farm in the Drakensberg.
Table 1
Temperatures °C
Height First day Second day
Station X 800m 5 -6
Station Y 1400m -1 1
2.21.1 In Table 1 the weather responsible for causing the differences in temperature is
likely to occur when ...
A anabatic winds are blowing
B the winter is warm
Cc there is a cloud barrier at 1 300 m
D a cold front is situated over the area
E the nights are clear and cold
2.21.2 In Table 1 the most likely answer for the lower temperatures at X is...
¥ has a sunny aspect while X has a north-facing slope
A
B X has snow while Y has not
Cc the air at X is drier than that at Y
D
during the night there has been rapid terrestrial radiation and cold air
has dropped down the valley sides
E Band D
25x2=(50)
© Via Afrika Publishers >> Geography 12 Study Guide eBook 59
TOPIC 1 Climate and weather
Question 3
The Grade 12 final exam, usually, if not always, has questions based on a synoptic map.
Make sure you can do this question and it should help you at the end of the year.
3.1 Study Figure 2 showing a Southern African synoptic weather map and answer the
questions that follow.
Figure 2
3.1.1 Name each of the high pressure systems A and B.
3.1.2 Identify the climatic feature with low pressure at C.
3.1.3. Draw a fully labelled cross-section from D to E showing the sectors and ai
2x2=(4)
(2)
r
movement. 5x2=(10)
3.1.4 Name the line marked F and state its pressure in hPa.
3.1.5 What season does this synoptic weather map represent?
2x2=(4)
(2)
3.1.6 Give three reasons for your answer based on evidence visible on the synoptic
weather map.
3x2=(6)
© Via Afrika Publishers >> Geography 12 Sludy Guide eBook
60
TOPIC 1 Climate and weather
3.2 Refer to the station model of Port Elizabeth below when answering the questions
that follow.
30
>
3.2.1. Name the type of wind (not direction) that has resulted in the conditions as
indicated by the station model. (2)
3.2.2. Account for the atmospheric conditions being experienced in Port Elizabeth.
4x2=(8)
3.2.3. Describe two measures that can be put in place to reduce the impact of possible
veld fires resulting from these conditions. 2x2=(4)
(42)
TOTAL MARKS [182]
© Via Afrika Publishers >> Geography 12 Study Guide eBook 61
°
°
TOPIC 2 Geomorphology
Topic 2 Geomorphology
Unit 1 Drainage systems in South Africa
Running water on the surface of the Earth is the most dominant agent of change in the
physical landscape. The study of the relief features shaped by running water, for
instance mountains, hills, floodplains, valleys and waterfalls is known as fluvial
geomorphology. A fluvial geomorphologist studies everything in connection with
rivers, from the pebbles in the river bed to the velocity of the water flow, to determine
the condition of the river.
1 What are the characteristics of drainage basins?
The drainage basin acts as a system with inputs, flow, storage and outputs. Water and
sediment move through the system. A drainage basin is the total area of land surface
drained by a stream network (Figure 35).
rainfall
Figure 35 Components of a drainage basin
© Via Afrika Publishers >> Geography 12 Sludy Guide eBook 65
TOPIC 2 Geomorphology
1.1 Features of a drainage basin
The main features of drainage basins are illustrated in Figure 35 and defined in Table 12.
Table 12 The main features of drainage basins
catchment area The area over which rain falls that is caught by a drainage basin
river system Amain river with all its tributaries
watershed An area of high ground separating two drainage basins
tributary A river that joins another larger river
river mouth Sea or lake where the river ends
source Where the river begins
confluence The place where two rivers join
water table The upper level of underground saturated rock
surface run-off The surface flow of water
groundwater Water found under the ground
interfluve High lying area or spurs between two river valleys
infiltration Movement of water through soil into the ground
2 What are the different types of rivers?
Permanent rivers flow all year round and are always in contact with the water table.
The Tugela River is an example.
Periodic rivers only flow during the rainy season. They are in contact with the water
table only in the rainy season. The Limpopo River is a South African example.
Episodic rivers only flow after heavy rain. These rivers are found in regions where
there is low rainfall, which evaporates quickly. The Auob and Nossob Rivers of the
Kalahari in Northern Cape are examples.
Exotic rivers span two types of climatic regions. These rivers usually rise in high
rainfall areas and flow into dry regions The Orange River (or Gariep) rises on the eastern
side of South Africa, and flows through the drier western side before it reaches the
Atlantic Ocean.
© Via Afrika Publishers >> Geography 12 Study Guide eBook 66
TOPIC 2
Geomorphology
3 What are drainage patterns?
Stream channels create a variety of drainage patterns on the surface of the Earth. By studying
the stream patterns of an area, one can learn much about underlying structures and rock types
(Table 13).
Table 13 Drainage patterns
Parallel drainage pattern
Requirements
Characteristics
Example
Recently uplifted
sloping plain
e = The main streams
flow parallel (or
Tributaries of the
Steelport River in
e = Rock type uniformly nearly) to each Limpopo
resistant to erosion other.
e = The tributaries
enter the main
streams at very
small angles.
Dendritic drainage pattern
Requirements Characteristics Example
Rock is uniformly
resistant to erosion.
Pattern is not
dependent on
geology.
e The pattern is tree-
shaped.
e = The tributaries join
the main stream at
acute angles.
Most rivers in South
Africa, for example
Tugela, Mooi, Umgeni
Trellis drainage pattern
View
Requirements
Characteristics
Example
ridges of
B® resistant
= rock
_ ‘softer rock
Parallel ranges of
fold mountains or
alternate layers of
hard and soft rock.
A strong main
stream
The pattern is
dependent on the
relief and the
¢ Tributaries meet the
main streams at
right angles.
e = The main streams
cut gaps through
the mountains.
geology of the area.
Buffels River at
Laingsburg
© Via Afrika Publishers >> Geography 12 Study Guide eBook
67
TOPIC 2
Geomorphology
Radial drainage pattern
Requirements Characteristics Example
Dome-shaped hill, | ¢ Streams radiate Koffiebus, Teebus
conical hill, mesa, outwards froma
butte central high point.
Rectangular drainage pattern
View Requirements Characteristics Example
Well jointed rock
with joints exposed
at the surface
¢ Rivers flow in
exposed joints.
e Rivers and
tributaries have
right angled bends.
Rivers in the Waterberg
(Limpopo)
Centripetal drainage pattern
Requirements
Characteristics
Example
.
A central basin ora
low lying area such
as a lake or a marsh
¢ Streams radiate
inwards from a
surrounding higher
area.
¢ ~The opposite of a
radial drainage
Common in the flatter
parts of Namaqualand
pattern
Deranged drainage pattern
Requirements Characteristics Example
Geologically young
areas
¢ ~Haphazard pattern
e Numerous lakes
and swamps
¢ Streams enter and
leave swamps and
lakes randomly.
Recently glaciated areas
such as the Canadian
Shield
© Via Afrika Publishers >> Geography 12 Sludy Guide eBook
68
TOPIC 2 Geomorphology
4 What is drainage density?
Drainage density refers to the average length of the streams in the area of a drainage
basin. Drainage density can be calculated by making use of the following formula:
Drainage density = total length of streams in the basin (km)
area of the drainage basin (km2)
Drainage density can be described as high and low (Figure 36).
Figure 36 Equivalent areas with high drainage density (left) and low drainage density (right)
¢ More infiltration will cause fewer rivers to occur, causing a low drainage density.
¢ More runoff will cause more rivers to occur, causing a high drainage density.
5 How do you identify stream order?
Drainage basins can be described and compared by means of a ranking system known
as stream order. Streams without tributaries are first order streams. When two first
order streams join they result in a second order stream and when two second order
streams they form a third order stream and so on. When a stream of a lower order joins
a stream of a higher order the higher one remains unchanged. This arithmetic process is
known as geo-adding.
© Via Afrika Publishers >> Geography 12 Sludy Guide eBook 69
TOPIC 2 Geomorphology
EX Cia a re iS Aig. NY
=e 1 127
\ & 2
1 sO 1
r? EN aC Oo 1
yf X S i SAS ike -
I 1 1 i NpNiea A165 KLE
Figure 37 Topographic map with the stream order indicated by numbers
The following laws of stream orders show the relationship between stream order and
factors such as gradient, number of streams, stream length and the size of the drainage
basin.
e There are more streams of a lower order than of higher order.
e The lower the stream order, the steeper the gradient.
¢ The lower the stream order, the shorter the length of the stream.
¢ The lower the stream order, the smaller the drainage basin.
© Via Afrika Publishers >> Geography 12 Study Guide eBook
7o
TOPIC 2 Geomorphology
6 What is the nature of river discharge?
River discharge is the volume of water that flows down a river. The stream flow can be
either laminar or turbulent.
e Laminar flow is found where water flows over a level and even river bed. The water
moves as parallel sheets (Figure 38).
¢ Turbulent flow occurs where the river bed is uneven and steep. The water moves in
a bubbling, turbulent manner, continually changing levels (Figure 39).
ee
ee Oe ae
Figure 38 Laminar flow Figure 39 Turbulent flow
© Via Afrika Publishers >> Geography 12 Study Guide eBook 71
TOPIC 2 Geomorphology
Unit 2 Fluvial processes
1 What are river profiles?
A river uses energy to do its ‘work’ of erosion, transportation and deposition of
sediment, and to move a body of water in its channel from its origin to its mouth. In this
way, the river valley is continually deepened and widened. River profiles are described
as either transverse (cross) profiles or longitudinal profiles.
1.1 What is a transverse river profile?
The transverse profile shows the shape of the river valley from one bank of the river to
the opposite bank. The shape is dependent on whether vertical erosion or lateral
(sideways) erosion is the dominant force. The cross profile of a river looks like a V-
shape. The shape of the cross profile changes throughout the course of the river (Figure
40). It can help you to see if erosion (vertical or lateral) or deposition is taking place.
1. UPPER COURSE 2. MIDDLE COURSE 3. LOWER COURSE
(YOUNG STAGE) (MATURE STAGE) (OLD STAGE)
t i
1 |
H meanders f floodplains
ds and waterfall | river cliffs 1 oxbow lakes
! | deltas
1 I
1 I
'
\ transportation \ deposition
J I
I
vertical corrosion i valley widening alluvium deposition sea
_ deposition)
a. fe
steep gorge-like or open, widening gently- very gently-sloping,
V-shaped valley sloping valley smooth, wide valley
Figure 40 The transverse profile of a river in its upper, middle and lower courses
© Via Afrika Publishers >> Geography 12 Sludy Guide eBook 72
TOPIC 2 Geomorphology
1,2 What is the longitudinal profile?
The longitudinal profile shows the changes in the altitude of a river’s course from
source, along its channel to sea level. Usually the longitudinal profile has a concave
shape. It will have a steep gradient at the source and a gentle gradient at the mouth
(Figure 40).
The upper part has the most: POUIEE!
© turbulence
© roughness
° friction
The lower part has the:
© greatest discharge
* lowest velocity et
/
mouth
Figure 41 The longitudinal profile of a river and associated landforms
1.2.1 Temporary and permanent base levels in the longitudinal profile of a river
The lowest level at which a river can erode is called the permanent base level. Sea level
is called the permanent base level because the river cannot erode downwards any
further. Temporary base levels such as a dam, rapids or a waterfall could be found
along the course of a river. All base levels are temporary, except the sea, which is the
ultimate base level (Figure 41).
1.2.2 The stages of a river seen on topographic maps
Figure 42 shows the features of the three stages of the Berg River in the Western Cape on
topographic maps. In the upper course (Figure 41) the contours are closer to each other,
indicating steep slopes and short tributaries. In the middle course, the contours are
further apart. The gradient becomes more gradual and tributaries are longer. The slope
in the lower course is very gradual. Therefore deposition of sand, meanders and braided
streams are found in this course. The river becomes wider as it flows from its source to
the mouth.
© Via Afrika Publishers >> Geography 12 Study Guide eBook 73
TOPIC 2 Geomorphology
UNS
5
Carinusoruglh 6!
soe
Figure 42 Three stages of the Berg river in the Western Cape
2 What are fluvial landforms?
The greater the velocity of a river, the greater the amount of energy will be available to
transport material and cause erosion. Deposition of sediment takes place when the
speed of the river reduces and the energy of a stream decreases. As a result, different
landforms are formed, along the course of a river.
2.1 Floodplains
Floodplains are natural features of many rivers. They are flat and are on the sides of the
river. Floodplains are usually found in the lower course of a river where the valley is
widened by means of lateral erosion but smaller flood plains can also be seen in the
middle course. When the river bursts its banks in a flood sediment is deposited on
either side of the river (Figure 43). This builds up after each flood. Typical landforms of
a floodplain are natural levées, meanders, oxbow lakes, braided streams and deltas.
© Via Afrika Publishers >> Geography 12 Study Guide eBook 74
TOPIC 2 Geomorphology
bluffline |
width of floodplain
coarser material
levee deposited first
Figure 43 Cross section of a floodplain
2.2 Natural levées
During periods of overbank flooding, the coarsest material will be deposited first and
this can form a natural embankment, called a natural levee, next to the river (Figure
43). Levées can be strengthened artificially to act as flood barriers.
terrace-edge of meander belt
point bar ~ convex bend depostion
oxbow lake formed by meander
neck being cut through
Figure 44 Typical landforms on a floodplain
2.3 Meanders
Meanders are curves or bends found along the course of a river (Figures 44 and 45).
They are usually found in the middle course or lower course of a river, and constantly
change their shape and position. Meanders move across the floodplain by eroding the
curved outside banks (Figure 45).
© Via Afrika Publishers >> Geography 12 Sludy Guide eBook 7
TOPIC 2 Geomorphology
erosion
— x channel width
Ls \ \:
! deposit radius of
i
ay
flow ’
\ \
_— oa
7 pool er
P (o}
oo siffle 2 ;
point of maximum erosion
Figure 45 Meanders move laterally by erosion and deposition
2.4 Oxbow lakes
As erosion continues on the outside bends (undercut slopes) of the meander, the neck
of the meander gets narrower. During a flood, the river breaks through the neck and
shortens its course. The cut ends of the meander are sealed by deposition and a oxbow
lake is formed (Figure 46). The oxbow lake may eventually dry up due to evaporation,
and be filled with sediment.
lateral erosion
deposition
> fastest current
Figure 46 The formation of an oxbow lake
© Via Afrika Publishers >> Geography 12 Sludy Guide eBook 76
TOPIC 2 Geomorphology
2.5 Braided streams
Braided streams are streams that have many channels and islands of sediment between
those channels (Figure 47). When a river does not have the energy to carry its load the
load is deposited in the river bed.
Figure 47 Topographic map of Kanoneiland showing braided streams and intervening islands
2.6 Waterfalls and rapids
Waterfalls and rapids are usually found in the steeper upper course of a river. A
waterfall forms when a river, after flowing over hard, resistant rock, meets a band of
softer, less resistant rock. The river erodes the softer rock faster than the harder rock
(Figure 48). Rapids are smaller scale versions of waterfalls.
more resistant
strata
knickpoint migrates
slowly upstream
erosion undercuts
more resistant strata hard rock creates
uneven slope, causing rapids
Figure 48 The formation of waterfalls and rapids through erosion
© Via Afrika Publishers >> Geography 12 Sludy Guide eBook 77
TOPIC 2 Geomorphology
2.7 Deltas
When a river reaches the sea or a lake it slows down, loses energy and deposits its load.
If the load of sediment cannot be carried away by tides and ocean currents a delta is
formed. Layer upon layer is deposited until the sand and mud may build upwards and
outwards to form a roughly triangular delta. No South African river forms a visible delta
as the tides and currents remove the sediment before it can settle.
3 What is river grading?
A graded river is in a state of equilibrium and neither erodes nor deposits. A graded
river has a gently sloping, concave profile.
The river illustrated in Figure 49A has an ungraded profile, because it contains a
waterfall and a lake. These are temporary bases of erosion. Erosion will exceed
deposition at the waterfall, and deposition will exceed erosion at the lake.
lake: deposition will exceed erosion
until the feature is filled in
smooth concave profile decreasing in angle and
gradient towards the mouth
Figure 49 Comparison of a river with an ungraded profile (A) and a graded profile (B)
© Via Afrika Publishers >> Geography 12 Sludy Guide eBook 78
TOPIC 2 Geomorphology
4 What is river rejuvenation?
River rejuvenation takes place when there is an increase of a river’s speed and erosive
power. The rejuvenated river erodes a new valley in the old one (Figure 50}.
Before rejuvenation After rejuvenation
original graded section
of river
knickpoint
rejuvenated river flowing
in a valley-in-valley due to
increased erosion
tributary river terrace rapids
Figure 50 River rejuvenation
4.1 Causes of rejuvenation
River rejuvenation may develop as a result of:
¢ a worldwide lowering of sea level
e raising of the land through forces in the Earth’s crust
¢ asignificant increase in rainfall
¢ arapidly flowing tributary that joins the main stream
e river capture where the increased volume of water enlarges the erosion capacity of
the stream.
4.2 Landforms associated with rejuvenation
4.2.1 Knickpoint
A knickpoint is a break in the slope of a river profile caused by a rejuvenated river.
There is often a waterfall, called the knickpoint waterfall, at this point. Augrabies Falls
on the Orange River (Gariep) is a knickpoint waterfall.
© Via Afrika Publishers >> Geography 12 Sludy Guide eBook 79
TOPIC 2 Geomorphology
4.2.2 Terraces
When rejuvenation of a river flowing on a wide valley floor occurs, a new valley is
carved into its own floodplain. This produces steps on either side of the valley. These
are terraces, and they often occur in pairs on either side of the valley (Figure 51).
Paired alluvial terraces
Figure 51 Paired alluvial terraces
4.2.3 Incised meanders
An incised meander is a deep, steep-sided meander (bend) formed by the severe
downwards erosion of an existing meander. Such erosion is usually brought about by
the rejuvenation of a river. Incised meanders form when rejuvenation occurs ina
stream which is already meandering.
5 What is river capture or stream piracy?
River capture (stream piracy) occurs when a powerful river cuts back at its source by
headward erosion and captures the headwaters of a neighbouring river. This often
occurs through a process of abstraction.
© Via Afrika Publishers >> Geography 12 Sludy Guide eBook 80
TOPIC 2 Geomorphology
5.1 Abstraction
Abstraction occurs when the stream on one side of the watershed is a more energetic
stream than the stream on the other side, because it runs down a steeper slope. More
rapid erosion of the steeper slope causes the watershed to move (Figure 52).
In South Africa abstraction occurs mainly in the Drakensberg, where the rivers of
KwaZulu-Natal flow eastwards down a steep gradient over a distance of 200 km to the
Indian Ocean. The westward flowing Orange River flows along a more gentle gradient
over approximately 2 000 km to the Atlantic Ocean.
watershed before abstraction
watershed after abstraction
Figure 52 Abstraction due to more rapid erosion of a steep slope. Rivers A and B flow on opposite sides of the
watershed. Because river B flows down a steeper slope than river A, river B will be more energetic, and therefore
causes erosion to be faster. The watershed moves from position 1 to position 2. As a result, the drainage basin
of the more energetic stream (B) grows.
5.2 River capture
River capture occurs where a river cuts
through a watershed and intercepts a river
flowing on a higher level. An example of this
is the Kunene River in Namibia. The Kunene
used to flow to the Etosha pan, but was
intercepted in its middle course by an
eastward eroding river from the coastal plain
to the sea (Figure 53).
—z
NAMIBIA
Atlantic
Ocean
Figure 53 River capture by the Kunene has cut off the water supply to the Etosha Pan.
© Via Afrika Publishers >> Geography 12 Sludy Guide eBook 81
TOPIC 2 Geomorphology
5.3 What are the features associated with river capture?
The following features are associated with river capture (Figure 54).
¢ The captor stream is the river which captured the waters of the other river.
e The river whose waters were captured is called the captured stream.
e The stream that has lost its water now flows in a valley that is too big for the stream.
This stream is called the misfit stream.
¢ The elbow of capture is the place where the stream piracy has taken place.
e The wind gap is the dry river valley with river gravel between the elbow of capture
and the misfit stream.
Figure 54 Features associated with river capture
6 What are superimposed and antecedent drainage
patterns?
You have already learnt that drainage patterns are influenced by the hardness or
softness of the underlying rock and the patterns of faults or fractures in these rocks.
Sometimes the drainage pattern does not relate to the rock structures or landscape over
which it flows. When this occurs, it is due to superimposed drainage or antecedent
drainage. The difference between superimposed and antecedent drainage is that the
superimposed stream is younger than the structure through which it flows while the
antecedent is stream is older.
© Via Afrika Publishers >> Geography 12 Sludy Guide eBook 82
TOPIC 2 Geomorphology
6.1 Superimposed drainage patterns
Superimposed drainage exists where a river established its course in rock layers which
have been removed by erosion (Figure 55). The stream which subsequently imposed its
course on underlying rocks of a completely different nature is called a superimposed
stream. Superimposed streams are younger than the structures through which they cut.
A Before removing of overlying rock layer B_ After removal of overlying rock layer
Figure 55 A superimposed stream, before erosion of the overlying rock layer (A) and after erosion (B)
6.2 Antecedent drainage patterns
An antecedent stream existed on an earlier landscape that was subsequently raised. The
stream was able to maintain its original course, in spite of uplift or the formation of a
mountain or ridge from below. The stream cut through the obstruction as it was formed.
The uplift may be due to folding, faulting or warping. The term antecedent refers to the
fact that the course of the river developed before the uplift occurred (Figure 56).
A before uplift B after uplift as a result of faulting of the plateau
Figure 56 An antecedent stream eroding into an uplifted plateau
© Via Afrika Publishers >> Geography 12 Sludy Guide eBook 83
TOPIC 2 Geomorphology
Unit 3 Catchment and river management
Management of catchment areas (the area over which rain falls that is caught by a
drainage basin) and rivers occurs when people try to control or alter the natural flow of
water.
1 Why is managing drainage basins and catchment areas
important?
Drainage basins are managed for irrigation purposes.
It is important to manage river flow by building dams to ensure a permanent source
of water.
Rivers need to be managed to provide flood control. This can be done by preventing
settlement below the flood line, by building dams, or by diverting water away from
settlements.
Catchment management is necessary to protect water resources and make water use
sustainable.
Rivers can be used for recreation, like water sports. caravan parks and holiday
resorts are also sometimes found along rivers and next to dams.
Management is needed to control pollution.
2 What are the impacts of people on drainage basins and
catchment areas?
River water is polluted by industrial effluent, agricultural run-off and untreated
sewage.
The nature of run-off can be changed by building dams.
Removal of vegetation can lead to flooding.
Cities and other structures built on the floodplain of the river decrease infiltration.
This can lead to flooding in urban settlements.
Swamps, which serve as sponges during flooding, are drained.
The ecology of rivers and their catchment areas is disturbed by the removal of water
for irrigation, industry, mines and domestic use.
Meanders can be eliminated by means of channels.
Inter-basin transfer of water involves the transfer of water from areas with a water
surplus to those with a water shortage.
© Via Afrika Publishers >> Geography 12 Study Guide eBook 84
TOPIC 2 Geomorphology
Questions
Question1
Answering multiple choice questions is an excellent way to revise your work. Answer as
many as you can without looking at the text book. Use your text book to help you with
the ones you cannot answer correctly.
Match the question with the correct option.
Figure 1
11 In Figure 1 the line marked 1 shows ...
A an interfluve
B a drainage basin
Cc the area surrounding rivers
D the river mouth
E the headwaters
1.2 In Figure 1 the point marked 2 shows ...
an interfluve
a drainage basin
A
B
Cc a watershed
D a confluence
E
none of these
© Via Afrika Publishers >> Geography 12 Sludy Guide eBook
85
1.3
1.4
1.5
1.6
1.7
TOPIC 2 Geomorphology
In Figure 1 the stream order at 2is ...
none of these
In Figure 1 the line at 3 shows ...
A
B
Cc
D
E
an interfluve
a drainage basin
a watershed
a confluence
a tributary
In Figure the area around 4 shows...
A
B
Cc
D
E
the headwaters
the mouth
an interfluve
confluences
none of these
In Figure 1 the line at 5 shows ...
A
B
Cc
D
a tributary
a drainage basin
a watershed
a confluence
an interfluve
Streams generally erode ...
A
moo Ww
along both banks in a stretch of straight water
along the inner banks of a meander
along the outer banks of a meander
along the stream bottom
none of the above
© Via Afrika Publishers >> Geography 12 Study Guide eBook
86
1.8
1.9
1.12
TOPIC 2 Geomorphology
Which of the following statements are NOT true?
A
B
Cc
D
interlocking spurs are formed by deposition
vertical erosion occurs in steep parts of the river’s course
rapids are a series of little waterfalls
ox-bow lakes are formed from wide meander loops
Which of the following features would you NOT find in the lower stage of a river?
ed
0 ao DW
flood plain
rapids
levees
estuaries
CandD
If all other factors remain constant except the stream becomes ... at some point,
the water will speed up.
A shallower
B narrower
Cc sandier
D Bandc
Braided streams occur where the channel floor is...
A very deep
B very narrow
Cc very wide
D very flat
E very flat and wide
Which statement is correct?
A As rivers reach their lower course they widen, the gradient decreases and
the discharge increases.
B As rivers reach their lower course they widen the gradient decreases and
the discharge decreases.
Cc As rivers reach their lower course they get narrower, the gradient
decreases and the discharge increases.
D As rivers reach their lower course they get narrower, the gradient
decreases and the discharge decreases.
© Via Afrika Publishers >> Geography 12 Study Guide eBook 87
1.13
1.14
1.15
1.16
1.17
TOPIC 2 Geomorphology
Which statement describes the upper course of a river valley?
A
B
Cc
D
E
narrow valley floor, steep sides, and gentle gradient
narrow valley floor, gentle sides, and steep gradient
wide valley floor, steep sides, gentle gradient
wide valley floor, gentle sides, steep gradient
none of these
Which of the following is true of vertical erosion?
A
widens the valley, common in the upper stages of a river, when the
gradient is gentle
deepens the valley, common in the lower stages of a river, when the
gradient is steep
deepens the valley, common in the lower stages of a river, when the
gradient is gentle
deepens the valley, common in the upper stages of a river, when the
gradient is gentle
deepens the valley, common in the upper stages of a river, when the
gradient is steep
Controlling the river can be done by which one of the following?
A
increase the capacity of the river channel, straighten the river channel
and build relief channels
decrease the capacity of the river channel, straighten the river channel
and build relief channels
increase the capacity of the river channel, make more bends in the river
channel and build relief channels
increase the capacity of the river channel, straighten the river channel
and build no relief channel
Knickpoints are best associated with ...
ed
0 ao DW
backswamps
meandering streams
deltas
waterfalls and rapids
oxbow lakes
What is a superimposed stream?
A
a stream that has been captured and then rejuvenated
© Via Afrika Publishers >> Geography 12 Study Guide eBook 88
D
TOPIC 2 Geomorphology
a stream that exists on a elevated landscape
a stream that has been captured and then takes its course over a faulted
or folded landscape
a stream that takes its course from a former overlying layer
1.18 What is the base level of erosion?
A
E
when a river enters a lake or a dam, the water level represents the base
level of erosion
when the river has cut down to the pediment and there can be no further
scarp retreat
when the river is rejuvenated by the global drop in sea level
when the river has reached the pediment
both A and B
1.19 A graded stream occurs...
ed
moa ww
when velocity and discharge are balanced
when the river is saturated and deposits material on its bed
when there is neither erosion nor deposition
when the river has been rejuvenated
both A and C
1.20 The longitudinal profile of a river ...
A
a
is the diagrammatic representation of the shape of the river channel as
seen from above
causes the permanent and temporary base levels of a river
the convex shape of the river from the source to the mouth of the river
the diagrammatic representation of the relationship between the relief
and length of a given river
both A and D
20x2=(40)
© Via Afrika Publishers >> Geography 12 Study Guide eBook 89
TOPIC 2 Geomorphology
Question 2
|
Learning the correct meanings to the terms is another excellent way of revising your
work. You cannot answer a question if you do not know the meaning of the words used
in the question.
Match the columns of these terms commonly used in this section.
Term Meaning
2.1 | Antecedent drainage | A | The point where two or more streams meet and form a larger stream
2.2 | Base level B | The wearing away of the land by weathering and erosion
2.3. | Braided river C_ | The concept of equilibrium related to the profile of a river
2.4 | Confluence D | Occurs when all irregularities such as waterfalls have been
eliminated
2.5 | Dendritic drainage E | Become deepened and cut down into the landscape usually as a
result of increased erosion caused by rejuvenation
2.6 | Denudation F | A pattern of rivers in which the flow of water is away from a central
high point
2.7. | Deposition G_ | Adrainage pattern which looks like a tree when viewed from above
2.8 | Drainage basin H_ | The area which is drained by a river and its tributaries
2.9 | Grade | The level below which the land cannot be denuded by rivers
2.10 | Graded profile J The laying down of material which has been removed by denudation
2.11 | Headward erosion K_ | Shows the changes in the altitude of a river’s course from source,
along its channel, to sea level
2.12 | Incised meander L_ | Ariver system that was formed before the uplifting of relief as a
result of earth movements
2.13 | Interfluve M | Abend orcurve in the course of a river
2.14 | Knickpoint N | Astream that is too small for the size of its valley which may be
because of river capture
2.15 | Long profile O | Ariverthat splits into two or more channels that rejoin further
downstream
2.16 | Meander P | The renewal of the erosive power of a river because of a change in
gradient in the rivar’s long profile or the arrival of extra water
2.17 | Misfit Q_ | Found on the inside of a bend in a meander
2.18 | Radial drainage R_ | Abreak in the longitudinal profile of ariver which may be as a result
of rejuvenation caused by the uplift of the land
2.19 | Rejuvenation S | The area between two rivers
2.20 | Slip-off slope T | Atype of erosion which occurs at the source of a stream
20x2 = (40)
© Via Afrika Publishers >> Geography 12 Study Guide eBook 90
TOPIC 2 Geomorphology
Question 3
Study Figure 2 and answer the questions that follow.
34
3.2
33
3-4
35
= Ss Sy
S>>S>5 > 57°
Figure 2
Name the process illustrated in Figure 2. 1x2=(2)
List the labels for the characteristic features A to E shown on map Y in Figure 2.
5x2=(10)
Describe the steps in the process that led to the landscape in map Y. 3x2=(6)
Explain why river B in map Y has been rejuvenated. 1x2=(2)
List three landforms that could result from this rejuvenation. 3x2=(6)
(26)
© Via Afrika Publishers >> Geography 12 Sludy Guide eBook 91
TOPIC 2 Geomorphology
Question 4
Study the maps in Figure 3 below, showing two areas with different drainage densities
and patterns, and then answer the questions that follow.
4a
4.2
43
4.4
45
er
Figure 3
Give two reasons why area A has a lower drainage density than areaB. 2x2=(4)
Calculate the stream order at point X in area B. 1x2=(2)
Explain why a drainage density as shown in area A will cause problems for the
people living in the area. 2x2=(4)
Describe three ways in which the activities of people can have an impact on area
a 3x2=(6)
Name the drainage patterns in areas A and B. 2x2=(4)
(20)
TOTAL MARKS [86]
© Via Afrika Publishers >> Geography 12 Sludy Guide eBook 92
TOPIC 3
Rural and urban settlement
Topic 3 Rural and urban settlement
Unit 1 Study of settlements
1 What is the concept of settlement?
A settlement is a group of people who live, work and interact together in a cluster of
building structures, interlinked by communication.
1.1 Nature of settlements
A settlement may be as small as a single house in a remote area or as large as a huge
city. A settlement may be permanent or temporary. An example of a temporary
settlement is a refugee camp. However, a temporary settlement may become permanent
over time.
2 What are site and situation?
2.1 Site
Site is the land on which a settlement is
built. Early settlers were looking for
water supply, fuel, farming land, shelter
and defence (Figure 57). Ideal sites
tended to be:
e flat or gently sloping
e well drained (not marshy) and free
from any risk of flooding
e close to a permanent water supply
e sheltered from strong wind
¢ steep-sided hills.
relief — high enough to be safe
from flooding, low enough to be
sheltered from wind
defence — hilltop or inside of river
meander provides protection
resources ~ timber or rock
needed for building
transport - site ona
crossroads, river or the
coast makes access to
other places easier
fuel — wood needed to
burn for cooking and
heat
soil - deep fertile
soil makes farming
easier
Figure 57 Factors that influence the selection of a site for a settlement
© Via Afrika Publishers >> Geography 12 Study Guide eBook 95
TOPIC 3 Rural and urban settlement
2.2 Situation
Situation is the location of a settlement in relation to the surrounding area (Figure 58).
A settlement with good access to natural resources and to other settlements will grow in
size. At a larger scale, towns grow and prosper from a favourable situation.
convergence of routeways
along river valleys, gaps
in hills and towards river
crossings give high nodality
to the settlement
recreation and leisure
resources
contrasting economic
regions promoting trade.
mineral and energy
resources
flat land; bridging agricultural
point; no flood tesousces
risk; defence; good
drainage; water
supply
am
SITUATION
employment opportunities in
nearby urban centres
Figure 58 Factors that influence situation
3 What are the differences between rural and urban
settlements?
A rural settlement is a single function settlement where most of the people are engaged
in a primary economic activity, usually farming. This may range from large commercial
farms to small subsistence farms and is described as unifunctional.
An urban settlement is a multi-function settlement and consists mainly of people
engaged in secondary and tertiary activities. Urban settlements are characterised by
more numerous, larger and more densely position buildings and more complicated
infrastructure. They are multifunctional.
© Via Afrika Publishers >> Geography 12 Study Guide eBook 96
TOPIC 3
Rural and urban settlement
4 Settlement classification according to size, complexity,
pattern and function
Table 14
Classification of settlements
Size
Complexity
Population size
Purpose of buildings (services)
Isolated farmstead: 1-10
Hamlet: 11-100
Village: 101-2 000
Smallest settlement type made up of single farmhouse.
Loose grouping of farmsteads — more or less six houses and a church.
Anumber of essential functions. The main function is primary, but the
following activities also occur— butcher, baker, primary school, and
possibly a doctor’s surgery.
Town: 2001-100 000
City: 100 001-1 000 000
Metropolis:
1000 001—2 000 000
Conurbation:
2 000 001-10 000 000
Number of functions increases — major supermarkets, secondary
schools, cinemas and, usually, railway and bus stations.
Wide range of functions, including headquarters of the region’s
administration.
Large city or urban agglomeration.
Largest area of urban development — the result of originally seperate
towns and cities growing outwards and joining together.
Megalopolis: over ° Amegacity
§ 000 000
World city ¢ — Large city with international function
Pattern Function
Refers to the spacing of buildings. Rural settlements can be
either:
Refers to economic activity
Dispersed, with buildings
apart from each other
A settlement is rural if it is
unifunctional, which means it has
one function, usually a primary
activity like agriculture.
Nucleated, with buildings
close together
Urban settlements are always nucleated or clustered; they
have a dense grouping of buildings.
Urban settlements are
multifunctional, which means they
have more than one function or many
Zrunmcrrracy
functions. These functions will be
secondary, tertiary or quarternary.
© Via Afrika Publishers >> Geography 12 Study Guide eBook
97
TOPIC 3
Rural and urban settlement
large
distance apart
Increase in size of settlement, higher
population and more services
small
Figure 59 Classification of settlements in terms of size
© Via Afrika Publishers >> Geography 12 Sludy Guide eBook 98
TOPIC 3 Rural and urban settlement
Unit 2 Rural settlements
1 How do site and situation affect the location of rural
settlements?
1,1 What factors influence the choice of site?
Originally settlements had to be at good defensive sites and satisfy the basic needs of its
inhabitants. These basic needs are:
e The availability of drinking water. This could be from rivers or springs.
e The availability of building materials. This would mainly be trees but includes rocks
and thatching grass.
¢ Closeness to arable land. The inhabitants need to have fertile soils to grow their
crops.
¢ The availability of transport routes.
¢ Pasturage for livestock. Their cattle, goats or sheep have he able to graze.
e Fuel for warmth and cooking. This would usually be from trees but in many treeless
areas cow dung is used as a fuel.
2 Classification of rural settlements according to pattern
and function
2.1 Pattern
Rural settlements can be either nucleated or dispersed.
2.1.1 Dispersed or isolated rural settlements
These occur where isolated farmsteads are located each on its own land and sometimes
kilometres from its nearest neighbour.
2.1.2 Nucleated (clustered) rural settlements
A nucleated (or clustered) rural settlement pattern comprises a denser group of
dwellings and other buildings. In farming villages the farmers usually live as a group in
a central village and work in the surrounding fields by day. The buildings are usually
clustered around a central point such as a water point.
© Via Afrika Publishers >> Geography 12 Study Guide eBook 99
TOPIC 3
Rural and urban settlement
Table 15,
Advantages and disadvantages of dispersed and nucleated settlements
Dispersed
Nucleated
Advantages are economic in nature:
Farmer works for him/herself and keeps own
profits.
Farming is more efficient.
Farmer can use his/her own initiative.
Farmer lives on his/her own single tract of
land.
Farmer can maximise the use of machinery as it
does not have to be shared with other farmers.
Advantages are social in nature:
e Daily social contact — community involvement.
e People do not live in isolation.
e Protection is easier when people are together.
e There are enough people to share the work.
e There is a possibility of co-operative farming.
° Farmers can agree each to plant a different
crop and share the cost of ploughing and
fertilising land.
Disadvantages are social in nature:
There is no social contact, far from neighbours.
No protection. Lack of security as people living
on their own are more vulnerable.
No help if the farmer is sick or disabled.
Essential services (like medical care, schools,
shops) are far away, which can be dangerous if
there is an emergency.
Disadvantages are economic in nature:
e There is no independent decision making.
¢ Individuals cannot show initiative.
e Fields are scattered, which wastes time.
e Machinery is shared.
¢ = Itis difficult to be economically successful.
¢ Travelling from the village to the farm is time-
consuming and uneconomic.
¢ Plots may be too small to be economically
viable.
e Modern farming methods cannot be applied
effectively.
2.2 Function
All settlements except the very smallest have a variety of functions. In rural areas the
main functions of settlements have been:
to provide agricultural services, including a market for produce, and so they become
transport centres
to provide a place for defence in times of war.
3 What are the reasons for different shapes of
settlements?
Shape or form refers to the plan outline of the built-up area of a settlement. Settlements
may be linear (ribbon-like), rectangular, circular or star-shaped (Figure 60). The shape
of a settlement is influenced by:
positive factors, such as transport routes and flat land which encourage growth
negative factors, such as flood-prone valleys, which limit growth.
© Via Afrika Publishers >> Geography 12 Study Guide eBook
100
TOPIC 3 Rural and urban settlement
3.1 Round and square villages
Square or round settlements have houses clustered around a focal point, which is the
centre of importance for that community. This may be a well, kraal, church, market
square, or village green.
3.2 Linear villages
Linear settlements are a combination of dispersed and nucleated patterns. The
farmsteads are arranged close to one another on both sides of thoroughfares such as
roads, rivers, valleys and railway lines The properties in linear villages are long and
narrow and have a narrow front along the central thoroughfare.
3.3 T-shaped and cross-road villages
Cross-road settlements can be T-shaped settlements or star-shaped. They are found at
road junctions.
i Dispersed or
isolated houses
: | nucleated
cruciform
village
round
village
green
village
nucleated
T-village
linear
settlement
nucleated
hamlet
Figure 60 Different shapes of rural settlements
© Via Afrika Publishers >> Geography 12 Study Guide eBook 101
TOPIC 3 Rural and urban settlement
4 Land use in rural settlements
4.1 What are the characteristics of rural land use?
Land use refers to the function of an area of land — the purpose for which land is used.
Land use in rural areas has different features from that in urban areas. Some of these
are:
e residences for country workers, commuters and seasonal workers
e farming and forestry
¢ natural resources development of minerals, water supply.
© Via Afrika Publishers >> Geography 12 Study Guide eBook 102
TOPIC 3 Rural and urban settlement
Unit 3 Rural settlement issues
1 What is rural-urban migration?
The percentage of people living in cities increases steadily through rural-urban
migration. Poor harvests, lack of money and inadequate services are ‘push’ factors that
encourage people to move away from rural areas. The possibility of paid employment,
better education and healthcare ‘pull’ people to cities.
The cycle of poverty illustrated in Figure 61 explains the situation which traps many
rural populations with declining economic prospects.
Decline in agricultural
employment
ane
Reduced employment
opportunities
Reduced demand for \
services
Emigration
Deterioration
My of age/sex
structure
Reduction in population
KS
Reduced rate of
natural increase
Figure 61 The cyclical nature of rural decline, or poverty cycle
2 What are the causes and consequences of rural
depopulation on people and the economy?
The period of rapid urbanisation is caused mainly by the attraction of industrial jobs,
which causes rural depopulation. Movement to the city is partly due to ‘rural push’
(repelling action) and partly due to ‘urban pull’ (attraction). These are summarised in
Table 16.
© Via Afrika Publishers >> Geography 12 Study Guide eBook 103
TOPIC 3 Rural and urban settlement
Table 16 Some push/pull factors causing urbanisation and rural depopulation
Push factors (repelling migrants | Barrier (reasons why moving Pull factors (attracting migrants
from the countryside) may be difficult) to the cities)
Unemployment Costs Better career prospects
Mechanisation on farms Dangers Better medical and family
Poor medical and family planning | Distance planning facilities
services Transport Better educational opportunities
Few primary and secondary Leaving family Better housing
schools Better social life
Poor housing and services Better shops, transport and
Limited socialising opportunities communications
Widespread poverty Higher wages and standards of
Natural hazards living
Population pressure leading to Less threat from natural hazards
insufficient land Relatives have migrated
3 What are the effects of rural depopulation and the
strategies to address them?
Central place towns that are accessible to rural areas depend on the buying power of the
farming population. Reduced spending in towns means that many shops and
businesses in these towns cannot survive, and they close. Employment opportunities
decrease and more people migrate to cities. The rural landscape gradually becomes
depopulated. The downward cycle of rural poverty starts. Stopping, preventing and
reversing this trend involve a highly organised system of planned, co-ordinated action
on the part of the government, local authorities, and business.
4 What are the social justice issues in rural areas?
4.1 Access to resources
Poverty and lack of access to resources hinder access to social justice in rural areas
worldwide. In order to alleviate rural poverty, the present government aims to develop
viable co-operative businesses for small-scale farmers. Linking small-scale farmers with
commercial farmers enables them to participate in both the domestic market and the
lucrative global markets.
© Via Afrika Publishers >> Geography 12 Study Guide eBook 104
TOPIC 3 Rural and urban settlement
4.2 Land reform
In South Africa, land is a highly contested resource. On the one hand, private
ownership of productive land favours a racial minority, while on the other hand there is
a need to strike a balance between ownership and the benefits from use of land. The
current South African government aims to alleviate poverty, especially in rural areas,
by transferring land ownership to the millions of South Africans who have been denied
access to this economic resource. It intends to achieve this objective through land
reform programmes.
© Via Afrika Publishers >> Geography 12 Study Guide eBook 105
TOPIC 3 Rural and urban settlement
Unit 4 Urban settlement
1 What are the origin and development of urban
settlements?
1.1 Urbanisation of the world’s population
On a global scale towns and cities are expanding rapidly. By 1995 over 45% of the
world’s population lived in urban areas. In most MEDCs over 70% of the population
lives in towns and cities. By contrast, in many African and Asia LEDCs, only 33% of
people are urban dwellers.
1.2 The growth of towns and cities
Urbanisation in MEDCs began as a result of the Industrial Revolution during the
nineteenth century. People migrated from the countryside to the towns looking for work
in factories. Over time, towns expanded to become cities. Urban growth is the physical
expansion of towns and cities.
2 How do site and situation affect the location of urban
settlements?
A combination of physical factors making up the site and human factors determine
where urban settlements are located.
2.1 Physical factors
The physical factors affecting the development of a site for urban settlement include:
¢ availability of fresh water
e underlying rock and soil structure
e relief — too steep slopes make building difficult, therefore flat land is preferred
e drainage — flooding is avoided
¢ aspect of slope — slopes facing the Sun are warmer (north facing slopes in the
Southern Hemisphere and south facing slopes in the Northern Hemisphere)
¢ resources — minerals will encourage industrial development.
© Via Afrika Publishers >> Geography 12 Study Guide eBook 106
TOPIC 3
2.2 Social factors
The social factors affecting the selection of a situation for urban settlement include:
3 How can urban settlements be classified according to
Rural and urban settlement
transport routes — nodal points (where roads and rivers meet), towns near mountain
passes or ports
bridging points over rivers — to allow mobility
harbours — to promote trade
defensibility — hill-top settlements were important
building materials — for construction
food supply — to support growing populations.
function?
junction town -
developed at important
transport junctions,
for example De Aaris a
road-rail junction town
gap or gateway
settlement - ata
physical ‘gap ‘such
as a pass througha
mountain range, for
example Worcester
specialised town
— specialises ina
particular function, for
example, the university
in Stellenbosch;
mining, for example
Phalaborwa;
tourism, for example,
Plettenberg Bay
break-of-bulk
settlements —
where one mode
of transport is
changed for
another, for
example Durban
sno
central place —
provides services
to surrounding
population, for
example Paarl
Figure 62 Examples of urban settlements classified according to their function
© Via Afrika Publishers >> Geography 12 Study Guide eBook
107
TOPIC 3 Rural and urban settlement
3.1 Examples of settlement functions
Central places — A central place is an urban settlement that provides urban services for
the surrounding rural community. For example, Upington provides services to people
living in the sparsely populated Northern Cape. Ermelo and Cradock serve as centrally
located markets and service centres for the surrounding farming areas.
Trade and transport settlements — Urban settlements that established due to trade
and transportation. For example, East London developed around a harbour.
Break of bulk points — Locations where one type of transport is replaced by another.
For example, Durban harbour, where goods which have been transported by road or
rail are loaded on board ships, and the other way around.
Specialised cities — Centres with one dominant function and the location of the centre
is decided by the occurrence of natural resources such as fish, minerals, timber,
agriculture or tourism, for example, Plettenberg Bay.
Junctions towns — Urban settlements that developed at important transport junctions
such as river crossings, railway and road junctions. Junction points occur at junctions
of rivers, rail routes and roads. For example, De Aar (Northern Cape) is a road-rail
junction.
Gateway towns or gap towns — Gateways are natural gaps or passes through physical
obstacles such as mountains. Roads converge at a point to make use of the gap. For
example, Worcester (Western Cape) is situated near the Hex River Mountains Pass
leading to the Karoo.
© Via Afrika Publishers >> Geography 12 Study Guide eBook 108
TOPIC 3 Rural and urban settlement
Unit 5 Urban hierarchies
1 What is urban hierarchy?
1.1 Urban hierarchy
The term ‘hierarchy’ refers to the arrangement of a settlement in a sequence or order of
importance. At the bottom of a settlement hierarchy there are many low-order rural
settlements, like villages, which offer few services. At the top of the hierarchy there is
likely to be one high-order urban settlement, like a city, which will provide many
specialised services.
1,2 Central place
Most urban settlements are central places supplying urban services to their surrounding
rural communities
1.3 Threshold population
The minimum number of people required to support a shop or a service so that it
remains profitable is called the threshold population. Large shops selling luxury items
require a large threshold population while small shops selling convenience goods such
as bread and milk have a low threshold population. A primary school has a lower
threshold population than a high school.
1.4 Sphere of influence
The area that people travel from to use a shop (or service) is its sphere of influence,
sometimes called the catchment area. Shops with a large sphere of influence depend on
good transport links to bring shoppers to them. A primary school has a smaller sphere
of influence than a high school.
1.5 Range of goods
The range of goods is the maximum distance people are prepared to travel to use a shop
or service. People will travel further to buy a luxury motor car than they will to buy
bread and milk. Low-order services will have small threshold populations and small
range. A primary school has a smaller range of goods than a high school.
© Via Afrika Publishers >> Geography 12 Study Guide eBook 109
TOPIC 3 Rural and urban settlement
2 What are lower and higher order functions and services?
Functions and services are activities provided to meet people’s needs. Examples include
shops, schools, banks and sports centres. These shops and their services can be
hierarchically organised and ranked from lower order functions to higher order
functions (Figure 63). There is a direct correlation between population size and the
range of services offered by settlements. Larger settlements offer a wider variety of
services within a broader range than smaller settlements.
Examples of services
Settlement size and the services offered cities
general hospital
concert hall
more functions 5 high order department store
than average university
art gallery
— secondary school
technical college
swimming pool
middle order cinema
% fewer functions | pee store
than average anks
attorney
primary school
butcher
newsagent
low order doctor
post office
Lit hall
Number of services provided
Population size of settlements —_—~>
Figure 63 Hierarchical ordering of functions and services in terms of settlement size
3 What are lower and higher order centres?
There are more numerous lower order centres (smaller towns) and fewer higher order
centres (large cities). Smaller towns have smaller populations, fewer services, more low
order businesses and smaller ranges. Large cities have large populations and larger
numbers of services, including many high order businesses with large ranges. A
settlement’s position on the hierarchy is determined by the number of functions and not
only by the size of the population.
© Via Afrika Publishers >> Geography 12 Study Guide eBook 110
TOPIC 3
Rural and urban settlement
Unit 6 Urban structure and patterns
1 What are the internal structure and patterns of urban
settlements?
1.1 Land use zones
Urban areas are not random developments, but have internal structure. If you walk
through a town or city you will often find distinct land use zones. Each area (or zone) of
a city has a distinct function, for example housing or industry. A study of land use maps
shows that the different land use types are not distributed in an urban area in an
arbitrary manner or in a disorderly way but in patterns, as Figures 64 and 65 show.
GRID IRON
Advantages: regulated and easy to
easy to control
Disadvantages: many intersections;
traffic congestion; many stop streets
leads to accidents as people become
impatient
The linear shape is the result of the
city being located between two parallel
physical barriers, for instance Paarl that
is between the river and the mountain.
Geometric shapes are found in pre
planned cities and are built like this for
safety reasons.
extend; easy to find your way around and
Advantages: all major roads lead to the
CBD; few intersections and is attractive
Disadvantages: very expensive; streets
block size changes
Everybody wants access to the city centre
and this result in a circular shape. The
city develops around a main point of
attraction for example, church or market.
Figure 64 Street plans (ground plans) in urban areas
RADIAL a
r_ IRREGULAR
Advantages: roads don’t all look the
same and makes area look attractive;
fewer intersections; safer as there are
many crescents and cul-de-sacs
Disadvantages: traffic congestion; easy
to get lost; traffic congestion; easy to get
lost: traffic can become chaotic.
Many cities developed a kind of star
shape with new extensions radiating in
several directions along the transport
routes.
Satellite shaped cities developed when
commuter towns are situated close to
the city. These commuter towns could be
planned or unplanned.
© Via Afrika Publishers >> Geography 12 Study Guide eBook 111
TOPIC 3 Rural and urban settlement
Rural-urban fringe - This is an area in the city
where urban functions gradually invade the
surrounding rural area. There is no definite
division between rural and urban functions.
7X Geqtt? Zone of decay — This lies on the
Cr periphery of the CBD.
‘eC =
Track % S 7
b atig bY ELUNE 5S)
f f
& . Sy in big cities,
CCK f Y/ YY i industries ar
SO an AANA Dy ; the outskirts
aes Z Orlane nancc—se. Commercial -Owingtotraffic gue to pollution
eal recat if congestions inthe streets it (air and noise),
an A theronvilla ues! has become more difficult to transport
5 More Ye eae in eA reach the CBD. This decreased facilities,
ZY L, S UULUUE accessibility of the CBD has
ol é “pf encouraged the migration of pa ie
© = \ x [| functions that used to take Saas
ZG CS Kot Course = place in the city centre, like power and
ote uf > shops, banks, hotels and pester ance
ay
ret
= | Residential area - Residential areas cover the Oto d es
__2 _ largest portion of the total built-up surface of the uy
ra ‘city (between 70% to 80% of the city area). Jo cap thecapis the commercial
: heart of a town or city.
Figure 65 Urban land use shown on topographic map 2828AB BETHLEHEM
1,2 Urban profile
The urban profile shows a cross-section of the city from the CBD to the periphery
(Figure 66). Most urban profiles show a concentration of high buildings surrounded by
low buildings as you move towards less built-up areas. Together these form the
morphological structure of a city.
main railway
station
INDUSTRY AND BUSINESS
new office
and shopping
complex
new industri 7
old city buildings, bus in ‘old housing new industry
c planned on
cathedral, castle: station fA neighbourhood edge of urban
new old industry on i
industry y _ shopping centre area
new low old 4 very fee houses, old housing new
lensity terrace some flats, near city pe i housin:
housing housing centre offices, new high rise Deing cleared 8
developement new high rise
housing
HOUSING AND SHOPPING
CENTRAL BUSINESS DISTRICT
Figure 66 An urban profile is a view of a city as seen from the side.
© Via Afrika Publishers >> Geography 12 Study Guide eBook 112
TOPIC 3 Rural and urban settlement
1.3 What are the factors influencing the morphological structure of
a city
The major factors influencing the morphological structure of a city are various physical
factors, planning and transport.
1.3.4 Physical factors
¢ Relief —- Cape Town developed between Table Mountain and the harbour. The steep
slopes of Table Mountain and the coastline determined the structure of the city.
Pretoria lies between Magaliesberg and Daspoort mountains and has a linear shape.
¢ Microclimate — Local climate also influences the form of an urban area; warmer
north-facing slopes are preferred.
¢ Soil conditions — Fertile soils attract settlement.
1.3.2 Planning
e Planned cities — These cities are planned and are built as one unit and have an
ordered structure and a modern street plan, for example Sasolburg.
¢ No planning — An urban area developed quickly, like in the case of Kimberly, or
sometimes it is an ancient city. The cities have no specific city centre or street
pattern.
e Piecemeal planning — Settlements in which each new suburb may have a different
appearance, but there is evidence of urban planning. Most South African cities are
examples of piecemeal planning.
1.3.3 Transport
Transport plays a vital role in the development of a city’s structure. As transport
systems improved and more people were able to buy cars, the towns became less
compact. People could live away from the city centre and commute to their work places.
Asa result of this, urban sprawl is evident along the transport routes in many cities.
2 Models of urban structure
Urban land use is often explained by models. A model is a simplified theory that
attempts to explain how things work. No model works perfectly but they do help to
explain some of the features of urban structures. There are a number of these models:
the concentric zone model, the sector model, the multiple nuclei model, the modern
American-western city, the Third World city and the South African city.
© Via Afrika Publishers >> Geography 12 Study Guide eBook 113
TOPIC 3
Rural and urban settlement
2.1 The concentric zone, sector and multiple nuclei models
ZONAL MODEL
Central business district
Factory zone
Zone of transition
zone if working men’s homes
Residential zone
Commuter’s zone
Land use is arranged ina series of concentric
rings or zones around the city centre. The
idea is that the city has grown outward in
all directions from the centre, adding new
buildings around the edges. The process is
rather like the annular growth rings of trees. It
means that the urban fabric should get older
towards the centre, The width of the zones
varies according to the density of building.
SECTOR MODEL
Central business district
Wholesale light manufacturing
Low class residential
Medium class residential
High class residential
6e.
Land use is arranged in wedges or sectors
which radiate from the city centre. Growth
follows a linear pattern along major
transport routes or physical features such
as river valleys. We assume that once a
particular type of land use establishes
itself in a area it attracts similar activities
(like industry) and repels dissimilar ones
(like high status housing).
NUCLEI MODEL
a
Central business district
\
e
Wholesale light manufacturing
Low class residential
Medium class residential
High class residential
Heavy manufacturing
Outlying business district
Industrial suburb
Distinctive land uses form small areas
or nuclei such as the central business
district, housing estates, industrial
estates, and office and retail parks.
Often similar activities /types of land use
benefit from being clustered together.
Figure 67 The three main models of urban structure are the concentric zone model, the sector model and the
multiple nuclei model.
2.2 The modern American-western city
The modern American—western city is a type of city that developed as a result of rural-
urban migration and the development of the motor car. Most of its population now
move from the CBD to the suburbs. This causes commercial decentralisation. Unlike the
Third world city, most of the economy generated in the modern American city is in the
formal sector.
2.3 The Third World city
Cities in developing countries tend to develop their own distinctive pattern described by
the Third World city model (Figure 68). This differs in several ways from the land use
model in developed countries. There is rapid growth due to large scale rural-urban
migration and high rates of natural population increase.
© Via Afrika Publishers >> Geography 12 Study Guide eBook 114
TOPIC 3 Rural and urban settlement
Central Business
favelas: recent informal District (CBD)
housing (poor quality, often
self-built housing)
peripheral: older informal housing
(improved over time, more
permanent)
a
(
\
\
(iMate
detached houses \
industry: along
transport routes
Figure 68 Land use zones in LEDCs
2.4 The South African city
The South African city model is unique and —
has a different set of characteristics from
those of other countries in the world.
Apartheid policies and laws like the Group
Areas Act produced an unnatural system of
urban land use in cities. The Group Areas Act
divided South African cities into racial areas
bufferzone ee
= physical border
(Figure 69). It was illegal for designated yf ;
groups to live or own land in certain areas. > mace
Black people were forcibly removed from
their homes into outlying townships. With the ee = 1. 2 “enone
democratic elections of 1994 the landscape of Asianfeslowed wou ates aie
the South African cities started to change. ae a ‘tgunds tr
Now all people can reside in any area
. . . wae . Figure 69 Model of a South African apartheid city
irrespective of their racial identity.
© Via Afrika Publishers >> Geography 12 Sludy Guide eBook 115
TOPIC 3 Rural and urban settlement
3 Changing urban patterns and land use in South African
cities
3.1 Changes in the CBD
As a City’s size increases, the CBD grows and becomes progressively differentiated into
land use subzones (for instance, retailing, finance, administration, entertainment).
Dynamic change in the CBD is constant, through extension, replacement and
regeneration. The CBD expands into the surrounding area of old homes and service
industries occupying these old homes — the zone of transition. This is known as the
principle of invasion and succession.
3.2 Urban retailing
The CBD used to be the most important retail area and most employers favoured this
land use zone. In time, the CBD and the suburbs became more divided, resulting in
commercial decentralisation. Neighbourhood shopping centres were established in the
suburbs. The major forces causing this change were the following:
¢ increase in urban populations
e the centrifugal expansion of suburbs
e changes in shopping habits and greater mobility.
3.3 Residential changes in South Africa
When buildings in a city are unsuitable for use in the present time, often they are not
demolished completely. Instead, the front structure of the building is retained and new
structures are built behind the original facade. This allows the old city structure to exist
while the building is improved. The process is known as facadism. Sometimes old
houses that are close to the city are improved and modernised. This is called
gentrification.
© Via Afrika Publishers >> Geography 12 Study Guide eBook 116
TOPIC 3 Rural and urban settlement
Unit 7 Urban settlement issues
1 Recent urbanisation patterns in South Africa
There is a change in the demographic profile of South African cities. Cities attract
skilled workers and increasing numbers of the youth who make up most of those who
are unskilled, economically inactive and in search of employment. A corresponding
change is taking place in rural areas. These areas are mostly former homelands, with
limited economic activity. They are characterised by outward migration and a decline in
the young population.
The CBDs in South Africa have also seen changes with new shopping centres and
altered transport projects, for example the Gautrain and Bus Rapid Transport in big
cities. The CBDs have changed because of the decline in the number of people visiting
the city centre. Many shops have moved to suburban shopping centres that are further
away. People avoid traffic congestion and air pollution.
There also has been competition to use the land on the rural-urban fringe. The main
reasons for this are that at the rural-urban fringe land is less expensive, there is less
traffic congestion and air pollution, and the environment is relatively unspoilt. In South
Africa we have seen a number of office developments and high technology business
parks developing on the rural-urban fringe.
2 What are the issues related to rapid urbanisation?
It is very important to plan for the future of urban growth. In South Africa about 60% of
the population is urbanised. With rapid ongoing urbanisation and expansion of cities
urban areas are experiencing a greater demand for employment, basic services and
infrastructure. These problems get worse as the city grows and are often worse in the
CBD.
2.1 Lack of planning
Lack of planning can lead to unhindered growth of cities, or urban sprawl. Urban
sprawl can occurs when there are no laws to control what and where people can build,
such as in South Africa’s informal settlements.
© Via Afrika Publishers >> Geography 12 Study Guide eBook 117
TOPIC 3 Rural and urban settlement
2.2 Housing shortages
One of the major challenges that urban municipalities face is providing housing for
existing and growing urban populations. The constitution of South Africa says that
everyone has the right to have access to adequate housing. Despite having delivered
about 220 000 houses a year, South Africa continues to face a major challenge in
providing affordable accommodation in sustainable settlements. A shortage of housing
means many people have no alternative but to live in informal settlements.
2.3 Overcrowding
Overcrowding is one of the major problems for most urban areas. Urban areas are not
ready to accommodate all the people migrating from the rural areas and some from
neighbouring countries. Some of the migrants into the cities are not skilled enough to
be employed in the formal sector and find it difficult to get employment.
2.4 Traffic congestion
Large cities invariably suffer from congestion on roads. All kinds of conveyances — cars,
buses, trams, trucks, trains, motor cycles and bicycles — use the transport network and
slow down movement. This is particularly serious during the rush hour.
2.5 Problems with service provision
South African cities face a problem of service provision. The greatest demand for
services and infrastructure is mainly at the former low-income residential areas and
informal settlements that lack clean drinking water, electricity, healthcare facilities,
sanitation, solid waste disposal, housing and safe, reliable and affordable transport
systems.
3 Growth of informal settlements and associated issues
A major problem in African cities is the inability of the governments to provide
adequate and affordable housing. The majority of residents do not have access to
formal housing and related amenities, and generally live in informal settlements
without service provision. Informal settlements are not planned therefore lack services.
© Via Afrika Publishers >> Geography 12 Study Guide eBook 118
TOPIC 3 Rural and urban settlement
4 How are urban areas in South Africa managing urban
challenges?
Urban settlements in South Africa are not static, they change over time. As South
African cities have a history of apartheid, there now is rapid urbanisation and some
urban settlements have been planned on new sites. Such cities are called ‘new towns’.
New towns are urban settlements planned and built to ease the housing shortage in
existing towns and cities. New towns include garden cities, edge cities and green helt
cities. In these settlements all aspects of development are determined before
construction begins. The ultimate aim is to provide not only access to services and
amenities, but also to achieve environmental, economic and social justice and
individuals and communities.
© Via Afrika Publishers >> Geography 12 Study Guide eBook 119
TOPIC 3 Rural and urban settlement
Questions
Question1
|
Provide the best answer to the following multiple choice questions.
11 In rural areas the failure of industrialisation and the modernisation of
agricultural practices has led to...
A voluntary resettlement
B rural-urban migration
Cc basic need philosophy
D formal resettlement
push-pull factors
1.2 What are the advantages of nucleated rural settlement?
economic
political
can make farming easier
social
all of these
1.3 settlement is classified as rural on the basis of ...
the distance from a large town
the number of people living in it
the main function of its inhabitants
the size of the settlement
mPoowprrmoenw Pp
none of these
1.4 What is the main difference between rural and urban settlements?
A rural settlements are multi-functional while urban settlements are uni-
functional
B rural settlements consist of people engaged in primary activities while
urban settlements consist of people engaged in secondary and tertiary
activities
Cc urban settlements are larger than rural
D rural settlements are found in the country
© Via Afrika Publishers >> Geography 12 Sludy Guide eBook 120
TOPIC 3 Rural and urban settlement
1.5 Which of the following is the most important cause of rural depopulation?
A
B
Cc
D
E
push and pull factors that cause growth in urban areas
lack of employment chances
lack of good schooling in the rural areas
the ‘bright lights' of the city life
less medical care in the rural areas
1.6 Many factors have encouraged rural-urban migration in South Africa. Identify
one push and pull factor in this rapid urbanisation process.
A
B
Cc
D
E
employment opportunities and migrant labour
squatting and migrant labour
economic advancement and employment opportunities
the dislike of the traditional rural life and the 'bright lights' of the city
none of the alternatives
1.7 What two important events helped urban development?
ed
0 ao DW
the agricultural and industrial revolutions
urban growth and democratic government
uneven rural growth and population migrations
counter-urbanisation and metropolitan expansion
droughts and lack of birth control in the rural areas
1.8 Which of these statements is true?
A The development of new shopping centres has mainly occurred in the
CBD.
The development of new industry has been in the rural-urban fringe.
Cc The development of new industry has been in the CBD.
D The development of new industry has been away from major transport
links.
E No development occurs in the transition zone.
1.9 Inthe Burgess' model of urban land use the middle class residential area is
located ...
A in the centre
moo Ww
near the wholesaling and light manufacture
near the industrial areas
between the working class and upper class
in either B or C
© Via Afrika Publishers >> Geography 12 Study Guide eBook 121
TOPIC 3 Rural and urban settlement
1.10 The urban land use model that divides a city into 'slices' radiating out from the
CBD is called the ...
A concentric zone model
B bid-rent model
Cc multiple nuclei model
D sector model
E apartheid model
1.11. What does the term gentrification mean?
A the conversion of lower income neighbourhoods into more upscale
communities
B people moving from the inner city to townships located on the edge of
the city
Cc migrating from rural to urban areas
D wealthy middle class people moving into the inner city and redeveloping
the housing
E AandD
1.12. When planning for a better environment in a city what two factors need to be
taken into consideration?
A
moa ww
traffic and pollution
rural-urban migration and traffic
traffic and over-population
urban expansion and waste disposal
traffic and the zone of transition
1.13. Improved means of transport have rapidly altered the city. What effects has
better transport had on these cities?
A
B
Cc
skyscrapers, growth of suburbs, large city populations and pollution
skyscrapers, multi-centred urban structures, renewal of the city centre
skyscrapers, increase in population of the city centre, residential
segregation
depopulation of the city centre, post-modern urban centres, residential
segregation, decentralisation of functions
skyscrapers, centripetal forces, depopulation of the city centre
15x2=(26)
© Via Afrika Publishers >> Geography 12 Study Guide eBook 122
TOPIC 3
Question 2
Rural and urban settlement
Provide the best description for each of the terms by matching the columns.
2.1 Bridge point A This attracts households and businesses towards the centre
of the city
2.2 Central Business District B Roads running parallel to each other with others crossing at
right angles
2.3 Central place c Also called low order goods
2.4 Centrifugal force D A basic framework of roads, power, water supplies and
schools and hospitals
2.5 Centriptal force E Awaterway crossing point and important in locating
settlements
2.6 Commuter F Asystem of grading the various types of settlement
according to size
2.7 Convenience goods G A point in a network where routes meet or intersect
2.8 Functions H The area between the built up town and countryside
2.9 Green belt | Selling good, usually from a shop
2.10 | Hierarchy of settlements J The minimum number of people in a region required to
support a particular shop or service
2.11 Grid pattern K A person who travels (often some distance) daily from home
to place of work in a large city
2.12 | Infrastructure L The central part of a town or city, which is likely to contain
many offices and business headquarters
2.13 | Node M This pushes households and businesses away from
congested , polluted, high density and expensive inner-city
areas.
2.14 | Retailing N The area around a shop, settlement or central place which is
affected by the goods and services on offer
2.15 | Ribbon development (e) Urban expansion along roads
2.16 | Rural-urban fringe P Deterioration especially of the older parts of the town
2.17. | Sphere of influence Q The physical spread of a town in an unplanned, sometimes
disorderly manner
2.18 | Threshold population R Provides goods and services to that rural area
2.19 | Urban decay s The general appearance and the major landmarks of an urban
skyline
2.20 | Urban profile T The services, amenities and goods available in a settlement
2.21 | Urban sprawl U An area of rural land surrounding an urban area
21x2=(42)
© Via Afrika Publishers >> Geography 12 Study Guide eBook 123
TOPIC 3 Rural and urban settlement
Question 3
Study Figure 1 showing rural settlement in KwaZulu-Natal and answer the questions
that follow.
Figure 1 A rural settlement in KwaZulu-Natal
3.1 State why this settlement is classified as a nucleated rural settlement. — 2x2=(4)
3.2. Many of the young men in this area have moved to the cities of Pietermaritzburg
and Durban.
3.2.1 State the name of this movement. 1x2=(2)
3.2.2. Describe three push and three pull factors that might have caused the
young men to move. 6x2=(12)
3.2.3. Describe three barriers the young men might have met in their move to
the city. 3x2=(6)
3.3. There are advantages and disadvantages of living in a nucleated rural
settlement.
3.3.1 Describe three social advantages. 3x2=(6)
3.3.2. Describe three economic disadvantages. 3x2=(6)
(36)
Question 4
‘There are distinct similarities between remote rural areas and inner cities: a decreased
demand for labour, unemployment, low wages, a lack of skills, a decline in services,
limited new investment, a high dependency ratio, dereliction, blight and a high cost of
public services.’
© Via Afrika Publishers >> Geography 12 Sludy Guide eBook 124
TOPIC 3 Rural and urban settlement
Write an essay of approximately ONE page in which you evaluate the validity of the
statement above. 10x2=(20)
TOTAL MARKS [124]
© Via Afrika Publishers >> Geography 12 Study Guide eBook 125
TOPIC 4 Economic geography of South Africa
Topic 4 Economic geography of South
Africa
Unit 1 Structure of the economy
1 What are economic sectors?
1,1 The primary sector
The economy of the country is made up of a number of economic sectors. The primary
sector extracts or harvests products from the Earth or the sea. This includes farming,
forestry, fishing, mining and quarrying.
1,2 The secondary sector
The secondary sector manufactures finished goods from products produced in the
primary sector. All manufacturing, processing and construction lie within the
secondary sector. Activities associated with the secondary sector include metal
working, engineering, food processing, textile production and the chemical industries.
1.3 The tertiary sector
The tertiary sector of the economy is the service industry sector, providing services to
the general population and businesses. Activities associated with this sector include
retail and wholesale sales, transportation and distribution, entertainment, restaurants,
tourism, insurance, banking, healthcare, and law.
1.4 The quaternary sector
Quaternary sector activities provide information and expertise with an emphasis on
information and computer technology. It includes data processing, use of geographical
information systems (GIS), consulting and research. It is a very small sector and is often
included in the tertiary sector.
1.5 An example of how the sectors are linked
e A farmer produces wool from sheep — primary activity.
e The factory makes the wool into a jersey — secondary activity.
© Via Afrika Publishers >> Geography 12 Study Guide eBook 129
TOPIC 4 Economic geography of South Africa
e The factory uses the railways to transport the jerseys to the shop and the shop sells
the jersey to a consumer. The shop uses a bank and its premises and stocks are
insured. These are all tertiary activities.
¢ The shop employs a computer company to use a geographic information system
(GIS) to determine the range of goods and location of competitors. This is a
quaternary activity.
2 What are the economic sectors’ contributions to the
South African economy?
2.1 The gross domestic product (GDP)
The gross domestic product (GDP) is one of the main indicators used to measure the size
of a country’s economy. It represents the total value of all goods and services produced
over a specific period.
2.2 GDP and development
If a country is highly developed, only a small proportion of the population is employed
in the primary sector, considerably more people are active in the secondary sector,
while the majority are involved in the tertiary sector. In developing countries the
economically active population is engaged mainly in primary activities, while a smaller
percentage of the workforce is employed in tertiary and quaternary activities.
2.3 The changing nature of South Africa’s economy
Figure 70 shows how South Africa’s
economy has changed in the last 100
years, from a less economically
developed country to one that is now
more highly developed. A greater
proportion of the economically active
population is employed in the tertiary
sector, and proportionally fewer people
are employed in the primary sector. piideeracirites
tertiary activities
1910 1920. 1930 1940-1950 1960 1970 1980 1990 20002010
Figure 70 The changing percentage contribution of the economic sectors to South Africa's GDP
© Via Afrika Publishers >> Geography 12 Study Guide eBook 130
TOPIC 4 Economic geography of South Africa
3 How can we use graphical and statistical information
about the economy?
Graphs of employment in various sectors through time (like Figures 70 and 71) can be
used to study comparative levels of development and economic growth.
Primary 10,7%
Primary 7%
Total employment 12 336 000 ve
2001
Total employment 12 975 000
2011
Figure 71 Comparison of employment by sector in the South African economy: 2001 and 2011
© Via Afrika Publishers >> Geography 12 Sludy Guide eBook 131
TOPIC 4 Economic geography of South Africa
Unit 2 Agriculture
1 What is the contribution of agriculture to the South
African economy?
Agriculture contributes a small and declining share to South Africa’s GDP. Agriculture
is an important economic sector because it provides income and food for the
population. Agriculture is a significant provider of jobs, especially in the rural areas,
and a major earner of foreign exchange. South Africa exports more food than it imports.
The contribution of agriculture to the economy consists mainly of four factors:
¢ direct contributions to gross domestic product (GDP)
¢ supply of food to the population
¢ contributions to the country’s balance of trade
¢ employment of workers.
Figure 70 shows the steady decline of agriculture’s contribution to the South Africa’s
GDP, from 15% in 1955 to 2,4% in 2010. This does not mean that agriculture is
decreasing in importance. It means that the other sectors, especially the tertiary sector,
are growing faster than the agricultural sector.
© animal production
80 000---~--- M horticulture --~--~--~~----~--~-~-~~-~~~~-~----~------
© field crops
Value of agricultural production 2007-2011 (R million)
2007 2008 2009 2010 2011
Figure 72 The value of agricultural production: 2007-2011. Field crops are mainly maize and wheat. Horticultural
products consist of fruit, vegetables and flowers. Animal products are mainly cattle, sheep and chickens.
© Via Afrika Publishers >> Geography 12 Sludy Guide eBook 132
TOPIC 4 Economic geography of South Africa
1.1 Direct contribution of agriculture to the gross domestic product
In 2011 the contribution of agriculture to the GDP was approximately R64 billion. The
agricultural sector has grown by an average of 12% per year since 1970, while the total
economy has grown by 15% per year over the same period. This resulted in agriculture’s
share of the GDP dropping from 8% in 1970 to 2,4% in 2010.
1,2 Supply of food to the population
South Africa is one of the few countries in which agriculture is able to supply enough
food for the population, although food prices are rising quickly. South Africa produces
more than is needed for domestic consumption.
1,3 Contribution to the country’s balance of trade
Normally about 25% of South Africa’s field crop production and 34% of horticultural
(fruit and vegetables) production is exported. Almost the whole wool clip is exported.
About half the exports are in processed form and agricultural exports are about 10% of
South Africa’s total exports.
1.4 Employment
Employment in agriculture reached its peak in 1971, when 1639 000 people worked on
commercial farms. Since then, like most agricultural countries, in South Africa
machines have replaced human labour in many processes. The agricultural
employment figure in 2011 dropped to 406 000 — a loss of over 1,2 million workers. The
development of more and better machines and larger farms to use them on contributed
to this.
2 What are the roles of small-scale and large-scale
farmers?
2.1 Large-scale commercial farming
Large-scale farming is the production of crops for sale in retail outlets such as shops. In
commercial farming crops such as wheat, maize, sugar cane, fruit, vegetables and meat
are sold all over South Africa and on world markets. The main objective of commercial
farming is to make a profit.
© Via Afrika Publishers >> Geography 12 Study Guide eBook 133
TOPIC 4 Economic geography of South Africa
2.2 Small-scale subsistence farming
Subsistence farming is a form of small-scale farming, usually intensive, in which nearly
all of the crops or livestock raised are used to maintain the farmer and the farmer’s
family, leaving little, if any, surplus for sale. The work is usually done by family
members, often women, children and the elderly.
3 What are the main products produced for home and
export markets?
Pe
-——j Maize oe
VZZ, Sugar oy \
or 4
{[[]]{) Wheat fo
Citrus fruit - Cc
(iby Deciduous fruit =>, ; ere *
iia Sub-tropical fruit ~. By SS Ne & |
——S ian!
= 7
\, ae
— a J
a.
Figure 73 The location of the main crop and fruit producing areas in South Africa
3.1 Maize
Maize is the country’s most important crop. It is the basic food for many people, it is
used as a livestock feed, and is an important crop for both the home market and the
export market. Maize is grown commercially on many farms, mainly in North-West,
Mpumalanga, Free State and KwaZulu-Natal, where there is summer rainfall of at least
500 mm per annum.
© Via Afrika Publishers >> Geography 12 Study Guide eBook 134
TOPIC 4 Economic geography of South Africa
3.1.1 The importance of maize to South Africa
¢ Maize is an important part of the South African diet.
© Maize is also eaten indirectly through its use as an animal feed in chicken, cattle
and pig farming.
e Itis used in the production of food products such as beer, cheese spreads, instant
coffee and many others.
¢ It provides direct employment to about 20 000 people and their families.
¢ It consumes products from other industries, such as fertiliser, irrigation equipment,
herbicides, fuel and farm implements.
e It earns valuable foreign exchange.
¢ It provides the staple starch for millions of people depending on subsistence
farming.
3.1.2 Trade balance
The quantity of maize produced varies from year to year. In good years maize is
exported. It is imported in years when the rainfall is low.
3.2 Wheat
South Africa’s annual wheat production has remained more or less steady since the
19708, ranging from about 1,5 to 2 million tons. The winter rainfall areas of the Western
Cape and the eastern Free State with late summer and early summer rainfall produce
nearly all of South Africa’s wheat. Most of the wheat is grown on highly mechanised,
large-scale, commercial farms.
3.2.1 The importance of wheat to South Africa.
As urbanisation increases bread consumption rises. Migrants to the city cannot grow
maize as they can in the rural areas and bread takes the place of maize in the city. All
our bread and pasta is made from wheat, so it is a very important crop. Wheat farmers
employ about 25 000 workers and buy fuel, fertiliser, machinery and seed. Recently
South Africa has been importing wheat.
3.3 Sugar cane
Sugar cane is grown by 35 300 large-scale and small-scale farmers in the wetter areas of
KwaZulu-Natal and southern Mpumalanga lowveld. More than 33 000 are small scale
growers producing nearly 10% of the total crop. With the growth of economic
development and empowerment of previously disadvantaged people, the participation
of black farmers in sugar cane production is increasing constantly.
© Via Afrika Publishers >> Geography 12 Study Guide eBook 135
TOPIC 4 Economic geography of South Africa
3.3.1 Exports
Sugar is a major export crop. No sugar is imported and the value of exports is about
R1-2 billion annually.
3.4 Fruit
Fruit is grown all over South Africa where there is enough rainfall or irrigation water is
available. South Africa is the third largest exporter of oranges after Spain and the USA.
¢ Sub-tropical fruit such as bananas, mangoes and avocado pears are grown in the
warmer regions of KwaZulu-Natal, Mpumalanga and Limpopo.
¢ Citrus fruit such as oranges and grapefruit are important in the Western Cape,
Eastern Cape and Limpopo.
¢ Deciduous fruits such as apples, peaches and grapes are grown all over the country
but mainly in the Western Cape.
3.5 Animal products
Poultry, mainly chickens, is our largest single agricultural product. They are reared
near all the main towns. Sheep, for wool and mutton, are kept in the drier, western half
of the country. Beef cattle are ranched in the better-watered eastern parts of South
Africa. Dairy cattle are reared near the main urban centres.
3.6 Import and export of agricultural products
Table 17 shows our main agricultural imports and exports.
Table 17 South African imports and exports of agricultural products - 2011
Exports Imports
Citrus fruit — R7 coo million Wheat — Rg 300 million
Maize — R6 000 million Rice — R3 700 million
Wine —- Rs 500 million Palm oil—R3 000 million
Grapes — R3 400 million Poultry meat — R2 700 million
Apples — R3 000 million Soya bean oil— R2700 million
Total exports R50 000 million Total imports R45 000 million
© Via Afrika Publishers >> Geography 12 Study Guide eBook 136
TOPIC 4 Economic geography of South Africa
4 What are the factors that favour and hinder agriculture in
South Africa?
4.1 Favourable factors
¢ Climate: South Africa has a range of climates making it possible for many different
crops to be grown.
¢ Trade: Trade with other countries has benefited our farmers.
¢ Tradition: There has been a long tradition of agriculture in South Africa and some
of our farmers are amongst the best in the world.
e Land ownership: Most of our commercial farmers own their land, which makes it
easy for them to get agricultural development.
4.2 Hindering factors
¢ Climate: Three-quarters of South Africa has below 500 mm of rainfall annually. This
is the minimum for successful crop growing.
¢ Soils: Many of South Africa’s soils are infertile and large parts of the country are too
steep for crop growing. South Africa has one of the worst soil erosion problems in
the world.
e Trade: Many countries including USA, China and European Union countries
subsidise production of their farm products making it too expensive to sell food to
these countries.
e Land ownership: Apartheid laws meant that black people were not allowed to own
farms in most of the productive areas. This is only slowly being reversed.
5 The importance of food security in South Africa
Food security exists when all people at all times have access to sufficient, safe,
nutritious food to maintain a healthy and active life. Access to food is vital since it is
essential to well-being and human development.
5.1 Factors influencing food security
¢ Droughts and floods: Adverse weather raises the price of food in the shops for all
consumers, but the poor, at or below the poverty line, are the most affected.
¢ Economic problems: South Africa has struggled to create job opportunities to allow
people to live above the poverty line.
© Via Afrika Publishers >> Geography 12 Study Guide eBook 137
TOPIC 4 Economic geography of South Africa
¢ Mismanagement and poor governance: Money that should go towards job
creation and agricultural development often has been stolen by corrupt people.
e HIV and Aids: This is of concern because of the negative effects on the people
involved in agricultural production.
¢ Poverty: People without money cannot buy food.
Population growth: More people means less land to grow food on and existing land
is over-utilised.
© Via Afrika Publishers >> Geography 12 Study Guide eBook 138
TOPIC 4 Economic geography of South Africa
Unit 3 Mining
1 What is the contribution of mining to the South African
economy?
South Africa is the world’s biggest producer of platinum, and one of the leading
producers of gold, diamonds, base metals and coal. South Africa holds the world’s
largest natural reserves of gold, platinum-group metals (or pgms), chrome and
manganese, and the second-largest reserves of zirconium, vanadium and titanium.
Even though the relative contribution of mining to South Africa’s gross domestic
product has declined over the past 20 years mining remains a cornerstone of the
economy. This can be seen in Figure 74.
%
20
> % contribution to the GDP
e
15 = -
™S
10 Ms
a =
5
1941 1951 1961 1971 1981 1991 2001 2011
Figure 74 The percentage contribution of mining to the GDP 1941-2011
© Via Afrika Publishers >> Geography 12 Study Guide eBook 139
TOPIC 4 Economic geography of South Africa
2 What is the significance of mining to the development of
South Africa?
Exports - 2011 value
of mining exports was Cities - Cities have
over R224, billion, over developed in the
about <Ebo poomeeple Gay ol Sanh Aca 'S mining bi ag
work on the mines. With 8 or acta bicep AL
Gauteng and Free
10 dependants each, about
4 0r5 million people
depended on their R75
billion wages in 2011.
State.
Eskom and Sasol - Coal generates
over 90% of South Africa’s
=< electricity. Sasol produces 30% of
our liquid fuels such as petrol. Much
Manufacturing Que of our plastic is made from coal.
minerals provide the raw
materials for the important
manufacturing industry.
Many factories provide
equipment for the mines, Technology - Deep mining is a difficult
and dangerous job. Advanced
technology has been developed in
South Africa to minimise these risks.
Infrastructure - The income from mining
Taxes - The
has funded the development of South mines pay large
Africa’s infrastructure such as roads, amounts of tax,
railways and harbours. Ports at Richards
Bay (coal) and Saldanha Bay (iron ore)
were built especially to handle
mineral exports.
which helps the
development of
the country.
Figure 75 Mining has contributed hugely to the growth of South Africa and remains a very important contributor
to employment and the economy.
3 What are the factors that favour and hinder mining in
South Africa?
3.1 Factors favouring mining
¢ Power: The discovery of coal in Mpumalanga near the gold fields made cheap
electricity available for the nearby mines.
¢ Labour: There are many unskilled and semi-skilled workers in South Africa.
¢ Technology: South African mines are some of the most technologically advanced in
the world.
e Raw materials: South Africa has a wide range of minerals and is the world’s leading
producer of platinum, chrome and manganese.
© Via Afrika Publishers >> Geography 12 Study Guide eBook 140
TOPIC 4 Economic geography of South Africa
Infrastructure: An advanced network of roads, railways and harbours services the
mines.
Government: The government has always encouraged mining and is now assisting
small-scale independent and previously disadvantaged miners.
Markets: There are ready markets for our minerals both in South Africa and
overseas.
3.2 Factors hindering mining
Distances: Many of our minerals are found far from the coast.
Dependence on foreign markets: 85% of our minerals are exported and thus we
are dependent on foreign governments and companies for sales.
Water: Water is a problem in a number of ways. Underground water is expensive to
remove. The mines use a lot of water in the mining operation and in processing.
Acid mine drainage: This is the flow of polluted water from old mining areas.
Pollution: Apart from the pollution of water, mines often pollute the environment
with dust and visually in the form of mine dumps.
Climate: Some mining areas, such as those in the Northern Cape have very hot
climates, making life uncomfortable.
Fluctuating market prices: With recent low prices some mines have had to close.
© Via Afrika Publishers >> Geography 12 Study Guide eBook 141
TOPIC 4 Economic geography of South Africa
Unit 4 Secondary and tertiary sectors
1 What is the contribution of the secondary and tertiary
sectors to the South African economy?
Since the early 1990s the country’s economic growth has been driven mainly by the
tertiary sector. In this period the tertiary sector’s share of the GDP rose from 55% to its
present 77% while that of manufacturing dropped from 28% to the present 14%.
2.1 Heavy industry
Heavy industry is the large-scale production of goods sold to other industrial customers
rather than to the end consumer. Examples of heavy industry include chemicals, steel
manufacture, oil refining.
2.2 Light industry
Light industry needs less capital than heavy industry. It is produced for the end user
rather than for other industries. Examples of light industries include the manufacture of
clothes and furniture.
2.3 Raw material oriented industries
Raw materials are the materials used to make a finished product. Where the raw
materials are bulky or difficult to transport the raw material orientated industries must
be located near the source of the raw material.
2.4 Market oriented industries
Market orientated industries produce goods that must be produced near the consumer.
2.5 Footloose industries
Footloose industries have a free choice of location.
2.6 Ubiquitous industries
Ubiquitous industries are not tied to specific sources of raw materials or specific
markets. They are located everywhere.
© Via Afrika Publishers >> Geography 12 Study Guide eBook 142
TOPIC 4 Economic geography of South Africa
2.7 Bridge industries or break of bulk point industries
Bridge industries, also called break of bulk point industries, transfer cargo to smaller
units of transport. A bridge industry also occurs when imported raw material can be
unloaded directly into the processing plant without further transport costs.
3 What are the factors influencing industrial development
in South Africa
3.1 Energy
Factories need electricity and some factories have an agreement with ESKOM to buy
electricity cheaply. Examples are the aluminium refineries in Richards Bay, each of
which uses as much electricity as a large city.
3.2 Raw materials
South Africa has large quantities of primary industrial raw materials (like iron, coal,
chrome, manganese, copper) while agriculture, forestry and fishing provide other
important raw materials.
3.3 Labour supply
Labour supply is necessary for industry. Industries producing specialised goods tend to
be located where skilled labour is concentrated.
3.4 Transport infrastructure
An efficient transport infrastructure is necessary for bringing in raw materials and
distributing manufactured products. South Africa has a good network of roads,
harbours and railways to support industry.
3.5 Political intervention
Political intervention in the form of government decisions has a major impact on factory
location. The introduction of Industrial Development Zones (IDZs) and Spatial
Development Initiatives (SDIs) has encouraged industries to develop in certain areas.
© Via Afrika Publishers >> Geography 12 Study Guide eBook 143
TOPIC 4 Economic geography of South Africa
3.6 Competition and trade
Compared with the large markets of Europe and Asia, South African markets are small.
The competition from firms in these areas, especially China means items such shoes
and clothing can be sold at a lower price than they cost to make in South Africa.
4 South Africa’s industrial regions
SOS ae | Port Elizabeth-Uitenhage
| eT South-western Cape
Durban—Pinetown
4o-——
Figure 76 Percentage of industrial output of the main industrial regions of South Africa. The remaining 20% is
located in other cities and towns of South Africa.
4.1 Manufacturing in Gauteng
The area extending from Pretoria to Sasolburg and from Brakpan to Randfontein, also
known as the PWV, is Africa’s most important industrial region.
© Via Afrika Publishers >> Geography 12 Sludy Guide eBook 144
TOPIC 4 Economic geography of South Africa
TS
ee i S$ \, A. oe
Mamelodi ~
. Ly
NORTH WEST eG L
—an Mas © Centurion prorhortsph
Midrand Oy
/ Krugersdorp, @ Kempton ply
Johannesburg Boron l
Randfontein” || . eh ee
Soweto® A Germiston a
Carlstonville Alberton aes
a
a Heidelberg
\ Meyerton » e rh
een ?
fanderbijlpark@ — @ Vereeniging
gO oar Fea aneR
Ya @ Sasolburg ae
i iA )
|. / \ FREE STATE =:
y Sa
Figure 77 The PWV in Gauteng is Africa’s most important industrial area.
© Via Afrika Publishers >> Geography 12 Sludy Guide eBook 145
TOPIC 4 Economic geography of South Africa
4.1.1 The factors influencing the location of industry
Raw materials: Gold provided the initial stimulus for development of industry and
industries arose to provide the mines with mining equipment. Other minerals and
agricultural products all stimulate industrial growth.
Labour supply: With jobs available in the manufacturing sector people from all
over the world came to the area.
Markets: Gauteng has the highest per capita GDP in South Africa and provides a
large market for industrial products.
Power: The huge power stations of Mpumalanga are close by.
Transport: Gauteng is very well-served with road, rail and air links. The big
disadvantage is that it has no port.
Political intervention: The Gauteng Economic Development Agency (GEDA) has
been developed by the Gauteng government to promote economic growth and
development.
4.1.2 Factors limiting industrial expansion
The lack ofa
harbour has meant ; ‘
1
aan eaen Factors limiting
industries are seeking industrial
port locations to reduce expansion
transport costs.
Roads in the area are
reaching congestion
and expensive highways
have to be built.
Figure 78 Factors limiting industrial expansion in Gauteng
© Via Afrika Publishers >> Geography 12 Sludy Guide eBook 146
TOPIC 4 Economic geography of South Africa
4.1.3 Main industrial activities
Gauteng is the main centre of South Africa’s industrial activity. The region produces a
wide range of products such as iron and steel, metal products, food, machinery,
electrical appliances, vehicle parts and accessories and chemicals.
4.2 Manufacturing in the Durban—Pinetown area
This area is the second most important industrial area in South Africa.
4.2.1 The factors influencing the location of industry
Durban’s harbour is the busiest in the country. The population of greater Durban is over
3,5 million which supplies labour and markets. With its high rainfall the area has many
agricultural raw materials, especially sugar and timber. Apart from the port, the area is
well-served by road, rail and air.
4.2.2 Main industrial activities
Durban has a wide range of industries. Because of its harbour location many are break
of bulk. Food processing is one of the oldest industries. Sugar refining and timber
processing are also important. The Toyota motor assembly plant employs 8 000 people
and produces over 200 000 vehicles per year.
4.3 Manufacturing in the South-western Cape
The southern part of Western Cape is South Africa’s oldest industrial area and produces
a wide variety of goods, especially food products and textiles.
4.3.1 The factors influencing the location of industry
Cape Town was the first European-style city in South Africa and industry grew to meet
the demands of its inhabitants. These industries have remained there even though
other factors suggest that for some of them a new location would he beneficial. This
reluctance to move is due to industrial inertia. The region has over 3,5 million
inhabitants and their skill levels are among the highest in South Africa
4.3.2 Main industrial activities
e Fruit is processed into canned fruit, fruit juices and wines in Cape Town and the
surrounding small towns.
e The largest manufacturing industry in the province is the clothing and textile
industry. This is presently declining in importance, due to competition from cheaper
Eastern producers, such as China and Vietnam.
¢ The cold waters of the Benguela current provide food for the abundance of fish in
© Via Afrika Publishers >> Geography 12 Study Guide eBook 147
TOPIC 4 Economic geography of South Africa
the sea around the Western Cape. The fish are canned and packed in Cape Town and
in the many small towns along the Western Cape coast.
e High-tech industries are growing in importance and are taking the place of the
declining textile and clothing industry.
¢ Iron and steel are important products. Saldanha Bay, 100 km north of Cape Town, is
the terminus of the railway line that carries iron and manganese from Sishen in
Northern Cape. A steel manufacturing plant has been built at Saldanha Bay.
4.4 Manufacturing in the Port Elizabeth-Uitenhage area
This is the smallest of South Africa’s main industrial regions, with 8% of South Africa’s
industrial output. It is known for the production of motor vehicles and the associated
industries.
4.4.1 The factors influencing the location of industry
The port location has been the main attraction for industries in this area. The new deep
water port at Coega, 20 km north of Port Elizabeth, will encourage further development
in the area. The area has many agricultural raw materials.
4.4.2 Factors limiting industrial expansion
The supply of water is a problem and additional water is obtained from the Orange
River via the Orange—Fish-Sundays link tunnels and canals. The lack of minerals in
the hinterland is another limiting factor.
4.4.3 Main industrial activities
Textiles and leather goods: These are made using leather from the cattle and wool from
the sheep in the hinterland.
Motor vehicles: General Motors and Ford started assembling motor cars at Port
Elizabeth nearly 90 years ago. Volkswagen built an assembly plant at Uitenhage in
1947. The area was chosen for its centrally located port so the finished vehicles made
from imported parts could be sent easily to the rest of the country. Most other industries
in the area provide accessories such as tyres, batteries and windscreens.
© Via Afrika Publishers >> Geography 12 Study Guide eBook 148
TOPIC 4 Economic geography of South Africa
Unit 5 Strategies for industrial
development
1 Apartheid and post-apartheid industrial development
strategies
1,1 Apartheid strategy — border industries
The policy of apartheid meant that South Africa was to be a ‘white’ republic in which
black people did not feature as citizens. This ‘bantustan’ policy sought to place all black
Africans in a ‘homeland’ according to their ethnic identity. Ten homelands were created
(Figure 79).
(9 Bophuthaswana ZIMBABWE
Ciskei a =
(99 Gazankulu =
KeNgwane BOTSWANA g
1 Kwandebele FS
9 KwaZulu 2
MBE Lebowa =
EB Qwaqwa a
ll Transkei Fé
MB Venda {
Transvaal
L SWAZILAN
NAMIBIA é
Orange |
i Free State }
% Py r
\ t “Natal
\ LEsoTHo ee
N Cape Province aan
\ a
a ’
in —_ =
—
Figure 79 The former ‘homelands’ in South Africa. Note the different provinces.
These homelands had very few job opportunities and the concept of border industries
was introduced. Incentives were offered in order to encourage industrialists to invest in
growth points which bordered the homelands. These incentives included tax
concessions, labour concessions, transport subsidies and tariff protection. The aim of
all these measures was clear: to halt, or even reverse the flow of black Africans to the
‘white’ areas.
© Via Afrika Publishers >> Geography 12 Study Guide eBook 149
TOPIC 4 Economic geography of South Africa
1,2 Post-apartheid industrial development strategies
There have been a number of strategies aimed at economic, political and social
development through post-apartheid industrial development. The aim is to develop less
developed areas. The main industrial initiatives are the Spatial Development Initiatives
(SDIs) and Industrial Development Zones (IDZs).
1.2.1 Growth, Employment and Redistribution (GEAR)
GEAR was a large scale strategy aimed at creating a fast-growing economy and
sufficient jobs.
1.2.2 Black Economic Empowerment (BEE)
In the years before democracy in 1994, the apartheid government excluded black
people from meaningful participation in the economy. BEE was introduced to rectify the
wrongs of the past while helping to bring the black majority into the economy.
1.2.3 Accelerated and Shared Growth in South Africa (Asgi-SA)
Asgi-SA was introduced to achieve economic growth and to halve poverty and
unemployment by 2014.
2 What are Industrial Development Zones (IDZs)?
An Industrial Development Zone (or IDZ) is an industrial estate linked to an
international sea or air port that encourages export oriented manufacturing industries.
They aim to promote the manufacturing sector and to encourage beneficiation of local
resources.
3 What are Spatial Development Initiatives (SDIs)?
A Spatial Development Initiative (or SDI) aims to promote growth in those parts of
South Africa that are underdeveloped but have potential for growth. The most
successful SDI has been the Maputo Corridor. This is a major trade corridor connecting
Gauteng and Mpumalanga with Maputo in Mozambique. One hundred and thirty
investment opportunities have been identified in the infrastructure, agriculture,
mining, energy, chemicals, tourism and manufacturing sectors.
© Via Afrika Publishers >> Geography 12 Study Guide eBook 150
TOPIC 4 Economic geography of South Africa
4 What are the issues associated with industrial
centralisation and decentralisation
4.1 Centralisation
If an industry is successful in an area its success will attract other forms of economic
development and create jobs, services and wealth leading to the centralisation of
industry in a few areas.
The advantages of centralisation are that factories use the same physical infrastructure
such as power, water and transport. Skilled labour, markets and financial services are
all in the same area. This can lead to problems, as shown in Figure 80.
This causes an unequal
distribution of wealth,
activities and people.
Reasons for the
concern about the
degree of
centralisation
Industrial expansion in
Gauteng has placed pressure
on Vaal water supplies and
water has to be imported at
a cost.
Figure 80 Reasons for concern about centralisation
© Via Afrika Publishers >> Geography 12 Sludy Guide eBook 151
TOPIC 4 Economic geography of South Africa
Unit 6 The informal sector
1 The concept and characteristics of informal sector
employment
1.1 What is the concept of the informal sector?
The informal sector refers to that part of an economy that is not taxed and is out of
official government records. Workers have no employment contracts and do not belong
to trade unions.
1,2 What are the characteristics of the informal sector?
The characteristics of the informal sector are summarised in Figure 81.
Mostly informal
jobs in trade, ;
Self- building or No fringe
employed, domestic service benefits such
as pension or
often small family medical aid
concerns based
on little capital
Little job security
Irregular hours
and uncertain
wages
Absence of trade
Cheap raw unions
materials so
often the quality
of the goods is
low Mainly self-
Lack official employed
protection and
recognition
Figure 81 The characteristics of the informal sector
© Via Afrika Publishers >> Geography 12 Sludy Guide eBook
152
TOPIC 4 Economic geography of South Africa
2 What are the reasons for high informal sector
employment in South Africa?
The number of people involved in the informal sector is estimated to be about 3 million
out of a labour force of about 13 million and growing at about 8% per year. This is large
in a country like South Africa with a well-established economy.
e Under apartheid black people were denied entry to much of the economy except as
unskilled or semi-skilled labourers. Many were unable to obtain a decent education.
¢ With high unemployment more people have to obtain work in the informal sector in
order to survive. As unemployment increases so does the informal sector.
¢ Many of South Africa’s informal sector jobs are carried by non-South Africans,
especially Zimbabweans, as they are often denied access to formal employment.
3 What are the challenges facing South Africa’s informal
sector?
¢ Traders do not have access to proper trading facilities.
¢ Traders and their goods are exposed to the weather.
e Traders are frequently harassed by local authorities.
¢ Banks do not like to give loans to informal traders.
¢ The sector is unpredictable and the income unreliable.
¢ There is little time or incentive to improve their education or training.
¢ Many have HIV/Aids and as the illness gets worse work becomes increasingly
difficult.
© Via Afrika Publishers >> Geography 12 Study Guide eBook 153
TOPIC 4 Economic geography of South Africa
Questions
Question1
|
True or False. State if each of the following statements is true or false. If it is false
rewrite the statement correctly.
11 Mining iron is a secondary economic activity.
1.2 Banking is part of the tertiary sector.
1.3 The gross domestic product measure the employment structure of a country.
1.4 Acountry with a large percentage of its labour force engaged in agriculture is
the sign of a developed country.
1.5 In 2010 South Africa grew more food than it did in 1980.
1.6 In 2010 fewer people were engaged in agriculture that in 1980.
1.7 South Africa imports more food than it exports.
1.8 Small-scale farming cannot be commercial farming.
1.9 The inputs on a commercial farm include machinery and paid labour.
1.10 Wheat grown in South Africa is an important export crop.
1.11 Free State is an important producer of wheat, maize and sugar.
1.12 Maize is an important commercial and subsistence crop.
1.13 Fruit is South Africa’s largest export agricultural product.
1.14 Food security exists ‘when all people at all times have access to sufficient, safe,
nutritious food to maintain a healthy and active life’.
1.15 The discovery of gold and platinum in the 1890s led to the early development of
South Africa’s industry.
1.16 Most of South Africa’s electricity is generated in Gauteng.
1.17 Footloose industries manufacture most of South Africa’s shoes.
1.18 Spatial Development Zones were established to develop economic activity in
underutilised areas with economic potential.
1.19 Maputo is the closest harbour to the Gauteng industrial region.
1.20 Nuclear power is generated at a power station in Western Cape.
20x2=(40)
© Via Afrika Publishers >> Geography 12 Sludy Guide eBook 154
TOPIC 4 Economic geography of South Africa
Question 2
2.1 Refer to Figure 1 which shows an example of economic activities linked to the
informal sector.
Figure 1
2.1.1 Explain why the activities in Figure 1 are classified as being part of the
informal sector. 2x2=(4)
2.1.2 Give four characteristics of labour in the informal sector. 4x2=(8)
2.1.3. Give three problems that informal traders like those in Figure 1
experience. 3x2=(6)
2.2. Informal economic activities make no direct contribution to the Gross Domestic
Product of a country.
2.2.1. What is meant by the term GDP? 1x2=(2)
2.2.2 Explain why the statement in 1.6 in question 1 above is true. 2x2=(4)
2.3. Give two advantages of the informal sector for a country’s economic
development. 2x2=(4)
2.4 Give two disadvantages of the informal sector for a country’s economic
development. 2x2=(4)
(32)
© Via Afrika Publishers >> Geography 12 Sludy Guide eBook 155
TOPIC 4 Economic geography of South Africa
Question 3
a
Study Table 1 below and then answer the questions that follow.
3.2
3.3
3-4
Table 1 The contributions made by some sectors of the
economy to the GDP - 2011
Agriculture, forestry and fishing 3%
Mining and quarrying 7%
Manufacturing 19%
Electricity 2%
Finance, real estate, business services 22%
Construction 3%
Internet 2%
Wholesale and retail trade 13%
Social and personal services 20%
Transport 9%
Which of the four economic sectors contributed most to South Africa’s GDP?
1x2=(2)
State the contribution made by the primary sector to the GDP. 1x2=(2)
Classify the following economic sectors from the table as primary, secondary,
tertiary or quaternary:
3.3.1 Social and personal services
3.3.2. Manufacturing
3.3.3 Internet 3x2=(6)
Manufacturing makes up 19% of South Africa’s GDP and nearly half this is in
Gauteng.
3.4.1 Examine three factors favouring manufacturing in Gauteng. 3x4=(12)
3.4.2 Describe three environmental and social problems resulting from the
centralisation of manufacturing in Gauteng. 3x4=(12)
(34)
TOTAL MARKS [106]
© Via Afrika Publishers >> Geography 12 Sludy Guide eBook 156
Exam Papers
Final Exam Paper 1
TIME 3 HOURS
ANSWER ANY THREE QUESTIONS
SECTION A: PHYSICAL GEOGRAPHY
QUESTION 1
1d Match the columns so the description in the left column matches the concept in the right column.
1.1.1 | Causes mid-latitude cyclones to move from west to east A_ | Trough
1.1.2 Surface of contact between the cold air and the warm westerlies | B Aspect
1.1.3. | An elongated low pressure cell C_ | Rejuvenation
1.1.4 Refers to the direction in which a slope faces in relation to the D Polar front
Sun’s rays
1.1.5 | A type of erosion which occurs at the source of a stream E Headward erosion
1.1.6 | A break in the slope of a river F Knickpoint
1.1.7. | Ariver has extra erosive power G Antecedent drainage
1.1.8 | Can cause severe flooding H Westerlies
] Tropical cyclone
7*2=(14)
1.2 Study the synoptic map below and answer the following questions.
1.2.1. Name the high pressure systems A and B. 2x2=(4)
1.2.2 Identify the climatic feature with low pressure at C. (2)
1.2.3 Name the line marked F and state its pressure in hPa. 2x2=(4)
1.2.4 In which pressure system is the highest pressure on the map? (1)
1.2.5 What season does this synoptic weather map represent? (2)
1.2.6 Give three reasons for your answer based on evidence visible on the synoptic weather
map. 3x2=(6)
© Via Afrika Publishers >> Geography 12 Study Guide eBook 159
Exam Papers
43
© Bloomin 55
a
aidn
MN
1.2.7. Refer to the station model of Port Elizabeth below and name the type of wind (not
direction) that has resulted in the conditions as indicated by the station model. (2)
30
-3
1.2.8 Account for the atmospheric conditions being experienced in Port Elizabeth. 4x2=(8)
(29)
1.3 Geomorphology — Fluvial processes
1.3.1 Explain the difference between the terms abstraction and headward erosion. 2x2=(4)
1.3.2 Abstraction and headward erosion can lead to river capture. Explain what is meant by
the term river capture. 2x2=(4)
© Via Afrika Publishers >> Geography 12 Sludy Guide eBook 160
Exam Papers
= Sis SQ
>S>>S5 5 5°
13) Provide labels for the characteristic features A to E shown on map Y in the diagram
above. §x2=(10)
1.3.4 Describe the steps in the process that led to the landscape in map Y. 3x2=(6)
1.3.5 Explain why River B in map Y has been rejuvenated. 1x2=(2)
1.3.6 List two landforms that could result from this rejuvenation. 2x2=(4)
(Go)
(75)
QUESTION 2
2.1 Multiple choice. Indicate the best answer for each of the following questions.
Table 1 below shows temperatures on two consecutive July days at 06:00 on a farm in the Drakensberg
mountains of KwaZulu-Natal.
Table 1 Temperatures on two consecutive July days at 06:00 ona farm in the Drakensberg
Temperatures
Height First day Second day
Place X 800m 5 °C -6 °C
Place Y 1400m “1 9C 1c
© Via Afrika Publishers >> Geography 12 Study Guide eBook 161
Exam Papers
244 In Table 1 the weather responsible for causing the differences in temperature is likely to
occur when ...
A
moon
anabatic winds are blowing
the winter is warm
there is a cloud barrier at 1300 m
a cold front is situated over the area
the nights are clear and cold
2.1.2 In Table 1 the most likely answer for the lower temperatures at X is...
A
B
c
D
Y has a sunny aspect while X has a north facing slope
X has snow while Y has not
the air at X is drier than that at Y
during the night there has been rapid terrestrial radiation and cold air has
dropped down the valley sides
Band D
2.1.3. Which statementis correct about an urban heat island during the day?
A
B
due to general subsidence the horizontal component increases
due to a decrease in stability and an increase in turbulence the vertical
dimension of the heat island decreases
due to an increase in stability and an decrease in turbulence the vertical
dimension of the heat island increases
due to a decrease in stability and an increase in turbulence the vertical
dimension of the heat island increases
none of these
2.1.4 Ifall other factors remain constant except the stream becomes ... at some point, the
water will speed up.
A
mooaow
shallower
narrower
sandier
BandC
AandB
2.1.5 Braided streams occur where the channel floor is ...
A
mooaow
very deep
very narrow
very wide
very flat
very flat and wide
2.1.6 Which of the following features would you NOT find in the lower stage of a river?
A
moaow
flood plain
interlocking spurs
levees
estuaries
rapids
© Via Afrika Publishers >> Geography 12 Study Guide eBook 162
Exam Papers
2.1.7 Aconfluence is ...
A where a river starts
a branch of a main river
where the river flows into the sea
the point where two rivers join
the high ground between two rivers
moon
2.1.8 The headwaters of a stream are always located ...
A at the terminus of the stream where it enters another body of water
B at the midpoint of the longitudinal profile of the stream
Cc at the source of the stream
D at the mouth of the stream
E at the stream’s base level
8x2=(16)
2.2 South Africa’s weather. Study the synoptic weather map of 25 January 2012 below and answer the
questions that follow.
Windhoek |
L ah,
a7 :
Gaborone !/_<
31/7
0
10
Synoptic weather map of 25 January 2012
© Via Afrika Publishers >> Geography 12 Study Guide eBook 163
Exam Papers
2.2.1 What is the name given to the climatic system called Funso? (a)
2.2.2 State four conditions necessary for systems like Funso to form. 4x2=(8)
2.2.3. Drawa fully labelled cross-section through Funso to show clouds and air movements.
4x2=(8)
2.2.4 Including Funso, how many of these climatic systems have there been in this area this
season. 1x2=(2)
2.2.5 Systems like Funso are given different names in different parts of the world. State what
they called in (a) the USA and (b) Japan. 2x2=(4)
2.2.6 State three reasons why this synoptic map shows a summer condition. 3x2=(6)
(29)
2.3 Geomorphology — Fluvial processes
2.3.1. What is meant by the term graded river? 1x2=(2)
2.3.2 With the aid of well-labelled diagrams describe the difference between a graded river
and an ungraded river. 6«2=(12)
2.3.3 What is meant by the term rejuvenation? 1x2=(2)
2.3.4 List four causes of rejuvenation. 4x2=(8)
2.3.5 List three landforms caused by rejuvenation. 3x2=(6)
(Go)
[75]
SECTION B: HUMAN GEOGRAPHY
QUESTION 3
3.1 Multiple choice. Mark the best answers to the questions below.
3.11 In rural areas the failure of industrialisation and the modernisation of agricultural
practices has led to...
A voluntary resettlement
B rural-urban migration
Cc basic need philosophy
D formal resettlement
E push-pull factors
© Via Afrika Publishers >> Geography 12 Study Guide eBook 164
3.1.2
3.1.3
314
3.1.6
3.1.7
Exam Papers
What are the advantages of nucleated rural settlement?
A economic
B political
c can make farming easier
D social
E all of these
Which of these statements is true?
A The development of new shopping centres has occurred mainly in the CBD.
B The development of new industry has been in the rural-urban fringe.
Cc The development of new industry has been in the CBD.
D The development of new industry has been away from major transport links.
Which of the four classifications of industry must be located where the resources are
found?
A secondary
B tertiary
Cc primary
D quaternary
Even if the Gross Domestic Product index is used to measure the well-being of a country,
it will fail to show ...
A growth in secondary industries
B variations within countries
Cc growth within tertiary industries
D growth within primary industries
Arable land is ...
A used for growing crops
used for raising sheep and/or cattle
not suitable for farming
unsuitable for irrigation
both A and B
mooaow
South Africa’s mineral reserves can be extended by...
A conserving use of materials
B substituting other materials that accomplish the same thing
Cc recycling materials
D all of these
A factor limiting the development of industry in the Cape Town area is ...
A the cold Benguela current
B the agricultural raw materials
Cc the lack of flat ground
D the unskilled labour
E the long distance to the big markets in Gauteng
8x2=(16)
© Via Afrika Publishers >> Geography 12 Study Guide eBook 165
Exam Papers
3.2 Settlement. Study the photograph below showing a rural settlement in KwaZulu-Natal and
answer the questions that follow.
3.2.1 State why this settlement is classified as a nucleated rural settlement. 2x2=(4)
3.2.2. Many of the young men in this area have moved to the cities of Pietermaritzburg and
Durban.
a State the name of this movement. 1x1=(1)
b Describe three push factors that might have caused the young men to move.3x2=(6)
c Describe three barriers the young men might have met in their move to the city.3«2=(6)
3.2.3. There are advantages and disadvantages of living in a nucleated rural settlement.
a Describe three social advantages. 3x2=(6)
b Describe three economic disadvantages of this settlement type. 3x2=(6)
(29)
© Via Afrika Publishers >> Geography 12 Sludy Guide eBook 166
Exam Papers
33 Economic geography of South Africa. Study Table 2 below and then answer the questions that
follow.
Table 2 The contributions made by some sectors of the economy to the GDP — 2011
Agriculture, forestry and fishing 3%
Mining and quarrying 7%
Manufacturing 19%
Electricity 2%
Finance, real estate, business services 22%
Construction 3%
Internet 2%
Wholesale and retail trade 13%
Social and personal services 20%
Transport 9%
3.3.1 Which of the four economic sectors contributed most to South Africa’s GDP? 1x2=(2)
3.3.2 State the contribution made by the primary sector to the GDP. 1x2=(2)
3.3.3 Classify the following economic sectors from the table as primary, secondary, tertiary or
quaternary:
a social and personal services
b manufacturing
c Internet. 3x2=(6)
3.3.4 Manufacturing makes up 19% of South Africa’s GDP and nearly half this is in Gauteng.
Examine two factors favouring manufacturing in Gauteng. 2x4=(8)
3.3.5 Describe three environmental and social problems resulting from the centralisation of
manufacturing in Gauteng. 3x4=(12)
(30)
75]
© Via Afrika Publishers >> Geography 12 Study Guide eBook 167
QUESTION 4
4a
Exam Papers
Matching columns. Match the concept with the correct description.
4d Hierarchy of settlements The reduction in unit cost resulting from large scale
production
4.1.2 | Ribbon development Light industries which have few basic requirements
4.1.3. | Urban decay The minimum number of people in a region required to
support a particular shop or service
4.1.4 | Threshold population The area around a shop, settlement or central place which
is affected by the goods and services on offer
4.1.5 | Sphere of influence Low order
4.1.6 | Economies of scale Asystem of grading the various types of settlement
according to size
4.1.7. | Footloose industries Deterioration especially of the older parts of the town
4.1.8 | Convenience goods Urban expansion along roads
8x2=(16)
4.2 Settlement geography. State whether the following are TRUE or FALSE. Write only T or F next to
the number.
4.2.1 Cities attract mainly old people.
4.2.2. Urban sprawl occurs when there are no laws to control what and where people can
build.
4.2.3. Construction of ‘park and ride’ facilities on the fringe of the CBD can help to combat
traffic congestion.
4.2.4 Overcrowding is not a problem for most urban areas.
4.2.5 Urbanisation is the result of population migration from rural areas to urban areas.
2x§=(10)
43 Remote rural areas and inner cities. Write an essay of approximately ONE page in which you
evaluate the validity of this statement. ‘There are distinct similarities between remote rural areas
and inner cities.’
10*2=(20)
© Via Afrika Publishers >> Geography 12 Study Guide eBook 168
Exam Papers
4.4 The economic geography of South Africa. Refer to the photographs below, which show examples of
economic activities linked to the informal sector and answer the questions that follow.
AAA
44.2
443
AA
445
4.4.6
4.4.7
ad
SF .. ms
Explain why the activities illustrated are classified as being part of the informal sector.
2x2=(4)
Give four characteristics of labour in the informal sector. 4x2=(8)
Give two problems that informal traders experience. 2x2=(4)
Informal economic activities make no direct contribution to the Gross Domestic Product
of a country. What is meant by the term GDP? 1x1=(1)
Explain why the statement in 4.4.4 is true. 2x2=(4)
Give two advantages of the informal sector for a country’s economic development.2x2=(4)
Give two disadvantages of the informal sector for a country’s economic development.2x2=(4)
(29)
[75]
© Via Afrika Publishers >> Geography 12 Sludy Guide eBook 169
2.3
2.3.1
2.3.2
Exam Papers
A graded river is in a state of equilibrium and neither erodes nor deposits.“ — 1x2=(2)
OS derers slau
‘smooth concave profile decreasing in angle and
gradient towards the mouth
Three valid points for each diagram. 3x2x2=(12)
2.3.3
2.3.4
2.3.5
QUESTION 3
3
3.11
3.1.2
3.1.3
314
3.1.5
3.1.6
3.1.7
3.1.8
River rejuvenation takes place when there is an increase of a river's speed and erosive
power. ¥¥ 1x2=(2)
Four of: a worldwide lowering of sea level; raising of the land through forces in the
Earth’s crust; a significant increase in rainfall; a rapidly fl owing tributary that joins the
main stream; river capture (stream piracy) where the increased volume of water enlarges
the erosion capacity of the stream. 4x2=(8)
Knickpoints, VY terraces, YY incised meanders. VY 3x2=(6)
(30)
(75)
BYY
EVY
BYY
Cvv
BYY
AVY
DYY
EVY
8x2=(16)
© Via Afrika Publishers >> Geography 12 Sludy Guide eBook 172
443
Aho
4.4.5
4.4.6
447
Exam Papers
work become increasingly difficult; unsafe and unhealthy working conditions; not a
member ofa trade union. Y¥ V¥ VV VV 4x2=(8)
Two of: exposed to the weather; subject to xenophobia; goods confiscated by
authorities; theft; against the law; unprotected. VY” VV 2x2=(4)
The total value of a country’s output in a year ¥ (1)
Informal traders are in the formal sector, no records of their sales are kept and so they
pay no tax YY, and are not incorporated into the GDP. VV (4)
Two of: provides a living for many people; even though they pay no tax they money they
earn circulated through the economy; the money they earn is spent on goods and
services. V¥ VV 2x2=(4}
Two of: do not contribute to the tax base; take business away from formal traders who do
pay tax; do not buy property.V¥” VY 2x2=(4}
(29)
[75]
© Via Afrika Publishers >> Geography 12 Study Guide eBook 175
Exam Papers
Final Exam Paper 2
TIME 11/2 HOURS
ANSWER ALL THE QUESTIONS
Study the topographic map and orthophoto of 2528DA Cullinan on pages 316 and 317 in the Learner’s Book
and answer the questions that follow.
1 Multiple choice questions. Mark the best answer to the questions below.
1 The latitude of spot height 1432 (A4) is ...
A 28° 33' 15" E
B 25° 37'25"E
c 25° 37'25"S
D 28° 33'15"S
E 25° 38' 35" E
1.2 The longitude of spot height 1408 (Bz) is...
A 28° 31' 28"S
B 25° 38' 55" E
c 25° 39' 05" E
D 28° 33'15"S
E None of these
1.3 The land use south-west of the large dam (C1) is ...
A agricultural
B residential
c recreational
D mining
E AandD
1.4 The land use at the point marked 1 on the orthophoto is...
A mining
B farming
Cc industry
D recreation
E none of these
15 The contour interval represents the...
A accuracy of the surveying work
B horizontal spacing between the contour lines
c number of contour lines on a map
D vertical spacing between contour lines
© Via Afrika Publishers >> Geography 12 Study Guide eBook
176
Exam Papers
E none of these
1.6 The natural resources in the area covered by the topographic map include ...
A minerals
B agricultural products
c surface water
D AandB
E A, Band C
7 The town of Cullinan is in ...
A Limpopo
B KwaZulu-Natal
c Free State
D Eastern Cape
E none of these
7*2=(14)
1.8 The cultivation of fruit is an important activity at the farm called Tweefontein (A1).
A true
B false (1)
(15)
2 Calculations
2a A hiker walks in a straight line from the trigonometrical station numbered §3(C2) to spot
height 1459 in C3 to.
2.4.1 Calculate the length of the walk. 1x2=(2)
2.1.2 What is the true bearing of the walk? 1x2=(2)
2.1.3. Calculate the gradient of the walk. Show all your working. 3x2=(6)
2.1.4 This gradient is classified as:
Agentle
B moderate
Csteep
D very steep (2)
2.2 A motorist drives from Pretoria along the road numbered §13 to the police station in D2.
Calculate the length of the drive. 1x2=(2)
2.3 Calculate the approximate area, in hectares, of the excavation labelled Premier Diamond
Mine in D1 And D2. 1 hectare = 10000 mz. 3x2=(6)
(20)
3 Analysis and interpretation
3a Agriculture. Study the farm named Doomkraal (A3) and answer the questions that
follow.
3.1.1 State, with two reasons, whether you think this farm is a subsistence or a
commercial farm. 3x2=(6)
3.1.2 List one likely crop that is grown on this farm. 1x2=(2)
© Via Afrika Publishers >> Geography 12 Study Guide eBook 177
Exam Papers
3.1.3 Explain the use of the lines of trees on this farm.
1x2=(2)
3.2 Settlement. A developer wishes to build a housing complex in the area for wealthy
retired people. The developer is offered three sites: Site 1 is at Louwsbaken between the
road and the dam (C3). Site 2 is around spot height 1446 (D1). Site 3 is around spot height
1382 (A1).
3.2.1 Select the site you think is the best and give two reasons why you have chosen
this site. 2x2=(4)
3.2.2 Give one disadvantage for each of the other two sites. 2x2=(4)
3.3 List three advantages of the area covered by the topographical map to an industrialist
wishing to start a factory manufacturing food products. 3x2=(6)
3.4 State the name of the street pattern in the area called Refilwe (Bz). (a)
(25)
4 Geographic information systems
4a Matching columns. Match the descriptions with the concepts.
4d Preparing data according to specific GIS norms and A_ | Data integration
standards as to make it available to a variety of users
4.1.2 Protection of data in a GIS for commercial, personal or | B | Data security
national security reasons
4.1.3 Integration and exchange of data between various C | Data sharing
organisations in order to make better decisions
41.4 Combining data from different maps into one map D | Data standardisation
which summarises the overlaying process
E Data representation
4x2=(8)
4.2 Classify the topographic map either as a raster or vector data structure (1)
43 From block C2 identify ONE example of a line, point and area geographical feature.3«1=(3)
4.4 Classify each of your examples in question 4.3 as a node, arc or polygon feature. 3x1=(3)
(as)
(75)
© Via Afrika Publishers >> Geography 12 Study Guide eBook 178
Exam Papers
4
gaa CY
412 BYY
413 AVY
414 DVYY
4x2=(8)
4.2 Vector (a)
43 Point: trigonometrical beacon, houses, single trees (any one) ” (1)
Line: other roads, contours (any one) ¥ @Q
Area: dam, residential area, golf course (any one) “ (a)
4.4 Any point feature — node ¥ (a)
Any line feature — arc ¥ (1)
Any area feature — polygon ¥ (1)
(15)
(75]
© Via Afrika Publishers >> Geography 12 Study Guide eBook 180
Study this subject
Notes, quizzes and topic questions for Grade 12 Geography.
- Grade 12 Geography notes
CAPS revision notes with worked examples.
- Geography questions by topic
Past exam questions sorted by CAPS topic, with memos where available.
- Grade 12 Geography quizzes
Short topic quizzes with instant feedback.
- All Grade 12 Geography past papers
Past papers by year, with memos where available.
- Grade 12 Study guides
More Geography and other subjects in this collection.
Recommended for this subject
More papers and memos for this grade and subject.
Question paper
Geography Grade 12 P1 Gauteng June 2025 Question Paper (Afr)
Question paper
Geography Grade 12 P2 Gauteng June 2025 Question Paper (English)
Memorandum
Geography Grade 12 Paper 2 Gauteng Mock 2025 Memo
Question paper
Geography Grade 12 Paper 1 KZN Mock 2025 Question Paper
Question paper
Geography Grade 12 Paper 2 KZN Mock 2025 Question Paper
Question paper
Geography Grade 12 Paper 1 NSC June 2025 Question Paper (English)
Related documents
Memorandum
Geography Grade 12 Paper 1 NSC November 2025 Memo (English)
Memorandum
Geography Grade 12 P2 Eastern Cape Prelim 2024 Memo (Afrikaans)
Memorandum
Geography Grade 12 Gauteng June 2024 Memo (English)
Memorandum
Geography Grade 12 Paper 2 Gauteng Prelim 2024 Memo (Afrikaans)
Memorandum
Geography Grade 12 Paper 1 NSC June 2024 Memo (Afrikaans)
Memorandum
Geography Grade 12 Eastern Cape June 2023 Memo (Afrikaans)
More from Grade 12 Geography
Question paper
Geography Grade 12 Eastern Cape June 2023 Question Paper
Question paper
Geography Grade 12 Eastern Cape June 2023 Question Paper (Afr)
Question paper
Geography Grade 12 Eastern Cape June 2023 Question Paper (Afr)
Question paper
Geography Grade 12 GAU June 2023 Question Paper
Question paper
Geography Grade 12 P1 GP Prelim 2023 Question Paper (English)
Question paper