
Study & Master
Support Pack | Grade 11
CAPS
Life Sciences
Diversity, change and continuity
This support pack for the Diversity, change and continuity
strand in the Life Sciences Grade 11 CAPS curriculum
provides practice exercises. All exercises have the answers
provided. Learners can work through these individually at home
or these could form the basis of a catch-up class or online
lesson. You have permission to print or photocopy this
document or distribute it electronically via email or WhatsApp.
Cambridge University Press Africa
is a proudly South African publisher.
For more information on our Study & Master CAPS-approved
textbooks and valuable resource materials, visit
www.cambridge.org
Brighter thinking | Better learning
www.cambridge.org
Skip to contentStudy guide 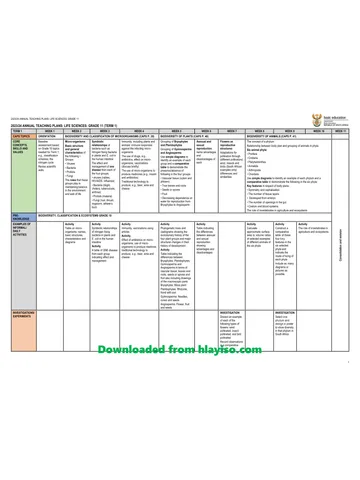







View all





5 . G11 LifeSciences DigitalSupport web Diversity Change and Continuity Worksheets
Grade 11 Life Sciences study guide, 14 pages. Read online or get the free PDF download.
Publisher: Study & Master
Life Sciences · Grade 11. Study guide, 14 pages. Read online or download the PDF.
- Subject
- Life Sciences
- Grade
- Grade 11
- Document type
- Study guide
- Publisher
- Study & Master
- Curriculum
- CAPS
- Pages
- 14
- File size
- 527.5 KB
Loading document…
Loading document…
1 of 14
Document textSearch extracted text and jump to a page.
WORKSHEET 1: Biodiversity and classification of
microorganisms
1. The table below shows the figures for the HIV prevalence rate among
women attending antenatal clinics in South Africa in different provinces.
Province 2011 2012 2013 2014 2015
Eastern Cape 29,3 29,1 31,4 31,3 30,2
Free State 32,5 32,0 29,8 34,4 29,8
Gauteng 28,7 29,9 28,6 27,6 30,2
KwaZulu-Natal 37,4 37,4 40,1 42,4 44.4
Limpopo 22,1 22,3 20,3 20,9 21,7
Mpumalanga 36,7 35.6 37,5 35.8 34.9
Northern Cape 17,0 17,8 17.5 16,1 19,0
North West 30,2 29,7 28,2 28,7 29,2
Western Cape 18,2 16,9 18.7 18,7 18,9
National 29,5 29,5 29,7 30,0 30,8
Source: 2015 National Antenatal Sentinel HIV and Syphilis Survey Report (October 2017)
1.1 Study and compare the data for each province in the table. What
conclusion can you draw about the prevalence of HIV in each
province?
1.2 Give possible reasons for the distribution of HIV in South Africa as
observed in the table.
1.3 Do you think that these figures can accurately reflect the number
of HIV infections among the whole population of South Africa?
Think about the population that is being sampled.
1.4 As future leaders in our country, what are some of the measures
that you regard as being essential to reduce the incidence of the
disease? Discuss this in your groups and present your conclusions
to the class.
2. In South Africa, flu cases are monitored by influenza surveillance
programmes. The figure below shows the number of cases of severe
acute respiratory illnesses caused by different flu virus strains from
1 January 2011 to 9 September 2011.
30 100
90
Number of samples Detection rate (%)
25
80
70
20
60
15 50
40
10
30
20
5
10
0 0
1 3 5 7 9 11 13 15 17 19 21 23 25 27 29 31 33 35 37 39 41 43 45 47 49 51
Jan Feb Mar Apr May Jun Jul Aug Sep Oct Nov Dec
Weeks of the year
B unsubtyped A (H1N1) 2011 A (H3N2) Detection rate
The number of positive samples by influenza types and subtypes and detection rate by week
2.1 When is the main flu season in South Africa?
2.2 What was the main strain of flu during the 2011 season?
2.3 What was the detection rate at the peak of the flu season?
2.4 The rate you found in question 3 was quite low. Why do you think
that detection of the virus was low, even though it was the peak of
the season?
2.5 There was a second peak late in the 2011 flu season. Which strain
of flu virus caused most of the cases?
2.6 Why do you think there was a change in the strain of virus?
2.7 Using the disease cycle, explain how vaccinating people against flu
will prevent the spread of the disease.
3. The table below shows the number of cases of TB and the number of
deaths from TB around the world in 2018.
Region Number of cases Number of deaths
(1000s) (1000s)
Africa 3 900 430
The Americas 350 20
Eastern Mediterranean 1 000 99
Europe 560 62
South-East Asia 4 900 480
Western Pacific 2 900 240
Global total 14 000 1 300
Source: http://www.who.int/mediacentre/factsheets/fs104/en/
3.1 Draw bar charts using the data for each region in the table to show
the number of cases of TB and the number of deaths from TB in
2018.
3.2 Work out the number of cases and deaths in each country as
percentages of the global total. Draw a table to show your results.
3.3 Which country had the highest number of cases of TB in 2018?
3.4 Which country had the highest number of deaths from TB in 2018?
3.5 Why do you think that the Americas and Europe have such a small
number of cases of TB compared to the other countries in the
table?
3.6 Europe and North America are at similar levels of development and
wealth. Can you think of reasons why Europe should have more
cases of TB than North America?
4. Study the graphs and answer these questions.
A Primary response B Secondary response
DISEASE RECOVERY Antibody
Pathogen
y
od
tib
An Pathogen
Start of infection Time Start of infection Time
Primary and secondary immune responses
4.1 Describe what each graph shows.
4.2 Why is the response time different in the primary and secondary
immune response?
MEMORANDUM FOR WORKSHEET 1
1.1 Most provinces have shown little difference in prevalence in this
five year period. KwaZulu-Natal has shown the largest increase
in prevalance among pregnant women in the last five years, from
37,4% to 44,4%.
1.2 Possible reasons for the distribution of HIV in South Africa could
include:
• differences with respect to the size of the provinces and
population size
• differences in literacy
• improved AIDS education programmes, thus bringing about a
change in behaviour among young women
• the improvement of the status of women by government
through its affirmative action policies
• the increased power of women to say “no”.
1.3 The figures in the table are taken from sampling that is done at
antenatal clinics, so they reflect HIV prevalence in a particular
section of the population – sexually active, young women. This
means that it is not possible to directly extrapolate the HIV
prevalence in this population to the general population of South
Africa. However, the figures do act as a consistent measure of HIV
prevalence in particular areas over time.
1.4 This question will generate a large amount of discussion. Your
teacher will provide guidance and adjudication on issues around
the appropriate measures.
2.1 The main flu season is between May and August.
2.2 The main strain of flu during the 2011 season was A(H1N1).
2.3 The detection rate at the peak of the flu season was around 80%.
2.4 The detection rate was probably lower than it could have been
because not everyone with flu symptoms will have been tested for
a specific virus.
2.5 The second peak was caused by A(H3N2).
2.6 The change in strain could have been caused by a mutation or by
the new strain being introduced into South Africa from elsewhere.
2.7 People who are vaccinated against flu are less likely to catch the
disease and so there is break in the transmission of the virus.
3.1
5 000
4 000
Number of cases (1 000s)
3 000
2 000
1 000
0
Africa Americas Eastern Europe South-East Western
Mediterranean Asia Pacific
500
400
Number of deaths (1 000s)
300
200
100
0
Africa Americas Eastern Europe South-East Western
Mediterranean Asia Pacific
3.2 Region Number of cases Number of deaths
(% of total) (% of total)
Africa 27,85 33,00
The Americas 25,00 1,50
Eastern Mediterranean 7,00 7,60
Europe 4,00 4,76
South-East Asia 35,00 36,92
Western Pacific 20,70 18,46
3.3 Africa was the region with the highest number of TB cases in 2018.
3.4 South-East Asia had the highest nimber of deaths from TB in 2018.
3.5 Europe and the Americas consist of developed countries with low
levels of poverty and good health and social infrastructure. TB is
an uncommon disease where most people are well nourished and
do not live in crowded conditions.
3.6 Europe may have more cases of TB than the Americas because
Europe receives more immigrants from areas of the world where
there are high levels of TB.
4.1 Primary response:
This is characterised by a fairly long lag period and a gentle or
slow increase in the production of antibodies. This allows the
pathogen to reach high concentrations which causes disease.
Secondary response:
This is characterised by a very short lag phase and a rapid
increase in the production of antibodies. The increase in antibody
concentration destroys the pathogen and prevents disease.
4.2 The specific immune response is characterised by specificity,
memory and the acquired ability to detect and eliminate foreign
substances. The immune response reacts to particular substances
called antigens. Antigens activate the immune system and interact
with cells and chemicals of the immune response system. Once
a response to an antigen has occurred, a memory system is
established that allows a rapid and specific secondary response
on re-exposure to the same substance. Hence, the secondary
response which occurs with subsequent exposure to an antigen
that the body “remembers”, is very much quicker. It must also be
noted that the population of memory cells is much larger than the
original population of B cells from which they came. Therefore,
the response to the second infection is much more rapid and greater
than the primary response.
WORKSHEET 2: Biodiversity of plants
1. The diagrams below represent certain structures in the life cycle of
pteridophytes. Study the diagrams and then answer the questions that
follow.
A B C D
4
3 5
8
6 7
2 1
1.1 Identify the diagrams A to D and the parts numbered 1 to 8.
1.2 Which of the structures (A to D) form part of the:
i Gametophyte generation
ii Sporophyte generation?
1.3 Give the number and name of the structure in which:
i Fertilisation occurs
ii Meiosis occurs
1.4 Indicate the number of the structure in which spores are produced.
1.5 Name three numbered parts consisting of cells that are diploid.
2. The diagram on the right represents the flower of an angiosperm.
Answer the following questions.
a
2.1 Give one reason why the plant of this
flower is classified as an angiosperm. b
i
2.2 What is the common name given to parts
a, b and c? h
c
2.3 Write down the letter of the structure in g
d
which the female gamete is produced.
e
2.4 Write down the letters of the parts that f
represent the androecium.
2.5 Which letter refers to the whorl that is important for insect
pollination?
2.6 Is this flower likely to be self-pollinated? Give a reason for your
answer.
2.7 Which letter represents the receptacle?
2.8 Which letter represents the part that will develop into:
i a seed
ii a fruit?
2.9 Which letter represents the protective whorl while the flower is
still in bud?
MEMORANDUM FOR WORKSHEET 2
1.1 A – sorus; B – prothallus; C – archegonium; D – antheridium;
1 – placenta; 2 – indusium; 3 – sporangium; 4 – archegonium;
5 – antheridium; 6 – rhizoid; 7 – neck canal; 8 – sperm
1.2 i B, C, D
ii A
1.3 i 4 – archegonium
ii 3 – sporangium
1.4 3 – sporangium
1.5 1, 2 and 3
2.1 Pistils are enclosed in an ovary.
2.2 Pistil
2.3 g
2.4 h and i
2.5 d
2.6 Cross-pollination: stigma grows higher than the anthers.
2.7 f
2.8 i g
ii c
2.9 e
WORKSHEET 3: Biodiversity of animals
1. Write a short paragraph explaining what a phylum is. List the two ways
that organisms can be grouped into a phylum.
2. List the five aspects of an animal’s body plan that are important and
common to all animals.
3. Write a short paragraph on radial and bilateral symmetry in animals.
Which of the phyla you have studied show symmetry and which of these
phyla are radially symmetrical and which are bilaterally symmetrical?
4. What is cephalisation? What is the relationship between symmetry and
cephalisation?
5. Which is the phylum that first shows cephalisation? Write a short
paragraph about cephalisation in chordates.
6. What do the words diploblastic and triploblastic mean? Which of the phyla
you have studied are diploblastic and which are triploblastic?
7. List the advantages of a coelomate body plan.
8. Fill in this table to show the key features of the body plans of each of the
phyla you have studied in this unit.
Symmetry Number Number of Presence
and of tissue openings or absence
cephalisation layers in the gut of a
developing coelom
from the and blood
embryo system
Porifera
Cnidaria
Platyhelminthes
Annelida
Arthropoda
Chordata
9. List the main features of a crustacean, an insect and a myriapod.
10. What is a notochord? Explain why a notochord is significant in the
chordates.
11. What is unique about the way that young mammals are fed?
12. A lizard was kept in an open enclosure in a laboratory. At regular intervals
during a period of three days its rectal temperature was measured, along
with the temperature of the enclosure. The readings are show in the graph.
Study the graph and then answer the questions.
38
environmental temperature
36
rectal temperature
34
32
30
Temperature °C
28
26
24
22
20
18
16
14
0 1 2 3
Days
12.1 Is the lizard ectothermic or endothermic? Give a reason for your
answer based on the graph.
12.2 Why did the lizard’s body temperature fluctuate each day?
12.3 Why did the lizard’s body temperature never reach that of the
environment?
12.4 If a rat was kept under the same conditions, how would a rat’s body
temperature differ from that of the lizard’s rectal temperature?
MEMORANDUM FOR WORKSHEET 3
1. A phylum is the taxonomic rank below kingdom and above class. A
kingdom contains more than one phylum. A phylum can be defined in two
ways:
• it is a group of organisms that have a similar body plan
• it is also a group of organisms that are related through evolution.
2. There are five aspects of any animal body plan that are important and
common to all living animals:
• symmetry (asymmetry, bilateral symmetry or radial symmetry) and
cephalisation
• number of tissue layers developing from the embryo – two (diploblastic)
or three (triploblastic)
• presence or absence of a coelom (a cavity within the mesoderm)
• presence or absence of a through gut.
3. Radial symmetry: an animal with radial symmetry has no left or right sides.
Bilateral symmetry: an animal with bilateral symmetry has a left and a
right side.
Three phyla of animals, sponges, cnidarians and ctenophores (which we do
not deal with) show radial symmetry. However, this radial symmetry in the
sponges is not seen in the modern groups, which show asymmetry. All the
remaining groups of animals show bilateral symmetry.
4. Cephalisation is the presence of a definite head containing sensory organs
that face in the direction that the animal moves in. Cephalisation develops
at the same time as changes in symmetry.
Animals that are bilaterally symmetrical show cephalisation. The three
phyla of animals that show radial symmetry do not show cephalisation.
5. Cephalisation is first seen in the platyhelminthes – the flat worms – which
have sense organs in the head region and is then present in all the rest of the
bilaterally symmetrical animal phyla.
Chordates (vertebrates) are the only animals that have a true head that
contains a true brain, which is divided into several vesicles that control and
co-ordinate the nervous responses of the body. The bony cranium is also
unique to vertebrates, as is the concentration of sense organs – the eyes,
ears and nose – on the head.
6. The number of tissue (germ) layers developing in the embryo are also used
to place animals in groups. The early embryo, called the blastula, consists
of a ball of cells. The animal is either:
• diploblastic, with two tissue layers with ectoderm on the outside and
endoderm on the inside
• triploblastic, with three tissue layers, with mesoderm between the
ectoderm and the endoderm.
The number of tissue layers in the blastula determines whether or not the
animal is diploblastic or triploblastic.
Animals with radial symmetry, such as the cnidarians, produce two
tissue layers, the ectoderm and the endoderm. They are diploblastic.
All the rest of the animal groups have bilateral symmetry and produce
a third layer between these two layers, called the mesoderm. They are
triploblastic. These tissue layers eventually give rise to all of an animal’s
tissues and organs through a process called organogenesis.
7. All the more advanced animal phyla, from annelids and arthropods to
the chordates, have a coelom and a tube-within-a-tube arrangement. This
particular arrangement is very important in animal evolution because it
provides a number of advantages:
• it allows animals to become larger and more complex by providing
space for organs to develop
• it allows the body wall and the organs to behave independently of each
other – in other words, the organs do not move with the body wall
• in some phyla, such as the annelids, the coelom is filled with fluid that
provides a hydrostatic skeleton, which helps members of the phylum to
move and burrow in the soil
• in some phyla, coelomic fluid helps to transport food, oxygen and
wastes.
8. Symmetry and Number of Number of Presence or
cephalisation tissue layers openings in absence of a
developing from the gut coelom and
the embryo blood system
Porifera Asymmetrical, no Endoderm No gut Acoelomate, no
cephalisation and ectoderm, blood system
diploblastic
Cnidaria Radially Endoderm Blind-ending Acoelomate, no
symmetrical, no and ectoderm, gut blood system
cephalisation diploblastic
Platyhel Bilaterally Endoderm, Blind-ending Acoelomate, no
minthes symmetrical, mesoderm, gut blood system
cephalisation ectoderm,
triploblastic
Annelida Bilaterally Endoderm, Through gut Coelomate, with
symmetrical, mesoderm, blood vessels
cephalisation ectoderm, throughout length
triploblastic of body
Arthropoda Bilaterally Endoderm, Through gut Coelomate, with
symmetrical, mesoderm, blood vessels
cephalisation ectoderm,
triploblastic
Chordata Bilaterally Endoderm, Through gut Coelomate, with
symmetrical, mesoderm, blood vessels and
cephalisation ectoderm, heart, lungs and
triploblastic gills
9. The main diagnostic features of crustaceans are:
• compound eyes on stalks
• two pairs of antennae
• a body divided into a cephalothorax (head and thorax) and an abdomen
• five pairs of jointed legs.
The diagnostic features of insects are:
• The body is divided into a head, a thorax and an abdomen.
• The head carries a pair of antennae, a pair of compound eyes and a
series of mouthparts.
• Insects have three pairs of jointed legs. Most have one or two pairs of
wings, but some are wingless.
There are two classes of myriapod:
• Centipedes: class chilopoda
• Millipedes: class diplopoda.
Centipedes have flattened, segmented bodies and one pair of legs on each
segment. They are well adapted for running fast. The head has a single pair
of antenna, poison claws and strong mouthparts.
Millipedes have rounded, segmented bodies and two pairs of legs on each
segment. The head has a single pair of antenna and strong mouthparts.
10. All chordates have a notochord, which is a long rod of supportive tissue
derived from the dorsal wall of the gut in the embryo. The cells of the
notochord are unique and it is surrounded by sheaths of connective
tissue. All chordates have a notochord during early development and this
becomes the bony vertebral column. This contains a nerve cord called the
spinal column. The spinal column and the vertebral column are unique to
chordates.
11. Young mammals suckle milk from their mother’s mammary glands.
12.1 Ectothermic because its temperature fluctuates with that of the
environment.
12.2 Because the environmental temperature also fluctuates.
12.3 The lizard cannot absorb all the heat energy available in its surroundings,
so never reaches the temperature of the room.
12.4 In a mammal this would be a straight line because body temperature
would remain constant.
Study this subject
Notes, quizzes and topic questions for Grade 11 Life Sciences.
- Grade 11 Life Sciences notes
CAPS revision notes with worked examples.
- Life Sciences questions by topic
Past exam questions sorted by CAPS topic, with memos where available.
- Grade 11 Life Sciences quizzes
Short topic quizzes with instant feedback.
- All Grade 11 Life Sciences past papers
Past papers by year, with memos where available.
- Grade 11 Study guides
More Life Sciences and other subjects in this collection.
Recommended for this subject
More papers and memos for this grade and subject.
Annual teaching plan
Gr 11 Life Sci ATP 2023 24
Memorandum
Life Sciences Grade 11 Eastern Cape November 2025 Memo (Afr)
Memorandum
Life Sciences Grade 11 P1 Eastern Cape November 2025 Memo (Eng)
Question paper
Life Sciences Grade 11 Eastern Cape November 2025 QP (Afr)
Question paper
Life Sciences Grade 11 P2 Eastern Cape November 2025 QP
Question paper and memo
Life Sciences Grade 11 KZN June 2025 Paper & Memo
Related documents
Question paper and memo
Life Sciences Grade 11 Eastern Cape June 2024 Paper & Memo
Memorandum
Life Sciences Grade 11 P2 Eastern Cape November 2024 Memo (Afr)
Memorandum
Life Sciences Grade 11 P2 Eastern Cape November 2024 Memo (Eng)
Question paper
Life Sciences Grade 11 P2 Eastern Cape November 2024 QP (Eng)
Question paper and memo
Life Sciences Grade 11 KZN June 2024 Paper & Memo
Question paper
Life Sciences Grade 11 NW June 2024 Question Paper (Afrikaans)
More from Grade 11 Life Sciences
Question paper
Life Sciences Grade 11 NW June 2024 Question Paper (English)
Memorandum
Life Sciences Grade 11 P1 Eastern Cape November 2023 Memo (Afr)
Memorandum
Life Sciences Grade 11 P1 Eastern Cape November 2023 Memo (Eng)
Memorandum
Life Sciences Grade 11 P2 Eastern Cape November 2023 Memo (Afr)
Question paper
Life Sciences Grade 11 P1 Eastern Cape November 2023 QP (Eng)
Question paper