
‘Downloaded from hlayiso.com
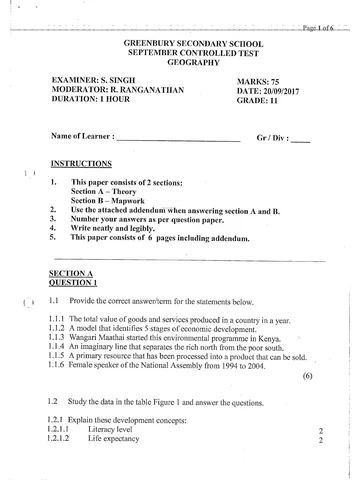
ee a : oe Page Lof6
GREENBURY SECONDARY SCHOOL
SEPTEMBER CONTROLLED TEST
GEOGRAPHY
EXAMINER: S. SINGH MARKS: 75
MODERATOR: R, RANGANATHAN DATE: 20/09/2017
DURATION: 1 HOUR GRADE: 11
Name of Learner : Gr / Div:
INSTRUCTIONS
1. This paper consists of 2 sections:
Section A — Theory
Section B — Mapwork
2. Use the attached addendum when answering section A and B.
3. Number your answers as per question paper.
4. Write neatly and legibly.
5. This paper consists of 6 pages including addendum.
SECTION A
QUESTION 1
1.1 Provide the correct answer/term for the statements below.
1.1.1 The total value of goods and services produced in a country in a year.
1.1.2 A model that identifies 5 stages of economic development.
1.1.3 Wangari Maathai started this environmental programme in Kenya.
1.1.4 An imaginary line that separates the rich north from the poor south.
1.1.5 A primary resource that has been processed into a product that can be sold.
1.1.6 Female speaker of the National Assembly from 1994 to 2004.
(6)
1.2 Study the data in the table Figure 1 and answer the questions.
1.2.1 Explain these development concepts:
1.2.1.1 Literacy level
1.2.1.2 Life expectancy
Nw
Skip to content
View all
Geography Grade 11 September Test 2017 Paper & Memo
Grade 11 Geography question paper and memo from the September Test 2017, 10 pages. Read online or get the free PDF download.
Geography · Grade 11 · September Test · 2017. Question paper and memorandum, 10 pages. Read online or download the PDF.
- Subject
- Geography
- Grade
- Grade 11
- Document type
- Question paper and memo
- Year
- 2017
- Exam period
- September Test
- Curriculum
- CAPS
- Pages
- 10
- File size
- 1.3 MB
Free to read online, no sign-up needed
Loading document…
Loading document…
1 of 10
Document textSearch extracted text and jump to a page.
Downloaded from hlayiso.com
Page 2 of 6
1.2.2 Refer to the data in the table and state whether these statements are
True or False.
1.2.2.1 Countries with a high GDP/capita generally have low per capita carbon
emissions.
1.2.2.2 Countries with low life expectancy have lower HDI’s.
1.2.2.3 People living in countries with a higher GDP/capita tend to have had more
than 12 years of schooling.
1.2.2.4. Lower literacy levels are associated with highly urbanised countries.
1.2.2.5 A lower GDP/capita results in.a higher HDI.
1.2.2.6 Highly urbanised countries have lower HDI’S 6
1.2.3 Explain the relationship between a countries HDI and it’s education levels. 2
1.2.4 List the 3 indicators of development used to calculate the HDI of a country. 6
. (18)
1.3 Read the extract on Fair Trade — Figure 2 in the addendum and answer the ( ‘
questions. ; .
1.3.1 Define the term Fair Trade. 2
1.3.2 Name ONE way in which fair trade benefits farmers in developing
countries. 2
1.3.3 Explain how fait trade can help consumers reduce poverty, through everyday
shopping.(2 answers)
1.3.4 Discuss TWO similarities between fair trade and free trade. 4
1.3.5 To be certified as fair trade, producers need to maintain good environmental
protection when developing sustainable agriculture. Provide FOUR criteria
that producers need to maintain to uphold environmental standar ds i in fair
trade. 8
' 1.4 Study Figure 3 that depicts a less developed country before and after
globalisation and answer the questions.
1.4.1 Explain the term globalisation. 2
14.2 Provide ONE piece of evidence from the figure to indicate that globalisation
has occurred. 1
1.4.3 The management headquarters of the factory i in panel B is in the USA.
What would you call the factory in this country? l
14.4 Ifthe factory produces products for the export market, what form of
development will take place in this country? ; i
1.4.5 Discuss THREE positive effects of globalisation in this country. 6
(11)
SECTION A =55
Downloaded from hlayiso.com
—— _—___Page3-of 6— —_—
SECTION B- MAPWORK
QUESTION 2
2.1 Study the map extract Figure 4 -BOURKE’S LUCK in MPUMALANGA.
2.1.1
2.1.2
Write down the scale of the map in words. 1
Refer to DB 2430 on the bottom right hand corner and give:
2.1.2.1 Latitude
2.1.2.2 Longitude
2.1.3
2.1.4
2.1.5
2.1.6
2.1.7
2.1.8
2.1.9
State the cardinal direction of Steenveld (A2) from Berghoek (A5). 1
Mention TWO ways how height is shown on the map. 2
Explain how the Blyde River Canyon contributes towards the GDP of
Mpumalanga. Ol 2
Calculate the straight line distance of the landing strip (D2,E2) in meters. 3
What is the difference in height between in height between #909 and #1149
in (Cl) 2
Calculate the AREA of block B3. 4
Calculate the magnetic bearing for the year 2001 if:
True bearing = 120°
MD = 15°15’ W 3
SECTION B = 20
FINAL TOTAL : 75
Downloaded from hlayiso.com
Page 4 of 6
FIGURE 1
USA 47 200 | 78,5 99 12,4 82,3 19,1 0,910
Brazil 10.800 | 73,5 90 7,2 86,5 1,84 0,718 | 84%
Germany 35 700 | 80,4 99 12,2 73,8 9,71 0,905 | 9"
Turkey — 12 300 | 74 90,8 65 __ | 69,6 3,59 0,699 | 92"¢
China 7 600 | 73,5 94 7.5 | 47 4,57 0,687 | 101%
india 3 500 | 65,4 62,8 — : 44 30 1,18 0,547 | 134" (f
New Zealand | 27 700 | 80,7 99 12,5 86,2 8,48 0,908 | 5" ~
Nigeria 2 500 | 51,9 60,8 5,0 49,8 0,35 0,459 | 156"
United
Republic of
Tanzania 1 400 | 58,2 72,9 5,1 26,4 0,13 0,466 | 152"
South Africa | 10 141 | 52,8 88,7. 85 62 7,27 0,619 | 123° )
(Source: United Nations Human Development Report, World Almanac) QP
FIGURE 2 | . C
Fair Trade is a global trade model and certification allows shoppers to quickly identify products
that were produced in an ethical manner.
For consumers, Fair Trade offers a powerful way to reduce poverty through their everyday
shopping.
For farmers and workers in developing countries, Fair. Trade offers better prices, improved
terms of trade, and the business skills necessary to. produce high-quality products that can
compete in the globat marketplace. Through vibrant trade, farmers and workers can improve
their lives and plan for their futures.
Today, Fair Trade benefits more than 1.2 million farming families in 70 developing countries
across Africa, Asia and Latin America.
[Source: www fairtradefederation, org]
Downloaded from hlayiso.com
__Page 5.of 6
tee
A
thet ae sacprtger spol |
2 nel SS py aren ee a
Cr a 1 peta
is SS SS Flin
BS
ea tl
ear Be
ammo
C)
Downloaded from hlayiso.com
Page 6 of 6
- FIGURE 4!
| : aay 50'
§
ee
| Heldorburg wal
Z
; ae DEPARTMENT OF HSS ers
Mean magnatic declination 16°18" West of True North( July 2004 ), 4.0.0, fan B RAMASAME SCALE “| 250 000
Moan annual chango 4° Wastwardsl 1998-2000 ), f7\ .
: 8\ Figure 1.36 Topographic map extract Bourke’s Luck 2430DB.
iMcwkine - Meme
Downloaded from hlayiso.com
September oo -
__. iQuesston | S—~—SSOOSCSCi~S
us GDP
fe Reshows meclel oo
Jug. Geert Movement
U4, Bronelt ui nc “a
_ ias. Value added procluct ~
a ee
lee. Frene Ginwales
i
header FE |
1a: Number sh years the sv
EX “peKeen
is_expec 1 Awe. 7 ~
haat Fede “
aaa Tue a
2 2.2.8. Prue “a - — cts
oa Foe “~ : ~ treatin
ab: False ae a nen
let
“1G@bP Joe per cpt fst. op living Cay |
Downloaded dm hlayiso.com
oe BA. “Toe . lbehecen GORQPOIN\SS iy Aevelpet _
Icountvies ane) develépy _ ceunties - Featy
_lpnees pac) ty precliers
= oiiee belles rices a4
| Cowy 1) _
; ih aa: Compelnies ath Ly prices lao hb
sont COOOL) 7
oA mont _. ff
, an oe net ge — airc| alse |
acorsritoareicentientiy ‘I aan reiteteeewwesevur ate PO INCLO serene ze enn yy consistent
ee s4. Neo! an A
[Prokts shoe ci\lu <a
Bo th. __premete cs stop SBHON = cleotoee press
qe clrcumes oc
fom ampreves _rtlehonshyps jn counties
kB: Fotecting werty FeSauces ; . (
Practising CASp rotation _
[Restvichng “use “a oy _poxbicles + eA Tigeus .
Ramin use oh GM. ogensins -
Proper _rpgregeiment He Swoote | ene ee
25) ~
any | ste severable ncusty
po Downloaded from hlayiso.com
settee we Cay, steer SI rorhone _ itary ecscan asc SRT a RE
yd: Mult rer Non | | Transnahcral
- led eva ment
ville
_. _comentenl eZ . yickol vy Mee
. _isol lorlect a 7
ite ni
ae att
bates
‘Sttstsenvhinee afters Ie eee ih AERR UST ALUN VR ANNE mae
. Gustin mn atapan
aval ‘Lathele —_ ay” —s
2-2 ng pee 0° a ~
soared hi scutes i aac te abr
a an
a) regh eS
~ C2, pe BA3)
Downloaded from hlayiso.com
Study this subject
Recommended for this subject
Question paper and memo
Geography Grade 11 P1 KwaZulu Natal June 2017 Paper & Memo
Question paper and memo
Geography Grade 11 P2 KwaZulu Natal June 2017 Paper & Memo
Question paper and memo
Geography Grade 11 March Test 2017 Paper & Memo
Question paper and memo
Geography Grade 11 NSC Prelim 2017 Paper & Memo
Question paper and memo
Geography Grade 11 September Test 2018 Paper & Memo
Question paper and memo
Geography Grade 11 September Test 2016 Paper & Memo
More from Grade 11 Geography
Memorandum
Geography Grade 11 P1 Eastern Cape November 2025 Memo (Eng)
Memorandum
Geography Grade 11 P2 Eastern Cape November 2025 Memo (Eng)
Question paper
Geography Grade 11 P1 Eastern Cape November 2025 QP (Eng)
Question paper
Geography Grade 11 P2 Eastern Cape November 2025 QP
Memorandum
Geography Grade 11 P1 Eastern Cape November 2024 Memo (Afr)
Question paper