
Downloaded from hlayiso.com
NATIONAL SENIOR CERTIFICATE EXAMINATION
NOVEMBER 2018
GEOGRAPHY: PAPER I
Time: 3 hours 300 marks
PLEASE READ THE FOLLOWING INSTRUCTIONS CAREFULLY
1. This question paper consists of 22 pages, a Colour Insert of 4 pages (i–iv) and an
Answer Sheet of 4 pages (i–iv). Detach the Colour Insert and Answer Sheet from
the middle of the question paper. Please check that your question paper is
complete.
2. Read the questions carefully.
3. ALL THREE QUESTIONS ARE COMPULSORY.
4. Credit will be awarded for the following:
• interpretation and explanation; and
• evidence of personal observations where this is appropriate to the question.
5. You are encouraged to use sketch maps, diagrams and other explanatory drawings
to support your answers wherever relevant.
6. It is in your own interest to write legibly and to present your work neatly.
7. There is a GLOSSARY of words on page 2 explaining the meaning of the words in
bold that are used in the questions.
8. Candidates must pay attention to the mark allocation. Unless otherwise indicated,
two marks are awarded for a valid response. This means that a question carrying
four marks requires two responses.
IEB Copyright © 2018 PLEASE TURN OVER
Skip to contentQuestion paper 
View all
Geography Grade 12 IEB Paper 1 2018 Question Paper
IEB Grade 12 Geography Paper 1 question paper from the 2018, 22 pages. Read online or get the free PDF download, memo linked when available.
Publisher: IEB
Geography · Grade 12 · 2018. Question paper, 22 pages. Read online or download the PDF.
- Subject
- Geography
- Grade
- Grade 12
- Document type
- Question paper
- Year
- 2018
- Paper
- 1
- Publisher
- IEB
- Curriculum
- IEB
- Pages
- 22
- File size
- 3.5 MB
Loading document…
Loading document…
1 of 22
Document textSearch extracted text and jump to a page.
Downloaded from hlayiso.com
NATIONAL SENIOR CERTIFICATE: GEOGRAPHY: PAPER I Page 2 of 22
GLOSSARY
WORD MEANING
Account for To justify and provide reasons for something using a short explanation.
Analyse To separate into parts or elements and to describe or examine each in
detail.
Assess To evaluate or estimate the nature, ability, or quality of.
Calculate To work out the value of something using a mathematical method.
Classify To divide into groups or types so that things with similar characteristics
are in the same group.
Comment To give your opinion or make a statement about something; to write
generally about.
Define To give the precise meaning of ...
Describe To provide the main characteristics of something; to provide an account
of. (Note: A diagram or map may be included as part of a description.)
Design To explain step by step a process or plan of action.
Determine To discover as a result of an investigation.
Discuss To examine or investigate by way of an argument the various aspects of
a statement.
Draw To show by means of a sketch.
Elaborate To write about something in depth, with much attention to the detail of
the different parts making up the whole.
Evaluate To judge or determine, to provide an opinion on a particular matter.
Examine To analyse and to discuss; to look at something carefully.
Explain To make clear or plain or to make sure that the reader understands what
is being said.
Explore To comment on something in detail.
Identify To give the essential characteristics of something.
Illustrate To make clear or intelligible, as by examples or analogies; exemplify.
Indicate To point out or show.
Match To connect similar things or things that belong together.
Name To state something; to give; to mention.
Outline To provide a general explanation or description of something.
Predict To say what is expected to happen; to foretell; to say in advance.
Select To choose; to pick out the correct answer from several alternatives.
State To present information or details plainly, directly, and simply, without
discussion.
Suggest To propose an explanation or solution by way of a plan or suggestion.
IEB Copyright © 2018
Downloaded from hlayiso.com
NATIONAL SENIOR CERTIFICATE: GEOGRAPHY: PAPER I Page 3 of 22
SECTION A GEOGRAPHICAL ISSUES
QUESTION 1 GEOGRAPHICAL CASE STUDY: THE GEOGRAPHY OF
THE ORANGE / SENQU RIVER BASIN AND THE
NORTHERN CAPE
1.1 Catchment and river management
Study Table 1, which contains information on the Orange River catchment
area, and Figure 1, a longitudinal profile of the Orange River, and Figure 2,
a map of the Orange River basin.
Table 1: Information for the Orange / Senqu River catchment areas
ORANGE / SENQU RIVER BASIN INFORMATION
Size of catchment 1 000 000 km2
area (almost 600 000 km2 are within the borders of South
Africa)
Total length of the 2 300 km
river
Average natural 12 billion m3
run-off This value can, however, be very misleading since the
basin is now heavily developed with the result that the
current average annual run-off reaching the river mouth
at Alexander Bay is less than half of the natural run-off.
Source Mouth
Location Lesotho Highlands Alexander Bay
Altitude above sea level 3 300 m Atlantic Ocean
Average annual precipitation 1 800 mm < 50 mm
Average annual potential
1 100 mm > 3 000 mm
evaporation
OTHER IMPORTANT INFORMATION
• The Vaal River is the largest of the Orange River's tributaries.
• The Richtersveld is an area between Augrabies Falls and the mouth of the
Orange River.
• The Orange River has unearthed a landscape millions of years old.
• As the river flows through the Richtersveld it has an antecedent drainage
pattern.
Figure 1: Longitudinal profile of the Orange River
[Source: Adapted from <http://www.orangesenqurak.com>]
IEB Copyright © 2018 PLEASE TURN OVER
Downloaded from hlayiso.com
NATIONAL SENIOR CERTIFICATE: GEOGRAPHY: PAPER I Page 4 of 22
Figure 2: The Orange River catchment area
[Source: adapted from the Department of Water and Sanitation]
(a) Explain the terms:
(i) catchment area (2)
(ii) potential evaporation (2)
(b) Use the information in Table 1 and Figure 1, to determine the
approximate gradient of the Orange River from its source to its
mouth. Show all calculations. (4)
(c) Name one constructed knickpoint and one natural knickpoint. (4)
(d) Explain the term rejuvenation. (2)
(e) Comment on why the Orange River would not be regarded as
graded. (4)
(f) With the aid of a diagram, describe how an antecedent drainage
pattern is formed. (6)
(g) Assess why the amount of rainfall decreases from the eastern part
of the Orange River catchment area to the western part of the
catchment area. (4)
IEB Copyright © 2018
Downloaded from hlayiso.com
NATIONAL SENIOR CERTIFICATE: GEOGRAPHY: PAPER I Page 5 of 22
1.2 Settlement and fluvial processes
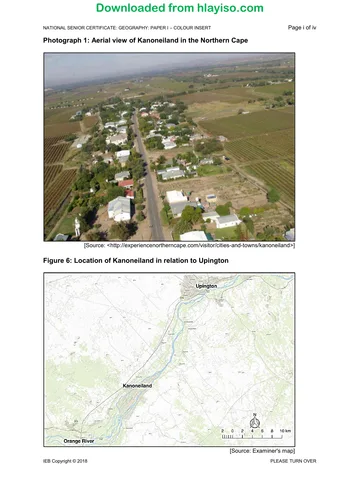
Study Photograph 1 on page i of the Colour Insert and Figure 3 below of the
settlement of Kanoneiland.
Figure 3: Topographic map extract of Kanoneiland
[Extract from 2821 CA Kanoneiland]
(a) Identify and account for the shape of the Kanoneiland settlement
as seen in Figure 3 and Photograph 1. (4)
(b) Describe the site of the settlement. (4)
(c) Analyse whether the settlement is a dry-point or wet-point settlement. (4)
(d) Examine why this settlement would be regarded as a "village" in
terms of urban hierarchy. (4)
(e) Identify the stream channel pattern of the Orange River at point A
on Figure 3. (2)
(f) Explain the formation of the stream channel pattern at A in Figure 3. (2)
(g) Discuss how alluvial deposits, like the ones found at A in Figure 3,
have influenced the growth and development of the local economy. (4)
IEB Copyright © 2018 PLEASE TURN OVER
Downloaded from hlayiso.com
NATIONAL SENIOR CERTIFICATE: GEOGRAPHY: PAPER I Page 6 of 22
1.3 Agriculture and valley climates
Read the fact file extract on wine farming in Kanoneiland and along the
Orange River in the Upington area.
Fact File: Kanoneiland, Upington and Orange River Wines
• Outside Upington on the Orange River, Kanoneiland is the largest inhabited
inland island in South Africa.
• This is a fascinating stopover en route to Augrabies or the Kgalagadi.
• One can enjoy a drive between the many vineyards, a spit-roast, home-
baked bread, several traditional desserts and locally produced wines.
• The closest large settlement to Kanoneiland is Upington along the Orange
River.
• Today the main crop is grapes – mostly sultanas for raisins (and some
Colombard for wine), while lucerne, pecan nuts and cotton are also
cultivated.
• Orange River Wine Cellars is situated in South Africa's – and possibly the
world's – most unusual wine-growing region.
• A large agritourism industry has grown in recent times.
• The river, which creates a cool enough micro-climate, and the type of soil
along its banks (a combination of alluvial deposits, granite, dolerite and
shale) result in the production of quality grapes.
[Source: discoversouthafrica and Country Life]
[<https://www.sa-venues.com>]
[<http://www.openafrica.org>]
(a) Classify viticulture 1 into an economic sector. (2)
(b) Explain how the river valley would affect the location of vineyards
along the Orange River. (4)
(c) Predict TWO factors other than the arid climate that would hinder
wine farming in this region. (4)
(d) Many wine farmers in South Africa have moved into agritourism.
Assess why rural redevelopment is important to the survival of rural
communities like Kanoneiland. (6)
1
viticulture: the cultivation of grapevines.
IEB Copyright © 2018
Downloaded from hlayiso.com
NATIONAL SENIOR CERTIFICATE: GEOGRAPHY: PAPER I Page 7 of 22
1.4 Khi Solar One post-apartheid economic development project
Study the infographic Figure 4, below, about the Khi solar power plant near
Upington in the Northern Cape.
Figure 4: Infographic about the Khi Solar One power station
[https:<//www.brandsouthafrica.com>]
IEB Copyright © 2018 PLEASE TURN OVER
Downloaded from hlayiso.com
NATIONAL SENIOR CERTIFICATE: GEOGRAPHY: PAPER I Page 8 of 22
(a) Define the term renewable energy. (2)
(b) Explain why the Northern Cape is an ideal location for solar power. (4)
(c) Evaluate how a post-apartheid development strategy like this project
will benefit the people in a region like Upington socio-economically. (6)
1.5 Urban climates
As part of a field study, you collected data on the effect of an Urban Heat
Island (UHI) in the region around Kanoneiland and Upington. The graph
below (in Figure 5) shows the readings collected at Kanoneiland and in the
Upington CBD respectively. A location map, Figure 6 on page i of the
Colour Insert, will help you with the positioning of the two settlements.
Figure 5: Graph showing temperature data for Kanoneiland and
Upington
35
30
25
Temperature °C
20
15
10
5
0
December March June September
Months of the Year
Upington CBD Daytime Ave Upington CBD Early Morning Ave
Kanoneiland Daytime Ave Kanoneiland Early Morning Ave
Write a report for the South African Weather Service in which you discuss
the findings from your research. Explain how the sprawl of the urban areas
affects the climate of a region, in particular, urban areas versus rural areas.
In your report you must cover the following aspects:
• Outline the observed temperature variation (rural vs urban).
• Describe possible causes of heat in an urban area.
• Evaluate how the UHI has exacerbated 2 the temperatures felt in urban
areas such as Upington.
• Explore solutions that urban areas such as Upington could implement
to reduce the UHI effect. (20)
2
exacerbated: make (a problem, bad situation, or negative feeling) worse.
IEB Copyright © 2018
Downloaded from hlayiso.com
NATIONAL SENIOR CERTIFICATE: GEOGRAPHY: PAPER I Page 9 of 22
Note: you may draw on any examples you have studied to support your
discussion. Use the rubric below to guide the planning and structure of your
report.
CRITERIA MARKS
Writing skills
• Taking into consideration structure and presentation.
5
• Use of brief introduction and conclusion.
• Logical discussion and use of subheadings.
Content knowledge
• Correct use of geographical terminology and concepts. 10
• Adherence to topic and sub-headings.
Supporting evidence – analysis and understanding
• The ability to analyse and evaluate the topic is assessed in this
category.
• Reference made to case study material / fact file / source material 5
provided.
• If appropriate, reference must be made to familiar / local or other
examples.
Total for essay 20
100 marks
IEB Copyright © 2018 PLEASE TURN OVER
Downloaded from hlayiso.com
NATIONAL SENIOR CERTIFICATE: GEOGRAPHY: PAPER I Page 10 of 22
SECTION B CLIMATE, WEATHER AND GEOMORPHOLOGY
QUESTION 2 MID-LATITUDE CYCLONE, TROPICAL CYCLONE, LOCAL
WEATHER, RIVER BASIN STUDY, RIVER CHANNEL AND
FEATURES, DROUGHT
2.1 Mid-latitude cyclone
Study Figure 7 on page ii of the Colour Insert, a thematic weather map.
Select the correct answer to the statement given. Write the number and
letter of the question and the letter corresponding to your answer.
Example 2.1 (a) A
(a) The dashed lines in Figure 7 are called …
A isobars.
B isohyets.
C isohels.
D isotherms. (2)
(b) The region where you find the coldest temperatures in a mid-latitude
cyclone is the …
A cold sector.
B cold front.
C warm sector.
D warm front. (2)
(c) The anticyclone visible in Figure 7 is called …
A Kalahari / interior anticyclone.
B South Atlantic anticyclone.
C South Indian anticyclone.
D Karoo / Cape anticyclone. (2)
(d) The term used to describe the change in wind direction as a cold
front passes in the southern hemisphere is …
A backing.
B veering.
C crosswind.
D South Easter. (2)
(e) The weather Cape Town will experience in the next 24 hours will
be …
A clear, warm with a light breeze.
B cool, northwesterly wind and partly cloudy.
C rainy, with a strong south-easterly wind.
D thunderstorms, with gale-force wind. (2)
IEB Copyright © 2018
Downloaded from hlayiso.com
NATIONAL SENIOR CERTIFICATE: GEOGRAPHY: PAPER I Page 11 of 22
2.2 Tropical cyclones
Study Figure 8 on page ii of the Colour Insert, a weather report from eNCA.
(a) Identify point A marked on Figure 8. (2)
(b) Name two factors that would have aided Dineo's formation. (4)
(c) State the approximate wind speeds experienced at Inhambane and
Vilanculos respectively, in km/h. (2)
(d) Evaluate why the inhabitants of Inhambane would have experienced
Dineo as more severe than the people in Vilanculos would have. (4)
(e) Evaluate why storms like Dineo are so devastating for countries like
Mozambique. (6)
2.3 Local weather
Study the two tweets in Figure 9A and Figure 9B below, as well as the
synoptic weather map (Figure 10 on page 12) on the weather over the
eastern part of South Africa on 9 and 10 October 2017.
Figure 9A Figure 9B
@Julius_S_Malema munsieville in westrand Pavilion Shopping Mall in Westville, KZN
today (after strong rain) Flooded during an intense storm last night.
[Source: Twitter, October 2017]
IEB Copyright © 2018 PLEASE TURN OVER
Downloaded from hlayiso.com
NATIONAL SENIOR CERTIFICATE: GEOGRAPHY: PAPER I Page 12 of 22
Figure 10: Synoptic weather map for 9 October 2017 (the dashed line
indicates the moisture front).
A B
[Source: South African Weather Service]
(a) Name a synoptic weather map feature responsible for the formation
of line thunderstorms. (2)
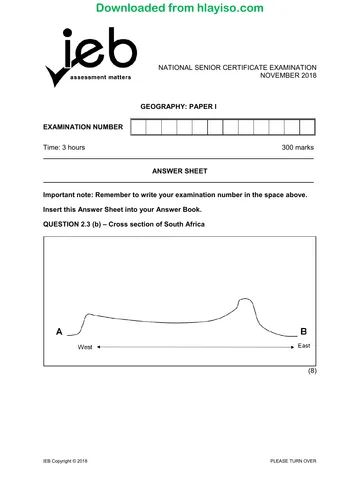
(b) On the cross section of South Africa on page i of the Answer Sheet
provided, illustrate how thunderstorms are formed over the interior
of South Africa.
Include the following in your diagram:
• Explain how hail forms in these line thunderstorms.
• Illustrate why these thunderstorms form on the eastern side of
the moisture front. (8)
(c) Draw a weather station symbol to describe the weather that Durban
might experience during a cut-off low. (6)
(d) Explore how the mismanagement of urban storm-water drains in
Durban and Johannesburg could have worsened the effects of the
flood episode in these cities. (4)
IEB Copyright © 2018
Downloaded from hlayiso.com
NATIONAL SENIOR CERTIFICATE: GEOGRAPHY: PAPER I Page 13 of 22
2.4 Drainage systems in South Africa
Study Figure 11 below, a map of the Wilge River drainage basin in the Free
State, South Africa, and answer the questions that follow.
Figure 11: The Wilge River drainage basin
[Source: GIS-generated map]
IEB Copyright © 2018 PLEASE TURN OVER
Downloaded from hlayiso.com
NATIONAL SENIOR CERTIFICATE: GEOGRAPHY: PAPER I Page 14 of 22
(a) Select the underlined term or terms to correctly complete the
statement. Write only the number of the question and the correct
term, e.g. (i) Water.
(i) The watershed labelled A is the Waterberg / Magaliesberg /
Drakensberg. (2)
(ii) The fluvial process you are most likely to encounter at B is
transportation / deposition / lateral erosion. (2)
(iii) The fluvial feature indicated by the dashed line marked C is
a/an interfluve / back marsh / confluence. (2)
(iv) The drainage pattern of the Wilge River is dendritic / trellis /
parallel. (2)
(b) Study the three hydrographs below.
Hydrograph A Hydrograph B
12 20
10 15
8
cumecs cumecs
6 10
4 5
2
0 0 Jan
Jan
Feb
Mar Feb
Mar
Apr
May
Apr
May
Jun
Jul Jun
Jul
Aug
Sep
Aug
Sep
Oct
Nov Oct
Nov
Dec
Dec
Hydrograph C
12
10
8
cumecs
6
4
2
0 Jan
Feb
Mar
Apr
May
Jun
Jul
Aug
Sep
Oct
Nov
Dec
(i) Choose the hydrograph that best matches the Wilge River
system. (2)
(ii) Account for your answer to Question 2.4 (b) (i). (4)
(iii) Explain how urban sprawl in towns like Harrismith and
Bethlehem affects the discharge and lag time of a hydrograph. (4)
(iv) The Wilge River is the main feeder river to the Vaal Dam from
the Lesotho Highlands Water Scheme. Elaborate on the
importance of drainage basin management schemes such as
the Lesotho Highland Water Scheme to Johannesburg
residents and the industries in the area. (6)
IEB Copyright © 2018
Downloaded from hlayiso.com
NATIONAL SENIOR CERTIFICATE: GEOGRAPHY: PAPER I Page 15 of 22
2.5 River channel, fluvial process and fluvial features
Study Photograph 2 of a river valley in Mpumalanga on page iii of the
Colour Insert.
(a) Name the stage in which this river channel would most likely be found. (2)
(b) Identify the type of flow in the river channel. (2)
(c) Identify the fluvial feature shown in the photograph. (2)
(d) Explain how the fluvial feature identified in Question 2.5 (c) is formed. (4)
(e) Identify the type of transportation that would occur at this stage of a
river. (2)
(f) Describe the conditions under which a river would transport a load
like the one in Photograph 2. (4)
2.6 Dams and drought
Study the infographic below of dam levels in the Western Cape in
November 2017.
Figure 12: Infographic on dam levels in the Western Cape
[Source: <capetown.gov.za>]
(a) Define the term water security. (2)
(b) Calculate by what percentage water levels had dropped from 2016
to 2017. (2)
(c) In the space provided on page ii of the Answer Sheet, design your
own infographic in which you explore:
• the consequences of water scarcity in Cape Town
• possible solutions to the water crisis in Cape Town (8)
100 marks
IEB Copyright © 2018 PLEASE TURN OVER
Downloaded from hlayiso.com
NATIONAL SENIOR CERTIFICATE: GEOGRAPHY: PAPER I Page 16 of 22
SECTION C RURAL AND URBAN SETTLEMENT AND ECONOMIC
GEOGRAPHY OF SOUTH AFRICA
QUESTION 3 RURAL SETTLEMENT, URBANISATION, INFORMAL
SETTLEMENTS, URBAN FUNCTIONS, MIXED-USE
DEVELOPMENT AND URBAN RENEWAL, LAND REFORM,
ECONOMIC SECTORS, GAUTENG, DIAMOND MINING
3.1 Rural settlement
Study the settlement circled on Photograph 3, on page iii of the Colour
Insert, of a rural settlement in KwaZulu-Natal.
(a) Choose the words that match the description of the settlement in
Photograph 3. Write only the question number and the correct term
in your Answer Book, e.g. (i) House
(i) Pattern nucleated isolated dispersed
(ii) Shape cross road round linear
small
(iii) Type farmstead village country
town
(iv) Type of
intensive extensive
farming subsistence
commercial commercial (8)
activity
(b) "At higher levels of development, the distinction between urban and
rural is increasingly difficult to make." Assess the validity of this
statement. (6)
IEB Copyright © 2018
Downloaded from hlayiso.com
NATIONAL SENIOR CERTIFICATE: GEOGRAPHY: PAPER I Page 17 of 22
3.2 Urbanisation
Study the graph in Figure 13 below that shows the hourly growth of the
fastest-growing African cities.
Figure 13: Graph of the fastest-growing African cities
Fastest-Growing Cities in Africa
JOHANNESBURG, SOUTH AFRICA 21
KHARTOUM, SUDAN 21
NAIROBI, KENYA 22
LUANDA, ANGOLA 34
CAIRO, EGYPT 44
KINSHASA, DRC 61
LAGOS, NIGERIA 77
0 10 20 30 40 50 60 70 80 90
Population Growth per hour, 2010 to 2030
[Adapted from the World Economic Forum]
(a) Calculate the daily growth of Johannesburg's population. (2)
(b) Outline TWO causes of the rapid growth in these cities. (4)
(c) Assess the benefits that migrants might experience in these cities. (6)
3.3 Informal Settlement
Study Photograph 4, on page iii of the Colour Insert, of a typical informal
settlement in South Africa.
(a) Give ONE piece of evidence from Photograph 4 to outline how you
can tell that this is an informal settlement. (2)
(b) Identify ONE infrastructural service provided to the people who live
in this settlement. (2)
(c) Explore some obstacles that people in an informal settlement in
South Africa have to face daily. (4)
IEB Copyright © 2018 PLEASE TURN OVER
Downloaded from hlayiso.com
NATIONAL SENIOR CERTIFICATE: GEOGRAPHY: PAPER I Page 18 of 22
3.4 Urban functions
Photograph 5, on page iv of the Colour Insert, shows three businesses, A,
B and C, next to each other on a street corner.
(a) Indicate which business, A, B or C, would have the lowest-order
goods of the businesses shown in Photograph 5. (2)
(b) Examine which business, A, B or C, would have the largest sphere
of influence. (4)
(c) Analyse whether the position of these stores is due to functional
convenience or functional magnetism. (4)
3.5 Mixed-use development and urban renewal
Read the following article and study Photograph 6 below the article. Both
relate to a new development in the city centre.
Fact file: Cape Town's new urban lifestyle
A new computer application has been released giving a clearer look into the
scope and scale of Cape Town's new R8 billion precinct, Harbour Arch.
Harbour Arch is modelled on an existing project in northern Johannesburg –
Melrose Arch. The new development will take approximately a decade to
complete and will involve an investment of approximately R8 billion.
On completion, the 5.8 hectare Harbour Arch will be contained in its own
precinct, much like Melrose Arch, and will be home to seven individual tower
blocks with a total of 200 000 square metres of usable space – making it the
first and largest mixed-use development of its kind in the Cape Town CBD.
Phase 1 of the residential aspect of the project has already kicked off, while a
hotel partnership has also been announced.
[Source: <https://businesstech.co.za>]
Photograph 6: An artist's impression of the Harbour Arch
development in the CBD of Cape Town.
Harbour Arch
[Source: <https://businesstech.co.za>]
IEB Copyright © 2018
Downloaded from hlayiso.com
NATIONAL SENIOR CERTIFICATE: GEOGRAPHY: PAPER I Page 19 of 22
(a) Explain the following terms:
(i) mixed-use development (2)
(ii) precinct (2)
(b) Discuss some of the socio-economic consequences of new urban
developments such as Harbour Arch. (6)
3.6 Land reform
Study the cartoon below, Figure 14, on the land reform program in South
Africa.
Figure 14: Cartoon on land reform in South Africa
[Source: <https://www.farmersweekly.co.za>]
On the flow diagram on page iii of the Answer Sheet, analyse how the land
reform process currently works in South Africa. Highlight some of the issues
with the current process. (8)
IEB Copyright © 2018 PLEASE TURN OVER
Downloaded from hlayiso.com
NATIONAL SENIOR CERTIFICATE: GEOGRAPHY: PAPER I Page 20 of 22
3.7 Structure of the economy and informal sector
Study the graph below (Figure 15) which shows internet access in Soweto
and Sandton in Gauteng.
Figure 15: Internet access in Soweto and Sandton in Gauteng.
Internet Access
Fixed line Cell phone
Soweto
Sandton
0 10 20 30 40 50 60 70 80 90
PERCENTAGE OF USERS
[Source: Adapted from Gauteng City Region Observatory]
(a) Name the sector of the economy an internet provider falls within. (2)
(b) Account for the difference in internet usage between Sandton and
Soweto. (4)
(c) "The sale of sim cards and mobile data has become a mainstay of
the informal sector in Soweto."
(i) Explain what the informal sector is. (2)
(ii) Discuss why sim cards and data are easy products for people
in the informal sector to sell. (4)
IEB Copyright © 2018
Downloaded from hlayiso.com
NATIONAL SENIOR CERTIFICATE: GEOGRAPHY: PAPER I Page 21 of 22
3.8 Gauteng
Study the infographic below (Figure 16) showing the current Gauteng
Provincial Government's development plans.
Figure 16: Gauteng development corridors
[Source: The Citizen]
Complete the mind map on page iv of the Answer Sheet by describing the
Gauteng Industrial Region under the following points:
• Major industries
• Factors that promote industrial development
• Factors that hinder industrial development
• Aspects contributing to future economic growth (12)
IEB Copyright © 2018 PLEASE TURN OVER
Downloaded from hlayiso.com
NATIONAL SENIOR CERTIFICATE: GEOGRAPHY: PAPER I Page 22 of 22
3.9 Diamond mining
Study Figure 17, an infographic on page iv of the Colour Insert, on the state
of diamond mining globally since 2007.
(a) Explain the following concepts:
(i) peak production (2)
(ii) kimberlite (2)
(b) Identify the largest producer of diamonds in Africa. (2)
(c) Account for the rapid increase in the production of diamonds
between 1980 and 2005. (4)
(d) Suggest TWO reasons for the stabilisation of diamond production
since 2010. (4)
100 marks
Total: 300 marks
IEB Copyright © 2018
Study this subject
Revise the topics in this paper, then practise them question by question.
- Grade 12 Geography notes
CAPS revision notes with worked examples.
- Geography questions by topic
Past exam questions sorted by CAPS topic, with memos where available.
- Grade 12 Geography quizzes
Short topic quizzes with instant feedback.
- All Grade 12 Geography past papers
Past papers by year, with memos where available.
- Grade 12 IEB past papers
More Geography and other subjects in this collection.
Recommended for this subject
More papers and memos for this grade and subject.
Question paperIEB
Geography Grade 12 IEB Paper 1 2019 Question Paper
Question paperIEB
Geography Grade 12 IEB Paper 1 2019 Question Paper (Afrikaans)
Question paperIEB
Geography Grade 12 IEB Paper 1 2019 Question Paper (Afrikaans)
Question paperIEB
Geography Grade 12 IEB Paper 2 2019 Question Paper
Question paperIEB
Geography Grade 12 IEB Paper 2 2019 Question Paper (Afrikaans)
Question paperIEB
Geography Grade 12 IEB Paper 2 2019 Question Paper (Afrikaans)
Related documents
MemorandumIEB
Geography Grade 12 IEB Paper 1 2018 Memo
MemorandumIEB
Geography Grade 12 IEB Paper 1 2018 Memo
AddendumIEB
Geography Grade 12 IEB Paper 1 2018 Addendum
Question paperIEB
Geography Grade 12 IEB Paper 2 2018 Question Paper
Question paperIEB
Geography Grade 12 IEB Paper 2 2018 Question Paper
Question paperIEB
Geography Grade 12 IEB Paper 1 2017 Question Paper
More from Grade 12 Geography
MemorandumIEB
Geography Grade 12 IEB Paper 1 2019 Memo
MemorandumIEB
Geography Grade 12 IEB Paper 2 2019 Memo
Question paperIEB
Geography Grade 12 IEB Paper 2 2019 Question Paper
MemorandumIEB
Geography Grade 12 IEB Paper 2 2018 Memo
MemorandumIEB
Geography Grade 12 IEB Paper 1 2017 Memo
Question paperIEB