
Downloaded from hlayiso.com
NATIONAL SENIOR CERTIFICATE EXAMINATION
NOVEMBER 2018
GEOGRAPHY: PAPER II
MARKING GUIDELINES
Time: 1½ hours 100 marks
These marking guidelines are prepared for use by examiners and sub-examiners,
all of whom are required to attend a standardisation meeting to ensure that the
guidelines are consistently interpreted and applied in the marking of candidates'
scripts.
The IEB will not enter into any discussions or correspondence about any marking
guidelines. It is acknowledged that there may be different views about some
matters of emphasis or detail in the guidelines. It is also recognised that,
without the benefit of attendance at a standardisation meeting, there may be
different interpretations of the application of the marking guidelines.
IEB Copyright © 2018 PLEASE TURN OVER
Skip to contentMemorandum 
View all
Geography Grade 12 IEB Paper 2 2018 Memo
IEB Grade 12 Geography Paper 2 memorandum from the 2018, 16 pages. Read online or get the free PDF download, question paper linked when available.
Publisher: IEB
Geography · Grade 12 · 2018. Memorandum, 16 pages. Read online or download the PDF.
- Subject
- Geography
- Grade
- Grade 12
- Document type
- Memorandum
- Year
- 2018
- Paper
- 2
- Publisher
- IEB
- Curriculum
- IEB
- Pages
- 16
- File size
- 1.5 MB
Loading document…
Loading document…
1 of 16
Document textSearch extracted text and jump to a page.
Downloaded from hlayiso.com
NATIONAL SENIOR CERTIFICATE: GEOGRAPHY: PAPER II – MARKING GUIDELINES Page 2 of 16
Figure 1: Location Map of Bethlehem in the Free State
Bethlehem has grown rapidly as a service
Bethlehem has grown rapidly
as a service centre with a good
rail and road network connecting it
to Johannesburg, Harrismith and
Bloemfontein.
The area boasts fertile land with wheat
as a major crop.
The town lies at an altitude of 1 700 m
and this contributes to its cooler
climate with frosty winters and mild
summers.
[Source: Examiner's description]
QUESTION 1 ATLAS USE, MAP ORIENTATION AND TECHNIQUES
1.1 Refer to the location map above (Figure 1), as well as the topographic map
extract 2828 AB and 2828 AD to answer the questions that follow. Tick the
correct box.
1.1.1 The province labelled A in Figure 1 above is …
Limpopo X
North West
Gauteng
Mpumalanga
1.1.2 The neighbouring country labelled B in Figure 1 above is …
Swaziland
Mozambique
Lesotho X
Zimbabwe
1.1.3 Johannesburg is … of Bethlehem.
NE
NW
NNW X
NNE
IEB Copyright © 2018 PLEASE TURN OVER
Downloaded from hlayiso.com
NATIONAL SENIOR CERTIFICATE: GEOGRAPHY: PAPER II – MARKING GUIDELINES Page 3 of 16
1.1.4 The approximate distance from Bethlehem to Johannesburg is …
(use Figure 1).
200 km
225 km
275 km X
300 km
1.1.5 (a) The Ballyduff smallholdings (D4) rely on underground water
for irrigating their crops.
True X
False
(b) Justify your answer to Question 1.1.5 (a).
There are a number of windmills to pump underground water.
The reservoirs are too small to hold enough water. There is
only a small nonperennial stream that runs through the area.
NOTE: FALSE can be accepted provided the justification is
correct, i.e. they don’t rely on underground water because
there is the Saulspoort Dam to supply water for irrigation OR
because of the numerous small dams.
IEB Copyright © 2018 PLEASE TURN OVER
Downloaded from hlayiso.com
NATIONAL SENIOR CERTIFICATE: GEOGRAPHY: PAPER II – MARKING GUIDELINES Page 4 of 16
1.2 Photograph 1 was taken on the outskirts of Bethlehem on the R26 toward
Retief and Warden.
Photograph 1
[Source: Examiner's photograph]
1.2.1 Study positions 1, 2, 3 and 4 on R26 on the topographic map extract.
At which position was the photographer standing? Tick the correct
option.
1
2 X
3
4
1.2.2 Account for your answer to Question 1.2.1 using evidence from the
topographic map extract.
The powerlines that run to the top of the hill are evident on the map
as well as in this photo. The communications tower as well as the top
of Bird Cage Hill are almost directly opposite from where the picture
was taken. There is a built up area of low cost housing visible in the
left photo. Any one answer.
1.2.3 State the direction in which Photograph 1 was taken.
East, East South East or Southeast (accept acronyms)
IEB Copyright © 2018 PLEASE TURN OVER
Downloaded from hlayiso.com
NATIONAL SENIOR CERTIFICATE: GEOGRAPHY: PAPER II – MARKING GUIDELINES Page 5 of 16
1.2.4 (a) Determine whether the diggings (D4) are visible from where the
photographer stood.
Yes
No X
Answer can be YES or NO, based on 1.2.4b’s
justification, see below in 1.2.4b
(b) Using evidence from the topographic map extract, account for your
answer to Question 1.2.4 (a).
Bird Cage Hill is clearly an obstacle in the way.
The following variations of 1.2.4a and b can be accepted.
If position 1.2.1 is …
4 – Yes, it is visible, nothing physical in the way
3 – Yes, it is visible, top of a hill and can be seen
1 – No, built up area in the way
If any of these answers are given reference must be made to position
given in 1.2.1 and justification must be correct.
1.2.5 Refer to Figure 2.
Figure 2: The gradient from A to B in Photograph 1
Using the data in Figure 2, calculate the gradient between A and B.
(a) Gradient: 1 : 8,3 (accept 8,25 or 8, only 1 mark)
Calculations:
Difference in height: 1 735 –1 671 = 64 m
IEB Copyright © 2018 PLEASE TURN OVER
Downloaded from hlayiso.com
NATIONAL SENIOR CERTIFICATE: GEOGRAPHY: PAPER II – MARKING GUIDELINES Page 6 of 16
Distance between the two points: 528 m
HS 1 : 10 000
Gradient =
VS 1 : 2 000
(1 method mark can be allocated in the calculation for a CORRECT
method, no mark awarded for a formula only).
(b) Circle the word that best describes the slope shown in Figure 2.
Concave convex flat gentle steep very steep
1.3 Geographic techniques and orthophoto interpretation
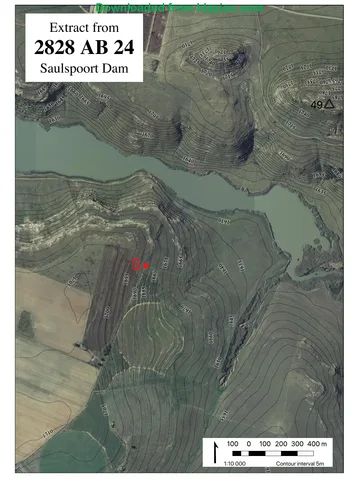
1.3.1 Study the orthophoto map extract 2828 AB 24 SAULSPOORT DAM.
This area is covered by the purple square drawn on the topographic
map extract.
Draw a cross section on the graph paper below from position S (E8)
north of Coenana Farm to trigonometric station 49 at 1 784,4 m
(D8 and D9). A vertical scale of 1 cm : 20 m has been provided for
you.
This will be inserted onto graph paper.
If candidates drew a cross section using the topographic map and alternative cross
section is provided. This is on the following page.
Start and end points MUST be at the rights height – 2 marks,
Orientation of S to trig station 49 – 1 mark,
Shape must show down, a valley and then steeply up the other side – 3 marks
IEB Copyright © 2018 PLEASE TURN OVER
Downloaded from hlayiso.com
NATIONAL SENIOR CERTIFICATE: GEOGRAPHY: PAPER II – MARKING GUIDELINES Page 7 of 16
1.3.2 Fill in and label the position of the following on the cross section:
the Saulspoort Dam
any road
1.3.3 Determine the vertical scale of the cross section as a ratio.
1 : 2 000
1.3.4 Calculate the vertical exaggeration of the cross section.
5 times. Alternatively if c/s was drawn on 1:50000
(above) 25 times is the correct answer.
Calculations:
HS 1 : 10 000
VS 1 : 2 000
= 5 times
If there is a mistake in 1.3.3 and it is carried through here and the
correct method is used –1 mark can be allocated. A formula only
does not constitute a mark. There must be a method.
IEB Copyright © 2018 PLEASE TURN OVER
Downloaded from hlayiso.com
NATIONAL SENIOR CERTIFICATE: GEOGRAPHY: PAPER II – MARKING GUIDELINES Page 8 of 16
1.4 Photograph 2 is of a scene simulating landing a plane at Bethlehem
Aerodrome/Airport (E3 and E4). This picture shows the southern runway,
Runway ONE on the topographic map extract. Photograph 3 shows the
landing fees at Bethlehem Aerodrome/Airport.
Photograph 2 Photograph 3
[Source: <https://flyawaysimulation.com>] [Source: Examiner's photograph]
A pilot is completing the preflight information that is needed to program into
the light aircraft's (weighing 2 400 kg) GPS navigation system. Complete
the preflight checklist below with the information needed to make a
successful flight. SIX local flights will be completed during the day.
1.4.1 Number of runways at 2
Bethlehem Aerodrome/Airport
1.4.2 The landing cost of six trips today R90 × 6 = R540
1.4.3 Bearing of Runway ONE (landing 96° 28' (accept 94°–98°)
in an easterly direction)
1.4.4 The magnetic declination for Change is 3' W pa
Difference in years – 2018–2010 –
2018 is …
8 yrs … = 8 × 3' = 24' change
Calculations: (1 method mark can be allocated here if
this calculation is correct)
21° 04' W of TN in 2010
24' W change
= 21° 28'W of TN in 2018
1.4.5 Magnetic bearing for a pilot to 96 + 21 = 117°
Follow through from 1.4.3 means range
land on Runway ONE in 2018 can be from 115–119, 1 method mark can
would be … be awarded if figures used show correct
method.
1.4.6 Co-ordinates of the eastern end S – 28° 14' 56" (accept 54"–58")
of Runway ONE to enter into the
GPS E – 28° 30' 31" (accept 29"–33")
If minutes are incorrect then position is
incorrect and no further marks can be
awarded.
IEB Copyright © 2018 PLEASE TURN OVER
Downloaded from hlayiso.com
NATIONAL SENIOR CERTIFICATE: GEOGRAPHY: PAPER II – MARKING GUIDELINES Page 9 of 16
QUESTION 2 FLUVIAL PROCESSES, CLIMATE AND GEOGRAPHIC
INFORMATION SYSTEMS
2.1 Study the Fact File and Photograph 4 of the Saulspoort Dam below.
Fact File: Photograph 4
Saulspoort Dam supplies Bethlehem with
domestic water. The water level when
the dam is full is at 1 627,3 m above sea
level.
The dam wall is in block D5. The water
exits north into block C5.
[Source: Department for Water Affairs]
2.1.1 Using information from the topographic map extract and Photograph
4 estimate from the options below what the correct bottom level is.
Hint: bottom level is the lowest point of the dam along the original
river course.
1 415 m
1 523 m
1 616 m X
1 640 m
2.1.2 Using evidence from Photograph 4, substantiate why the dam is at
full capacity.
You can see the water flowing over the dam wall and down the sluices.
IEB Copyright © 2018 PLEASE TURN OVER
Downloaded from hlayiso.com
NATIONAL SENIOR CERTIFICATE: GEOGRAPHY: PAPER II – MARKING GUIDELINES Page 10 of 16
2.2 Study the satellite photograph of the river below and the map extract of the
area just north of the dam wall and the Skulpspruit Farm in C5 and C6
indicated by Y on the photograph.
Photograph 5: Skulpspruit Farm; Bethlehem
[Source: Google Earth]
2.2.1 What type of fluvial feature is evident at X in Photograph 5? Tick the
correct option.
Waterfall
Meander X
Oxbow lake
Paired terraces
2.2.2 (a) Is the river at peak flow in this image? Circle the correct
answer.
YES / NO (yes can be accepted provided justification below in
(b) is correct.
(b) Substantiate your answer with evidence from Photograph 5
and the topographic map extract.
The water lines are way below the level of the floodplain as
indicated by the tree line. The actual river channel is a very
narrow line compared to the floodplain which is covered by
IEB Copyright © 2018 vegetation. PLEASE TURN OVER
Downloaded from hlayiso.com
NATIONAL SENIOR CERTIFICATE: GEOGRAPHY: PAPER II – MARKING GUIDELINES Page 11 of 16
Reference could be made to the dam upstream controlling the
flow of the river and therefore it isn’t at peak flow.
If the answer is YES to 2.2.2a then substantiation is as
follows:
The floodplains appear dark due to riparian vegetation. This
darkness makes it appear to be well watered and full. The
presence of marshes and swamps would indicate that it is full.
2.3 Describe why the farm buildings at Skulpspruit (located at Y on
Photograph 5) are located in an ideal microclimatic position.
The farm, at 1 660 m, is located away from the frost pocket at the bottom
of the valley at 1 620 m. The farm will experience katabatic winds at night
but, because of its location in the thermal belt, it will be warmer, especially
on the "cold frosty nights" (fact file). The farm is situated on the North
facing and therefore, warmer slopes. The water in the river has a
moderating effect on the temperature.
NO reference can be made to site factors, answer specifically referred to
microclimatic factors.
2.4 Study the tributaries of the Liebenbergsvlei River in blocks F11 and F12 of
the topographic map extract. Figure 3 is a GIS-generated map of the same
area showing the rivers and erosion.
IEB Copyright © 2018 PLEASE TURN OVER
Downloaded from hlayiso.com
NATIONAL SENIOR CERTIFICATE: GEOGRAPHY: PAPER II – MARKING GUIDELINES Page 12 of 16
Figure 3
2.4.1 Calculate the area of the drainage basin indicated by the dotted line
in Figure 3.
Area: m2
Calculations:
Roughly 30 squares at (200 m × 200 m = 40 000 m2) = 1 200 000 m2
Accept any number of blocks from 28 (1 120 000 m2) to 32
(1 280 000 m2)
If other, less accurate methods are used and answers range from
1 000 000 to 1 100 000 or 1 300 000 to 1 400 000 = 2 marks for
answer.
2.4.2 Circle the type of data evident on this GIS-generated map (Figure 3).
Vector Raster
IEB Copyright © 2018 PLEASE TURN OVER
Downloaded from hlayiso.com
NATIONAL SENIOR CERTIFICATE: GEOGRAPHY: PAPER II – MARKING GUIDELINES Page 13 of 16
2.4.3 Circle THREE types of attribute data that best describe the
Liebenbergsvlei River tributaries found in blocks F11 and F12.
Perennial Non-perennial Episodic Periodic
Exotic Dendritic Parallel Haphazard
2.4.4 Give ONE possible reason for the erosion evident in F11.
Cattle may have caused degradation of soils and, after heavy
rainfall, water removes topsoil.
Slope is steep giving water more erosive capability.
Slope may not be vegetated meaning topsoil is washed away.
Underlying rock may be impermeable creating lots of runoff and
therefore erosion.
Poor farming methods result in erosion.
Water flowing quickly giving it more erosive capability.
NO marks awarded for reference to heavy rainfall only or flooding
only.
2.4.5 A dotted line shows the drainage basin of this system in Figure 3.
Define the term drainage basin.
An area drained by a river and all of its tributaries. NO reference
made to a catchment area.
2.5 Circle the correct underlined word to complete the sentence below.
The drainage density of the stream network in Figure 3 could be described
as high / medium / low and the river's texture could be described as
medium / coarse / fine.
2.6 2.6.1 Tabulate the stream orders of the drainage basin in Figure 3 in the
table below.
Stream order 1 2 3
Number of streams 15 5 1
IEB Copyright © 2018 PLEASE TURN OVER
Downloaded from hlayiso.com
NATIONAL SENIOR CERTIFICATE: GEOGRAPHY: PAPER II – MARKING GUIDELINES Page 14 of 16
2.6.2 Comment on how stream ordering can be used as a predictor of
flooding.
There are many (15) order-1 streams that will feed water into order-2 and
order-3 streams quite quickly and there may be flooding in their areas.
There is a relatively short distance between the order-1 and order-3
streams so the area is prone to erosion as a result of frequent flooding.
Lots of order-1 streams = higher chance of flooding.
Alternatively
Less order-1 streams = less likely chance of flooding
Higher bifurcation ratio = higher chance of flooding
NOT reference to many higher order streams = more chance of flooding
IEB Copyright © 2018 PLEASE TURN OVER
Downloaded from hlayiso.com
NATIONAL SENIOR CERTIFICATE: GEOGRAPHY: PAPER II – MARKING GUIDELINES Page 15 of 16
QUESTION 3 SETTLEMENT AND THE ECONOMY
Study the topographic map extracts in Figures 4 and 5 below.
Figure 4 – Land use around Loch Lomond Figure 5 – Land use around Loch Lomond
3.1 Refer to the map extracts above. Which is the more recent map of the area,
Figure 4 or Figure 5? Explain your answer.
Figure 4 is more recent. There is development of infrastructure (most
noticeably housing in Bohlokong) that would have happened in the past
20 years. Vegetation was cleared in the development of Bohlokong.
Reference could have been made to the dam becoming bigger too.
IEB Copyright © 2018 PLEASE TURN OVER
Downloaded from hlayiso.com
NATIONAL SENIOR CERTIFICATE: GEOGRAPHY: PAPER II – MARKING GUIDELINES Page 16 of 16
3.2 Referring to Figure 4, draw a land-use sketch map for the area in
Bethlehem. Use the template provided below. It must have a legend or key.
Legend or Key
Features Symbol
Railway lines
Roads
Bodies of water
Buildings (use topographic symbology)
Other features
2 marks for railway (1 for accuracy, 1 for complete and there)
2 marks for roads (1 for accuracy, 1 for complete and there)
2 marks for bodies of water (1 for accuracy, 1 for complete and there)
1 mark for buildings
1 mark for other features
1 mark for complete legend
2 mark overall presentation (use of colour, neatness)
If the incorrect area of Bethlehem (e.g. blocks D/E 1/2) was drawn, a maximum of
TWO marks can be awarded for the presentation of the map.
Total: 100 marks
IEB Copyright © 2018
Study this subject
Revise the topics in this paper, then practise them question by question.
- Grade 12 Geography notes
CAPS revision notes with worked examples.
- Geography questions by topic
Past exam questions sorted by CAPS topic, with memos where available.
- Grade 12 Geography quizzes
Short topic quizzes with instant feedback.
- All Grade 12 Geography past papers
Past papers by year, with memos where available.
- Grade 12 IEB past papers
More Geography and other subjects in this collection.
Recommended for this subject
More papers and memos for this grade and subject.
MemorandumIEB
Geography Grade 12 IEB Paper 1 2019 Memo
MemorandumIEB
Geography Grade 12 IEB Paper 2 2019 Memo
MemorandumIEB
Geography Grade 12 IEB Paper 1 2018 Memo
MemorandumIEB
Geography Grade 12 IEB Paper 1 2018 Memo
MemorandumIEB
Geography Grade 12 IEB Paper 1 2017 Memo
MemorandumIEB
Geography Grade 12 IEB Paper 2 2017 Memo
Related documents
Question paperIEB
Geography Grade 12 IEB Paper 2 2018 Question Paper
Question paperIEB
Geography Grade 12 IEB Paper 2 2018 Question Paper
MemorandumIEB
Geography Grade 12 IEB Paper 2 2016 Memo
Question paperIEB
Geography Grade 12 IEB Paper 1 2018 Question Paper
AddendumIEB
Geography Grade 12 IEB Paper 1 2018 Addendum
Question paperIEB
Geography Grade 12 IEB Paper 2 2019 Question Paper
More from Grade 12 Geography
Question paperIEB
Geography Grade 12 IEB Paper 1 2019 Question Paper
Question paperIEB
Geography Grade 12 IEB Paper 1 2019 Question Paper (Afrikaans)
Question paperIEB
Geography Grade 12 IEB Paper 1 2019 Question Paper (Afrikaans)
Question paperIEB
Geography Grade 12 IEB Paper 2 2019 Question Paper (Afrikaans)
Question paperIEB
Geography Grade 12 IEB Paper 2 2019 Question Paper (Afrikaans)
Question paperIEB