
Downloaded from hlayiso.com
NATIONAL SENIOR CERTIFICATE EXAMINATION
NOVEMBER 2016
GEOGRAPHY: PAPER I
MARKING GUIDELINES
Time: 3 hours 300 marks
These marking guidelines are prepared for use by examiners and sub-examiners,
all of whom are required to attend a standardisation meeting to ensure that the
guidelines are consistently interpreted and applied in the marking of candidates'
scripts.
The IEB will not enter into any discussions or correspondence about any marking
guidelines. It is acknowledged that there may be different views about some
matters of emphasis or detail in the guidelines. It is also recognised that,
without the benefit of attendance at a standardisation meeting, there may be
different interpretations of the application of the marking guidelines.
IEB Copyright © 2016 PLEASE TURN OVER
Skip to contentMemorandum 






View all

Geography Grade 12 IEB Paper 1 2016 Memo
IEB Grade 12 Geography Paper 1 memorandum from the 2016, 17 pages. Read online or get the free PDF download, question paper linked when available.
Publisher: IEB
Geography · Grade 12 · 2016. Memorandum, 17 pages. Read online or download the PDF.
- Subject
- Geography
- Grade
- Grade 12
- Document type
- Memorandum
- Year
- 2016
- Paper
- 1
- Publisher
- IEB
- Curriculum
- IEB
- Pages
- 17
- File size
- 376.9 KB
Loading document…
Loading document…
1 of 17
Document textSearch extracted text and jump to a page.
Downloaded from hlayiso.com
NATIONAL SENIOR CERTIFICATE: GEOGRAPHY: PAPER I – MARKING GUIDELINES Page 2 of 17
SECTION A GEOGRAPHICAL ISSUES
QUESTION 1 GEOGRAPHICAL CASE STUDY: SOUTH PENINSULA
REGION, CAPE TOWN
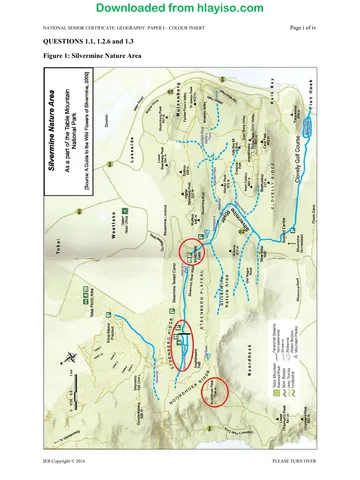
1.1 Map work and map interpretation skills
1.1.1 Western Cape province
1.1.2 M64
1.1.3 Constantiaberg (1 mark) – 928 metres (1 mark)
1.1.4 Natural features include:
• Steenberg Ridge
• Silvermine River
• Waterfall
Atlantic Ocean
• Hennies Pool
• Elephant's Eye cave
• Wolfkop/ Higher Steenberg Ridge, Steenberg Plateau
Human constructed features:
• Silvermine Dam/ Old Dam/ Dam wall
• Toilet facilities
• Picnic site/ Tokai picnic site
• Silvermine tented camp
• Parking lot
• Any path
• Any road
• TMNP head office
• Silvermine Gate
(Credit any correct answer)
1.1.5 Map distance = 5 cm
Distance one way = 2,27 km
Total hike distance = 4,54 km (Range 4,20–4,80 km)
1.1.6 Picnics
Camping
Swimming (Silvermine Dam)
Mountain biking
Birdwatching
Mountain climbing, possibly fishing
Horse riding
Trail running
Sunbird Centre
Dog walking
Cycling
Photography
Sightseeing
Water sports
[NOT GOLF]
Other: credit any correct answer
IEB Copyright © 2016 PLEASE TURN OVER
Downloaded from hlayiso.com
NATIONAL SENIOR CERTIFICATE: GEOGRAPHY: PAPER I – MARKING GUIDELINES Page 3 of 17
1.2 Climate and weather
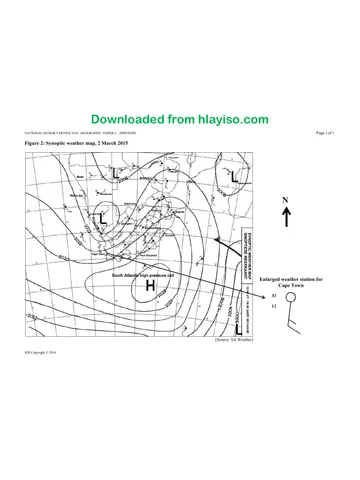
1.2.1 The South Atlantic HP cell has ridged towards the east. Traditionally this
system remains within the south-westerly region of the country during the
summer months. South Atlantic HP is positioned in the Indian Ocean. There
is also the presence of a cold front far north – around 30 °S.
1.2.2 End of summer (early March), high air temperatures – upper 20–30 °C. This
leads to rising and expanding air, and hence LP conditions. Presence of a
heat low, convection low/ thermal low.
1.2.3 (a) Southerly direction, also accept SSW, SSE, and SE.
(b) • South Atlantic HP is prevalent over the SE part of South Africa.
• An LP system is located over the western coastal area of
southern Africa – around Lüderitz, in Namibia.
• A PGF exists between these two pressure systems. Air will move
from the HP towards the LP system, resulting in strong onshore
southerly winds.
• Evidence of 15–25 knot south-south-easterly winds is seen from
Cape Town up the coast towards PE.
(2 distinct points must be mentioned. HP and LP systems must be
pointed out and the movement of air between these two systems
creating the southerly/ SW and SE winds)
• Steep pressure gradient, isobars are close together, less friction
over the ocean.
1.2.4 • air temperature = 33 (1 mark) °C (1 mark).
• wind direction and speed = southerly wind, SSW wind (1 mark),
15 knots (1 mark).
• no rainfall (2 marks) due to clear skies and large difference between air
and dew point temperatures.
1.2.5 (a) Raster data consists of a matrix of cells (or pixels), or blocks of
colour organised into rows and columns (or a grid) where each cell
contains a value representing information. Photographs 1 and 2 are
both images that are made up of pixel data and hence are forms of
raster data.
(b) Photo 1 is an infrared short-wave satellite image (artificial/ thermal
image), which has the ability to see through smoke. The infrared
capability allows vegetation to be seen more clearly and hence the
areas of fire damage. Due to the heat emitted, burning fires are also
visible. (2 marks)
Photo 2 is basically an aerial photograph from a high altitude
(natural/ optical or true colour image), where less detail is seen. The
image is also obscured due to the presence of the smoke. (2 marks)
IEB Copyright © 2016 PLEASE TURN OVER
Downloaded from hlayiso.com
NATIONAL SENIOR CERTIFICATE: GEOGRAPHY: PAPER I – MARKING GUIDELINES Page 4 of 17
(c) • Which residential areas are most vulnerable to fires, and hence
which communities may need to evacuate their homes.
• Monitoring the wind direction by looking at the smoke; this may
assist disaster planners to understand the spread of fire.
• The scale of the damage is more easily seen – useful for working
out disaster management funding and budget requirements.
• Indicates terrain – influences accessibility of fire fighters.
(Any 2 appropriate points)
1.2.6 SURFACE RUNOFF (2 marks)
• Likely to increase after winter rainfall due to the destruction of
vegetation and therefore less interception.
• Localised flooding and soil erosion are consequences.
• Less infiltration; more run-off.
• Siltation of rivers or dams
• Runoff may contain ash
LOCAL ECONOMY AND TOURISM
Destruction of natural environment – impact on tourism: (2 marks)
• Destruction of the natural fynbos vegetation in the Table Mountain
National Park.
• Smoke damage and pollution.
• Possible soil erosion, rock falls due to destruction of vegetation along
mountain paths and steep cliff areas.
Implications on the local economy: (2 marks)
• Massive fire-fighting efforts – over 2 000 people involved.
• Costly use of helicopters (26 craft) to drop water.
• Closure of roads.
• Closure of the National Park.
• Impact on big sports events: Argus Cycle Race and Two Oceans
Marathon.
• Damage to homes and other properties – big insurance claims.
• Overall decrease in tourism/ less income/ business affected.
• Destruction of vineyards/ forestry
(Credit any relevant points)
1.3 Drainage systems, river catchment and management
1.3.1 Noordhoek Ridge Mountains/ Steenberg Ridge
1.3.2 Fish Hoek
1.3.3 • Silvermine Dam, and
• Waterfall
• Hennies Pool
• Wetlands
• Confluence of tributaries
IEB Copyright © 2016 PLEASE TURN OVER
Downloaded from hlayiso.com
NATIONAL SENIOR CERTIFICATE: GEOGRAPHY: PAPER I – MARKING GUIDELINES Page 5 of 17
1.3.4 (a) The Silvermine Nature Area has a high runoff during the winter
months.
(b) The Silvermine River is likely to have a narrow-V-shaped in its
upper course.
(c) The Silvermine River has a low/ medium stream density.
1.3.5 • Fertilisers and irrigation from the Clovelly Golf Course
• Urban community of Fish Hoek (litter/ toxic waste thrown into the river)
• Dams upstream could reduce flow of water.
• Pollution from local settlements
• Mining pollution (Silvermine), AMD, Climate change
• Drought
• Rising sea level and therefore increase in salinity
• Sedimentation from upstream erosion
• Fires affect wetlands
(Any 2 relevant points)
1.4 Urban structure, planning, hierarchies and local economic opportunities
1.4.1 (a) Rural-urban fringe
(b) Forestry (1 mark) and horse-riding (1 mark)
(c) Planned
(d) Density
(e) Informal
1.4.2 Located within a largely residential (suburban) area – Sun Valley – and
serves this region.
1.4.3 • Located at the bottom of the M64, at the intersection with Noordhoek
Road (M6).
• Available land, cost of land, population density.
• Flat in relation to the surrounding mountainous area.
• Serves a broad community: Noordhoek, Sun Valley, Sunnydale.
1.4.4 (a) • High order.
• Gym contracts are expensive, a luxury service, not considered a
basic need.
(b) The area from which a service draws its customers.
(c) Sphere of influence would be large (2) – due to the fact that it is a
high-order service that is expensive. It would draw on a larger
threshold population and hence a larger sphere of influence.
Description from map – includes Sun Valley, Sunnydale.
IEB Copyright © 2016 PLEASE TURN OVER
Downloaded from hlayiso.com
NATIONAL SENIOR CERTIFICATE: GEOGRAPHY: PAPER I – MARKING GUIDELINES Page 6 of 17
1.4.5 • Mall developments need to be in line with the greening of urban areas,
which is a global trend (winning of many awards, remediation of carbon
emissions).
• Legislation
• Developments should be opting to be more sustainable and eco-friendly.
• Electricity and resource costs continue to rise; developments need to be
smart in this regard.
• Malls need to become energy efficient (reduction in electricity
consumption, shifts towards renewable energy), adopt recycling
programmes and have such facilities available, encourage the use of
alternative forms of transport, include garden, green zones and roof top
gardens etc.
• The Sun Valley Mall refurbishment project has included the following
eco-friendly design principles:
• Materials have been used to effectively reflect heat and energy and also
minimise the impact of the heat island effect.
• Natural resources can be effectively used to create natural light and solar
energy can also be harnessed for powering geysers as an example.
• Climate change
• Reduction on the carbon foot print, reduce carbon tax
• SA is a water scarce country, therefore water must be used sparingly and
saved
(Credit any relevant point)
Why = 2 marks
Explain = 6 marks
IEB Copyright © 2016 PLEASE TURN OVER
Downloaded from hlayiso.com
NATIONAL SENIOR CERTIFICATE: GEOGRAPHY: PAPER I – MARKING GUIDELINES Page 7 of 17
SECTION B CLIMATE, WEATHER, AND GEOMORPHOLOGY
QUESTION 2 TROPICAL CYCLONES, MID-LATITUDE CYCLONES,
CLIMATE CONCEPTS, URBAN AND VALLEY CLIMATES,
DRAINAGE SYSTEMS AND FLUVIAL PROCESSES
2.1 Tropical cyclones: Hurricane Patricia
2.1.1 15 storms
2.1.2 • Warmer ocean (2) – explanation: likely to have been above 27 °C due to
the warming effects of El Niño (2)
• Extreme low pressure (2) – explanation: low pressure was recorded at
879 mb; very low pressure is associated with rapidly rising air and very
unstable conditions, which would have been responsible for the heavy
rain and strong winds (2)
• A variety of more textbook based responses are acceptable:
• Areas of development between 5°–30° N and S of the equator.
• Wide area of LP with some close isobars.
• Developed along the west coast.
• Light and variable winds to allow for the formation of a vortex.
• [Any other appropriate answer]
2.1.3 Weather conditions: build-up to Weather conditions: arrival of
hurricane hurricane
Continuous rain, winds Very strong winds – 270 km/ hr
(tropical storm conditions) Torrential rain – 201 mm in 24 hours
Air pressure ± 900 mb Storm surges
Air pressure ± 879 mb, or very LOW
2 marks pressure
2 marks
2.1.4 Homes:
Trees may have collapsed, damaging roofs, electric cabling
Smashed windows
Telephone lines down
Collapsed gutters – due to quantity of rain
Collapsed walls, fences, structures
Flooded homes – especially low lying/ coastal areas
Water supply cut off/ contaminated
Farmland:
Saturated/ flooded lands destroying crops
Collapsed trees
Animals may have drowned
Equipment damaged (farm implements, harvesters, dairies, storage barns)
(Any 3 suitable points, at least 1 for housing and 1 for farmland)
2.2 Mid-latitude cyclones and synoptic weather map interpretation
2.2.1 A = South Atlantic high pressure (2 marks)/ anticyclone (1 mark); St Helena
HP/ only HP (1 mark)
B = South Indian high pressure (2 marks)/ anticyclone/ HP (1 mark)
C = Cold front
IEB Copyright © 2016 PLEASE TURN OVER
Downloaded from hlayiso.com
NATIONAL SENIOR CERTIFICATE: GEOGRAPHY: PAPER I – MARKING GUIDELINES Page 8 of 17
2.2.2 (a) On this particular chart, the cut-off low is wedged in between the
cold front system to the west (2) and the South Indian HP to the
east (2).
(b) Continuous rain/ heavy rain, with a threat of floods/ strong winds.
2.3 Satellite image interpretation
Multiple choice
2.3.1 B
2.3.2 A
2.3.3 B
2.3.4 C or A
2.3.5 D
2.4 Urban climate
2.4.1 • The graph indicates that the areas that are more developed and built up,
e.g. Johannesburg, Pretoria and Rustenburg, have a lower temperature
range.
• There is little discrepancy in day time temperatures, all of which are
around 28–30 °C.
• Less built-up areas of the Cradle of Humankind and Mooinooi have a
higher temperature range.
• Summer temperatures are all over 25 °C.
• There is a large temperature range for January.
2.4.2 • Cradle of Humankind approximately 17 °C. (2)
• This area is a rural World Heritage Site. The Cradle area is a nature
reserve and has an abundance of grassland and trees. There is little urban
development. As a result when the sun sets, there will be greater
terrestrial radiation and little contribution of re-radiated heat from
buildings or pollutants within the immediate atmosphere. (2)
• Any factor that explains why rural areas will be cooler
2.4.3 • Planting trees
• Creating green belts (more parks/ green areas/ roof top gardens).
• Incorporating more bodies of water into the area (e.g. small dams,
fountains).
• Using natural building materials (stone, wood). Light building materials
to reflect heat.
• Sustainable energy (solar and wind power).
• Reducing vehicle emissions through encouraging car pools, cycling, use
of public transport, etc.
• Filters on chimneys, regulations regarding emissions for industrial areas.
• Paint roof areas white
• Build roads out of concrete, not tar
• Fine people who do not adhere to regulations
• Build factories towards the outskirts of town
(Any 3 appropriate points)
IEB Copyright © 2016 PLEASE TURN OVER
Downloaded from hlayiso.com
NATIONAL SENIOR CERTIFICATE: GEOGRAPHY: PAPER I – MARKING GUIDELINES Page 9 of 17
2.5 Valley climate within the Cradle of Humankind
2.5.1 Cool air will drain into the bottom of the valley at night (2); this is due to the
katabatic air flow due to gravity (2). Cooler, denser air will collect at the
bottom of the valley at night. In the early morning the valley has not
warmed up as yet.
Air cools through terrestrial radiation.
2.5.2 (a) Katabatic wind
(b) • Direction of air flow (2)
• Air pressure (2)
• General temperature of air (cool, dense – hence sinks) (2)
Night
HP
Wind
Katabatic wind
LP
The mountain cools down; the air
becomes heavier so it descends.
IEB Copyright © 2016 PLEASE TURN OVER
Downloaded from hlayiso.com
NATIONAL SENIOR CERTIFICATE: GEOGRAPHY: PAPER I – MARKING GUIDELINES Page 10 of 17
2.6 Drainage systems and fluvial processes
2.6.1 Magaliesberg Mountain Range
2.6.2 (a) (2 marks) Rectangular-tributaries have right-angle bends along their
course.
There are relatively few tributaries and rivers within the basin as indicated
on the map, hence the low drainage density and coarse texture. Tributaries
join main river at right angles.
Provide an explanation for either pattern or texture (2 marks)
2.6.3 When a river displays a superimposed drainage pattern, it encounters older
rock layers (2) below the surface due to vertical erosion. The river is able
to maintain its course (2). The landscape is older than the river.
2 marks for use and inclusion of correct diagram. Before and after situation
is not necessary to include. Candidates must indicate that the river flows
through older rock layers (2), and the river has maintained its original
course (2).
Drawing = 2 marks
Explanation or detailed labels = 4 marks
IEB Copyright © 2016 PLEASE TURN OVER
Downloaded from hlayiso.com
NATIONAL SENIOR CERTIFICATE: GEOGRAPHY: PAPER I – MARKING GUIDELINES Page 11 of 17
2.6.4
Hydrograph curve A Hydrograph curve B
Catchment area 1: (2) Catchment areas 2: (2)
This curve is associated with a This curve indicates a lower
flash flood situation, due to the chance of flooding, due to
short lag time and high flood longer lag time and lower
peak. This situation indicates a flood peak.
drainage pattern whereby runoff Catchment area 2 is less developed,
reaches the river systems very with more open areas; runoff is likely
quickly. This is due to the fact to be less since there will be greater
that this catchment area is more infiltration. (2)
built up and will have more
roads and concrete surfaces
resulting in rapid runoff. (2)
2.7 Types of rivers
2.7.1 F
2.7.2 A
2.7.3 G
2.7.4 E
2.7.5 B
IEB Copyright © 2016 PLEASE TURN OVER
Downloaded from hlayiso.com
NATIONAL SENIOR CERTIFICATE: GEOGRAPHY: PAPER I – MARKING GUIDELINES Page 12 of 17
SECTION C RURAL AND URBAN SETTLEMENTS AND THE ECONOMY
OF SOUTH AFRICA
QUESTION 3 RURAL AND URBAN SETTLEMENTS, A CASE STUDY OF
IRON ORE MINING AND THE DURBAN–PINETOWN
INDUSTRIAL REGION
3.1 3.1.1 (a) The settlement shows a nucleated pattern.
(b) The main economic activity in the area forms part of the primary
sector.
(c) The settlement would be located on the north-facing slope.
3.1.2 There is evidence of outside pit latrines/ toilets provided – each homestead
has small zinc/ corrugated iron enclosure with ventilation pipe. Long drop/
sanitation.
3.1.3 (a) Residents would leave: unemployment – no jobs to provide an
income. Poor soil quality, poor farmland, environmental disasters
e.g. floods/ drought. No social activities, poor infrastructure.
Limited access to services such as healthcare and education.
Perceived jobs, education, social activities, better transport.
[Can be push and pull factors]
(Any suitable, relevant reason)
(b) Young men and women would leave; and the children and elderly
would be left behind.
Lack of manpower to farm may mean decline in productivity or loss
of food security. Poverty may increase. Social issues.
(Any suitable, relevant prediction)
3.2 3.2.1 Water – developed along the floodplain of the Berg River.
Flat land – along the valley floor of the Berg River.
Fertile soils – evidence of agriculture in the area.
3.2.2 (a) Linear settlement shape.
Ribbon, in a straight line (not nucleated as this is a pattern)
(b) According to the Fact File – developed between Paarl Mountain and
the Berg River – both linear features; as well as the fact that Main
Road is 10 km long.
The physical features – Berg River and Paarl Mountain form linear
barriers along which the town developed.
Straight road and railway line.
3.2.3 (a) CBD, Central business district.
(b) Building density. Building height.
Concentration of high-rise buildings.
Church steeple seen in the area.
Central
Grid iron street pattern
IEB Copyright © 2016 PLEASE TURN OVER
Downloaded from hlayiso.com
NATIONAL SENIOR CERTIFICATE: GEOGRAPHY: PAPER I – MARKING GUIDELINES Page 13 of 17
3.2.4 Close to the production site – raw-materials industry; reduces transportation
costs and time.
Close to the market – town.
Available space; good infrastructure, cheaper land.
Outskirts, away from residential areas to avoid nuisance factors
Along transport routes
Close to river
3.3 Terminology
3.3.1 F
3.3.2 G
3.3.3 D
3.3.4 H
3.3.5 A
3.4 Iron ore mining in South Africa
3.4.1 (a) Saldanha Bay and Richards Bay (1 mark each)
(b) Sishen (2 marks)–Postmasburg area of the Northern Cape/ Kathu
3.4.2 (a) Raw materials orientated industry
Where industry is located close to the raw materials to reduce
production costs as well as transportation costs.
(b) Beneficiation
A process where ores are processed (refined/ pre-processed) to add
value to the product before being exported. Metals and minerals are
converted into manufactured goods.
3.4.3 As 80% of our iron ore is being exported, the country is losing money on not
processing the ore and producing products that can then be exported. This
will affect the local economy – not putting value back into the GDP and this
cuts down on potential jobs. By producing steel, which is an alloy of iron
ore, metals are combined to give different steel products, which can in turn
be made into steel components for the construction industry. This leads to
economic growth (increased forex); and increase in the local economy
and to job creation.
3.4.4 They are not close by – for example at Newcastle; Saldanha Bay and
Vereeniging and Witbank. These are not iron-producing areas. However, as
steel is also made, it needs a variety of other raw materials, thus all raw
materials are transported to the factory.
So for example a factory is located where the raw materials can be brought
to the factory; not where only one of the ores is mined. Must refer to
location of factories in relation to mines.
IEB Copyright © 2016 PLEASE TURN OVER
Downloaded from hlayiso.com
NATIONAL SENIOR CERTIFICATE: GEOGRAPHY: PAPER I – MARKING GUIDELINES Page 14 of 17
3.4.5 (a) (i) 2011 – about US$170 (allow US$160–175)
(ii) 2015 – about US$70 (allow US$ 60–75)
(b) US$170–70 = US$100 difference or drop in price allow between
US$90–110. If (a) (i) and or (ii) incorrect, can get marks for method,
i.e. Carry over error.
(c) Iron ore mines will struggle to keep producing, particularly if they
are marginal mines (low-grade ore).
Jobs will be at stake – as the mines will start cutting back and large
scale retrenchment will increase unemployment rate.
Mines close and loss of forex.
(d) Because China's GDP is declining and the growth is slowing down,
less iron-ore will be needed. This will directly impact on the mines
as so much iron ore is exported to China.
This will have an impact on jobs in the mining sector and
retrenchments will occur.
The country should look at growth of the local industry and more
beneficiation should take place. OR Demand may increase in other
countries, e.g. emerging economies such as India – SA will then
benefit by exporting more to different regions.
3.5 Durban-Pinetown Industrial Region (KwaZulu-Natal – KZN)
3.5.1 Coastline means that development can only take place up and down the
coast or inland. Coast on one side and hilly topography to the West.
Semi-circle of development – but as most roads and transport routes
converge on the city and harbour, this leads to congestion.
3.5.2 The relocation of the airport to north of Umhlanga and the development of
Dube Tradeport as an industrial development zone (IDZ) has helped
reduce the congestion south of Durban. This also has a multiplier effect
around the IDZ – concentrating the logistics industry for more effective
trade. Development spread out from the core.
Creates a second loading point along the 'freight corridor' for the Free State
and Gauteng – will also reduce congestion in the harbour area.
Reduces pollution build up.
Spreads employment, wealth and skills.
IEB Copyright © 2016 PLEASE TURN OVER
Downloaded from hlayiso.com
NATIONAL SENIOR CERTIFICATE: GEOGRAPHY: PAPER I – MARKING GUIDELINES Page 15 of 17
ESSAY QUESTION
3.5.3 • Mention the benefits of industrial growth for the province.
Increases GGP/ GDP.
More employment opportunities, wealth and skills.
• Evaluate the important role of infrastructure to the success of this
industrial region.
Port means exporting and importing.
Break-of-bulk point – road and rail to shipping.
Has good links to the inland market of Gauteng – N2 and rail.
Markets of Asia and East Africa via the port.
Dube Tradeport, deep water harbour
Rail upgrades at Cato Ridge
Container port leads to more trade opportunities
Electricity supply
King Shaka airport
Expansion of the Toyota assembly plant
[Can also discuss negative impacts]
• Outline the kinds of manufacturing in this region
Using natural materials produced in the hinterland and processing before
export: sugar refining (Illovo & Hullets).
Wood from plantations – makes rayon – a silk-like fibre (textiles) for
clothing; pulping to make paper (Sappi and Mondi); wood chipping
before exporting.
Oil refining – crude oil is brought to Durban and piped to the refineries
to make petroleum products (Engen and Sapref)
Chemicals and Paint (AECI)
Car manufacturing/ assembly (Toyota)
Boat building
Computers (Mecer)
• Highlight some of the problems faced by this industrial region.
Congestion.
Pollution – collects in city bowl basin
Aging infrastructure
Climatic factors, e.g. humid air leading to oxidation and rust
HIV/ AIDS – impact on the workforce
Volatility of the Rand
Drought and flooding issues
Power outages and load shedding
Corruption within municipalities
High labour costs, labour strikes and unrest
Skills shortage and illiteracy
Various other socio-economic issues
(Accept other problems which may be relevant to the region)
IEB Copyright © 2016 PLEASE TURN OVER
Downloaded from hlayiso.com
NATIONAL SENIOR CERTIFICATE: GEOGRAPHY: PAPER I – MARKING GUIDELINES Page 16 of 17
(Level 3) (Level 2) (Level 1)
Criteria
Excellent – Good Satisfactory Poor
(4–5 marks) (3 marks) (0–2 marks)
Writing skills Suitable introduction and conclusion. Introduction and conclusion present, Writing is weak and almost
Sophisticated, coherent and structured although not ideal. unintelligible. No introduction or
writing. Attempts to adhere to subheadings and conclusion provided. No use/ adherence
• Taking into consideration structure and
Subheadings and paragraphs have been use of paragraphs. to subheadings. Long sentences, poor
presentation.
effectively used. Report deviates from the point in places grammar and ineffective use of
• Use of brief introduction and conclusion.
Report is concise, well-structured and and lacks brevity. paragraphs. Report is repetitive. Bullet
• Logical discussion and use of subheadings. succinct. points may have been used.
[5 marks allocated to this component] 1 = must be awarded for any form of
written attempt/ effort.
(14–12 marks) (11–7 marks) Digression from the topic.
Relevant content and detailed discussion Some relevant content. Weak grasp of concepts and
Content knowledge
of topic. An overview/ general discussion of key terminology.
Good usage of geographical terminology issues. Superficial/ poor discussion.
• Correct use of geographical terminology
and concepts. Basic usage of geographical concepts Almost no relevant facts/ subheading.
and concepts.
Appropriate number of facts presented/ and terminology.
• Adherence to topic and subheadings.
subheading. (60–50% of required facts presented/
[14 marks be allocated here]
Min of 2 points for every sub-heading subheading).
will earn candidate 12 marks. Extension 1 point/ sub-heading, or 2 points
work will provide a further 2 marks. provided and only 2 paragraphs.
(5–4 marks) (3 marks) (0–2 marks)
Supporting evidence – The candidate is able to argue and Superficial links made to case study/ Limited to no reference made to case
analysis and understanding evaluate appropriately. Fact File/ source material. study/ Fact File/ source material.
There is strong evidence of accurate Although reference to supporting Examples not provided.
• The ability to analyse and evaluate the application of understanding and examples has been made, it is not clear Has little to no geographical meaning.
topic is assessed in this category. evidence provided. that the candidate has a good Little analysis or understanding.
• Reference made to case study material/ Report demonstrates understanding and understanding of the example/ case Demonstrates minimal understanding of
Fact File/ source material provided. integration of relevant case study/ Fact study material. topic.
• If appropriate, reference must be made to File/ source material into the context of Supporting evidence does not always
familiar/ local or other examples. the report. relate appropriately to the subheading or
[5 marks allocated to this component] Looking for evidence of unpacking context of discussion.
content and high order integration. Discussion lacks depth.
Total: 300 marks
IEB Copyright © 2016 PLEASE TURN OVER
Downloaded from hlayiso.com
NATIONAL SENIOR CERTIFICATE: GEOGRAPHY: PAPER I – MARKING GUIDELINES Page 17 of 17
The following marking codes were used in the assessment of the essays
CONTENT
GEOGRAPHY ESSAY CODES
_____________Underline relevant points if correct
E – Excellent
G – Good Circle incorrect points
V – Vague EVIDENCE
R – Repetition Place in ( )brackets where candidates have used
I – Irrelevant evidence
F – Fair
IEB Copyright © 2016
Study this subject
Revise the topics in this paper, then practise them question by question.
- Grade 12 Geography notes
CAPS revision notes with worked examples.
- Geography questions by topic
Past exam questions sorted by CAPS topic, with memos where available.
- Grade 12 Geography quizzes
Short topic quizzes with instant feedback.
- All Grade 12 Geography past papers
Past papers by year, with memos where available.
- Grade 12 IEB past papers
More Geography and other subjects in this collection.
Recommended for this subject
More papers and memos for this grade and subject.
MemorandumIEB
Geography Grade 12 IEB Paper 1 2019 Memo
MemorandumIEB
Geography Grade 12 IEB Paper 2 2019 Memo
MemorandumIEB
Geography Grade 12 IEB Paper 1 2018 Memo
MemorandumIEB
Geography Grade 12 IEB Paper 2 2018 Memo
MemorandumIEB
Geography Grade 12 IEB Paper 1 2018 Memo
MemorandumIEB
Geography Grade 12 IEB Paper 1 2017 Memo
Related documents
Question paperIEB
Geography Grade 12 IEB Paper 1 2016 Question Paper
Question paperIEB
Geography Grade 12 IEB Paper 1 2016 Question Paper
AddendumIEB
Geography Grade 12 IEB Paper 1 2016 Addendum
MemorandumIEB
Geography Grade 12 IEB Paper 2 2016 Memo
MemorandumIEB
Geography Grade 12 IEB Paper 1 2017 Memo
Question paperIEB
Geography Grade 12 IEB Paper 2 2016 Question Paper
More from Grade 12 Geography
Question paperIEB
Geography Grade 12 IEB Paper 1 2019 Question Paper
Question paperIEB
Geography Grade 12 IEB Paper 1 2019 Question Paper (Afrikaans)
Question paperIEB
Geography Grade 12 IEB Paper 1 2019 Question Paper (Afrikaans)
Question paperIEB
Geography Grade 12 IEB Paper 2 2019 Question Paper
Question paperIEB
Geography Grade 12 IEB Paper 2 2019 Question Paper (Afrikaans)
Question paperIEB