
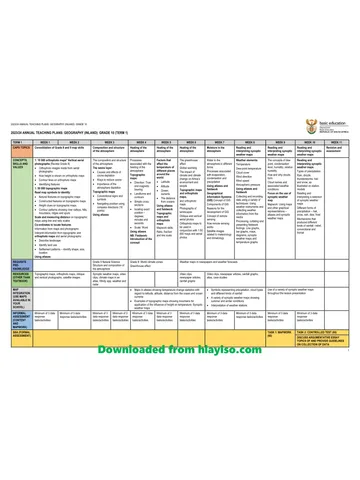
Downloaded from hlayiso.com
ASSESSMENT
FRAMEWORK
EXEMPLARS
GRADE 10
INDEX
ITEM PAGE NUMBER
1. CONTROLLED TEST 1 AND MG 2 - 14
2. CONTROLLED TEST 1 COGNITIVE
ANALYSIS 15
3. MAPWORK TASK AND MG 16 - 34
4. MAPWORK TASK COGNITIVE
ANALYSIS 35
5. ESSAY AND RUBRIC 36 - 46
6. MID-YEAR EXAMINATION AND MG 47 – 66
7. MID-YEAR EXAMINATION
COGNITIVE ANALYSIS 67
8. CONTROLLED TEST 2 AND MG 68 -82
9. CONTROLLED TEST 2 COGNITIVE
ANALYSIS 83
10. FINAL EXAMINATION P1 AND MG 84 – 110
11. FINAL EXAMINATION P1 COGNITIVE
ANALYSIS 111
12. FINAL EXAMINATION P2 AND MG 112 – 138
13. FINAL EXAMINATION P2 COGNITIVE
ANALYSIS 139
Skip to contentAll 2023 papers 
View all
Geography Grade 10 Gauteng March Test 2023 QP (Eng)
Grade 10 Geography question paper from the Gauteng March Test 2023 (English), 139 pages. Read online or get the free PDF download, memo linked when available.
Geography · Grade 10 · Gauteng March Test · 2023 · English. Question paper, 139 pages. Read online or download the PDF.
- Subject
- Geography
- Grade
- Grade 10
- Language
- English
- Document type
- Question paper
- Year
- 2023
- Exam period
- Gauteng March Test
- Curriculum
- CAPS
- Pages
- 139
- File size
- 6.6 MB
Free to read online, no sign-up needed
Loading document…
Loading document…
1 of 139
This exam
Gauteng March Test 2023
- Other filesQuestion paper · EngQuestion paper · Afr
Document textSearch extracted text and jump to a page.
Downloaded from hlayiso.com
GRADE 10 EXEMPLAR
SBA ITEM 1
CONTROLLED TEST 1
Downloaded from hlayiso.com
GAUTENG DEPARTMENT OF EDUCATION
EXAMPLER
2023
GEOGRAPHY
CONTROL TEST 1
QUESTION PAPER
GRADE 10
NUMBER OF PAGES : 7
Downloaded from hlayiso.com
INSTRUCTIONS AND INFORMATION
1. This Question paper consists of Five sub-sections.
2. Answer ALL the questions for 60 marks.
3. All diagrams / extracts are included.
4. Leave a line between subsections of questions.
5. Number the answers correctly according to the numbering used in the question
paper.
6. Do NOT write in the margins of the Answer sheet/ Folio paper
7. Where possible, illustrate your answers with labelled diagrams.
8. For paragraph questions you may refer to ONE idea which you must discuss in depth
OR you may refer to different ideas which you may discuss in less depth.
9. Write neatly and legibly.
Downloaded from hlayiso.com
1.1. Match the statements in Column A with the terms in Column B. Write only
the question number and the correct letter e.g., 1.1.11 K.
COLUMN A COLUMN B
1.1.1. The amount of water vapour in the air A Dew point
expressed as a percentage of the amount
needed for saturation of the same
temperature.
1.1.2. Transfer of energy in the form of long waves B Isotherm
1.1.3. A climate with moderate temperatures, due C Terrestrial
to the influence of the ocean Radiation
1.1.4. The temperature at which condensation D Leeward
begins
1.1.5. Lines on weather map joining places with E Sublimation
the same temperature
1.1.6. Process whereby water vapour turns into F Relative humidity
liquid when cooled
1.1.7. Process whereby water changes from ice to G Maritime
gas.
1.1.8. Rain shadow on this side of a mountain H Condensation
1.2. Possible answers are given to the description below. Choose the correct answer and
write only the letter (A – D) next to the question number (1.1.1 – 1.1.7)
1.2.1. The ratio between the amount of light falling on a surface and the
amount reflected is called.
A. Reflection
B. Libido
C. Albedo
D. Deception
1.2.2. This line on a map joins places with the same rainfall.
A. Isobar
B. Isomillimeter
C. Isotherm
Downloaded from hlayiso.com
D. Isohyet
1.2.3. The lowest layer of the atmosphere is the.
A. Thermosphere
B. Mesosphere
C. Troposphere
D. Stratosphere
1.2.4. The transfer of energy by means of contact is.
A. Conduction
B. Convection
C. Transmission
D. Radiation
1.2.5. This is one of the greenhouse gases.
A. Methane
B. Nitrogen
C. Oxygen
D. Argon
1.2.6. The ocean current on the East Coast of Africa is the:
A. Indian Ocean
B. Benguela
C. Madagascar
D. Mozambique
1.2.7 Wind speed is measured by an instrument called the ….
A Wind vane
B Windsock
C. Anemometer
D. Barometer
1.3. Refer to the diagram below, Figure 1.6 showing the structure of the
atmosphere and answer the questions that follow:
Downloaded from hlayiso.com
Figure 1.6
D
C
B
A
1.3.1 Name the layers A, B, C and D respectively shown in the diagram.
(4x1) (4)
1.3.2 What gas makes up most of the atmosphere? (Nitrogen, Oxygen or Argon)
(1x1) (1)
1.3.3 In which two layers do we find an increase in temperature with height?
(Give the names of layers or the letters only) (2x1)(2)
1.3.4 Provide an explanation why the temperature increases in layer B. (1x2) (2)
1.3.5 Explain why layer A is such an important layer. (2x2) (4)
1.3.6 Why do long-distance aircraft choose to fly in the lower part of layer B? (1X2) (2)
1.4. Read this extract about global warming and then answer
the questions that follow.
Downloaded from hlayiso.com
Global warming
Africa at high risk as global warming set to wreak havoc – floods and
disease expected to worsen
Michael McCarthy
LONDON: The world’s poor – and Africa in particular – will be the hardest hit by
global warming this century, says a UN report on climate change.
Heavier floods all over the world, worse droughts, more violent storms, failing
agriculture and spreading disease can be expected, the report warns.
The underprivileged and destitute in developing countries will feel the impact the
most, and the income gap with developed countries will widen.
The report is the official view of the UN’s intergovernmental panel on climatic
change (IPCC). The 1 000-page study complements a similar report on the
science of global warming and concludes that the world’s average temperature will
rise by up to 6 C by 2100 with sea levels rising by an average of up to 88 cm.
In high latitudes the temperature is likely to be greater than the average. This
means glaciers and polar icecaps melting, countless species of animals, plants
and bird life dying out, farmland turning to desert, fish-supporting coral reefs
destroyed, and low-lying island states in the Pacific and Caribbean under water.
Northern hemisphere countries would probably become hotter, bringing a rise in
deaths from heatstroke in cities and the onset of tropical diseases like malaria and
West Nile virus.
Africa, already suffering severe economic and social problems, would be most
vulnerable to the effects of the warming. Disease levels could shoot up, especially
in crowded cities along the coast, which could also face a rise in sea level.
In Europe, the southern counties are more likely to be affected, with an increased
risk of water shortage and deterioration in soil quality that would affect agriculture.
In more northerly countries, flooding will be worse and tropical diseases can
become endemic.
Roger Higman, Friends of the Earth’s senior climate campaigner said: ‘This
catastrophe was made in the rich countries of the north. Governments in industrial
countries must agree to radical cuts in our use of coal, oil and gas, and a big
increase in the use of renewable power. If we do not act now, it will be too late.’
The world’s governments will meet in Germany this year to try and agree on ways
of achieving the Kyoto protocol on greenhouse gases.
1.4.1. Define global warming. (1x1) (1)
1.4.2. What will be the average increase in global temperature be by 2100? (1x1) (1)
Downloaded from hlayiso.com
1.4.3. By how much will sea levels rise, on average, as a result of this
temperature increase? (1x1) (1)
1.4.4. Briefly discuss the effect the temperature increase will have.
on Africa. (2x2)(4)
1.4.5. The article quotes Roger Hagman, who says, ‘This catastrophe was
made in rich countries of the north’. Provide evidence from the article
to substantiate (support) the opinion shown in the quotation. (2x1) (2)
1.4.6. Give THREE ways in which the planet and its inhabitants are affected
by this rise in temperature. (3x2) (6)
( [15]
Downloaded from hlayiso.com
1.5. Study the FIGURE 1.6 below of Synoptic Map:
1.5.1. Identify the lines on this synoptic chart that join places of equal
pressure. (1x1) (1)
1.5.2. What is the pressure interval on this synoptic weather map? (1x1) (1)
1.5.3. In which season was this map drawn? (1x1) (1)
1.5.4. Give ONE reason for your answer in QUESTION 1.3.4. (1x2) (2)
1.5.5. Use the following headings to describe the weather conditions
at Cape Town.
• Air Temperature
• Cloud cover (2x1) (2)
1.5.6. In the next 24 hours Cape Town is more likely to experience rainfall due to the
passage of cold front. In a paragraph of about 8 lines briefly explain the effects of
this weather condition to the people living in the informal settlements and suggest
measures that can be put in place to assist them.
(2x2)+(2x2) (8)
TOTAL =60
Downloaded from hlayiso.com
GAUTENG DEPARTMENT OF EDUCATION
EXAMPLER
2023
GEOGRAPHY
CONTROLLED TEST 1
MARKING GUIDELINES
GRADE 10
NUMBER OF PAGES : 5
Downloaded from hlayiso.com
1.1
1.1.1. F.√
1.1.2. C. √
1.1.3. G. √
1.1.4. A. √
1.1.5. B. √
1.1.6. H. √
1.1.7. E√
1.1.8. D. √ (8x1)(8)
1.2
1.1. Reflection √
1.2. Isohyets √
1.3. Troposphere√
1.4. Conduction √
1.5. Methane √
1.6. Mozambique √
1.7. Anemometer. √ (7x1)(7)
1.3.1 A = Troposphere√
B = Stratosphere√
C = Mesosphere√
D = Thermosphere√ (4X1)(4)
1.3.2 Nitrogen√√ (1x1) (1)
1.3.3 B or Stratosphere√ and
D or Thermosphere√ (2x1)(2)
1.3.4 Layer B contains the ozone layer which absorbs√√
rays therefore increase in temperatures (1x2) (2)
1.3.5 Layer A is the troposphere and important because: ANY TWO
- contains gases needed for life e.g., oxygen for humans and carbon dioxide for
plant growth√√
- Has O2 needed for respiration and combustion√√
- Clouds found in this layer protects earth from unkind sun rays√√
- Weather occurs here providing rainfall√√
- Water vapour cools off atmosphere√√
- Water vapour provides earth with moisture, e.g., rainfall, dew, snow√√
Downloaded from hlayiso.com
- Protects earth from harmful sun rays√√
- Like a blanket it protects us from extreme hot and cold conditions√√
- Protects earth from meteorites√√
- Allows for changes in weather to take place as air is able to distribute heat. √√
(Educators must please also accept other reasonable answers). (2X2)(4)
1.3.6 No weather interference / no wind / calm / no rain / no turbulence √√
(1x2)(2)
[15]
1.4
1.4.1 Global warming is a world-wide increase in temperature. ✓ (1x1)(1)
1.4.2. 6 C ✓ (1x1)(1)
1.4.3. 88 cm ✓ (1x1)(1)
1.4.4. There will be a rise in disease levels in crowded cities along the coast
✓✓ and flooding of crowded coastal cities as sea level rises. ✓✓ (2x2)(4)
1.4.5. The rich northern countries are the ones that have large industries that
generate large quantities of pollution. ✓ These countries destroy their
own environments and also the world’s because winds etc. blow the
pollution around. ✓ (2x1)(2)
1.4.6. Any three of the following:
• Flooding (✓✓)
• Droughts (✓✓)
• Violent storms (✓✓)
• Failing crops, which can lead to famine (✓✓)
• Animal, bird and plant species may die out (✓✓)
• Desertification (✓✓)
• Coral reefs destroyed (✓✓)
• Low-lying islands drowned (✓✓)
• Tropical diseases – malaria etc. (✓✓)
• Forest fires (✓✓)
• Deaths related to heatstroke (✓✓)
Downloaded from hlayiso.com
• Shrinking forests (✓✓)
• Deteriorating soil quality (✓✓)
• Severe water shortages later (✓✓) (3x2)(6)
1.5
1.51. Isobars (1x1) (1)
1.5.2. 4mb / hPa (1x1) (1)
1.5.3. Winter (1x1) (1)
1.5.4.
• Large differences between dew point and air temperature
• Coastal low along the east coast
• Clear skies
• Cold front approaching (ANY ONE) (1x2) (2)
1.5.6
• Air temperature= 18ºC
• Cloud cover= ¾ cloud cover (2x1) (2)
1.5.7
Effects
• Destruction of houses
• People will be homeless
• People will get sick
• People will die (2x2 (4)
Relief measures:
• Have warning campaigns to relocate people from flood prone areas.
• Prepare emergency Halls/ tents (temporal shelter)
• Deploy emergency personnel (Any FOUR)
The discussion should include both the effects and the relief
measures (2x2) (4)
[15]
TOTAL=60
Downloaded from hlayiso.com
CONTROLLED TEST 1
COGNITIVE GRID
Downloaded from hlayiso.com
GRADE 10 EXEMPLAR
SBA ITEM 2
MAPWORK TASK
Downloaded from hlayiso.com
GAUTENG DEPARTMENT OF EDUCATION
2023
GEOGRAPHY
MAPWORK TASK 1
QUESTION PAPER
GRADE 10
NUMBER OF PAGES : 8
Learner’s name:
QUESTION ONE TWO THREE FOUR TOTAL
Marker
Moderator
POSSIBLE MARK 10 15 25 10 60
This question paper consists of 10 pages.
Downloaded from hlayiso.com
RESOURCE MATERIAL
1. An extract from topographic map 2629DB ERMELO
2. Orthophoto map 2629DB 5 ERMELO
INSTRUCTIONS AND INFORMATION
1. Write your NAME and KEY in the spaces on the cover page.
2. Answer ALL the questions in the spaces provided on this question paper.
3. You are provided with a 1:50 000 topographic map (2629DB ERMELO) and an
orthophoto map (2629DB 5 ERMELO) of a part of the mapped area.
4. You must hand the topographic map and the orthophoto map to the invigilator at the
end of this test session.
5. You may use the blank page at the end of this question paper for all rough work and
calculations. Do NOT detach this page from the question paper.
6. Show ALL calculations and use the formulae provided, where applicable. Marks will
be allocated for these.
7. Indicate the unit of measurement in the final answer of calculations, e.g. 10
km; 2,1 cm, West of True North.
8. You may use a non-programmable calculator.
9. You may use a magnifying glass.
10. The area demarcated in RED on the topographic map represents the area covered
by the orthophoto map or the mapped area.
GENERAL INFORMATION ON ERMELO
N
Co-ordinates: 26°31'S; 29°58'E
Ermelo is an educational, industrial, and commercial town in the 7,750 km² Gert
Sibande District Municipality in Mpumalanga, South Africa. It is located 210 km
east of Johannesburg. It is both a mixed agriculture and mining region. Mixed
farming, such as maize and cattle, take place within the district. Mining is
important to the district with anthracite, coal and torbanite being mined.
Downloaded from hlayiso.com
Adapted from: http://en.wikipedia.org/wiki/Ermelo_Mpumalanga
QUESTION 1: MULTIPLE-CHOICE QUESTIONS
The questions below are based on the 1:50 000 topographic map (2629DB ERMELO) as
well as the 1:10 000 orthophoto map of a part of the mapped area. Various options are
provided as possible answers to the following questions. Choose the answer and write only
the letter (A–D) in the block next to each question.
1.1. The town of ERMELO is in the …province.
A. Free State
B. Gauteng
C. Northwest
D. Mpumalanga
1.2. The distance from a T-junction in block A5 (topographic map) to Chrissiesmeer
using the N17 road is…
A. 18 km
B. 35 km
C. 36,65 km
D. 53 km
1.3. The map sheet index south of 2629DB 5 ERMELO is …
A. 2629DD
B. 2629BD
C. 2529DB 25
D. 2630DB 10
1.4. The 2629 of the map code indicates that the town lies on …
A. 29º E longitude and 26º N latitude
B. 26º S longitude and 29º E latitude
C. 26º S latitude and 29º E longitude
D. 29º E latitude and 26º N longitude.
1.5. The topographic map covers a / the …than the orthophoto map.
A. smaller area of reality on a smaller scale map
B. larger area of reality on a smaller scale map
C. same area of reality on a similar sized map
D. smaller area of reality on a larger scale map
Downloaded from hlayiso.com
1.6. The contour interval of the orthophoto map is ... metres.
A. 20
B. 15
C. 10
D. 5
1.7. The photograph used to compile the orthophoto map is …
A. Vertical aerial photograph
B. Horizontal photograph
C. Satellite images
D. oblique photograph
1.8. The height of the trignometrical station in block D4 (topographic map) is...
A. 309 m.
B. 1773,7 m.
C. 2082,7 m.
D. 1464,7 m.
1.9. The conventional symbol for a shopping mall is…
A. ◼PS
B. ◼S
C. ◼W
D. ◼K
1.10. The shadows on the orthophoto map indicate that is photograph was taken…
A. between 08:00 – 10:00
B. between 10:00 –12:00
C. exactly at 12:00
D. between 12:00 – 14:00
(10 x 1) (10)
[10]
Downloaded from hlayiso.com
QUESTION 2: MAP CALCULATIONS AND TECHNIQUES
2.1 Convert the topographic map scale into a word scale. (1 x 1) (1)
_____________________________________________________
_____________________________________________________
2.2 Determine the coordinates of a dam in block D5 (topographic map) (3 x 1) (3)
by completing the missing values below.
26°33’___” S; 29⁰ ___’ ___” E.
2.3 Refer to trig station 305 in block D2 and trig station 309 in block D4
on the topographic map.
2.3.1 Give the compass direction of trig station 305 from trig station 309. (1 x 1) (1)
_____________________________________________________
2.3.2 Determine True Bearing of trig station 305 from trig station 309. (1 x 1) (1)
_____________________________________________________
2.3.3 Which ONE (compass direction or true bearing) would be a more (2 x 1) (2)
accurate way of indicating direction? Explain your answer.
_____________________________________________________
_____________________________________________________
2.4 Calculate the mean Magnetic Declination for the current year.
Mean magnetic declination =_________________________________
Difference in years: ________________________________________ (1)
Annual Change: ___________________________________________
Total change: _____________________________________________ (1)
Present magnetic declination: ________________________________
________________________________ (2)
2.5 A guide wants to take a group of tourists on a tour in the Ermelo (1 x 2) (2)
area. The guide will use a topographic map of this area to plan a
route. State the importance of calculating the magnetic declination
for the present year before departing on their tour.
_____________________________________________________
_____________________________________________________
2.6 Use your answers in QUESTIONS 2.3.2 and 2.4 to calculate (1 x 1) (1)
present magnetic bearing.
Magnetic Bearing = True Bearing + Magnetic Declination
Downloaded from hlayiso.com
_____________________________________________________
[15
QUESTION 3: APPLICATION AND INTERPRETATION
Refer to both topographical, orthophoto map, vertical photographs and all sources provided
to answer the questions below.
3.1 Refer to block C2 on the topographic map to answer the following
questions.
3.1.1 What evidence is there in this block that farming is taking place? (1 x 1) (1)
_____________________________________________________
3.1.2 Identify TWO points of evidence from the map that support (favour) (2 x 1) (2)
the development of farming in this block.
_____________________________________________________
_____________________________________________________
3.1.3 What role does the row of trees play in this farm? (1 x 2) (2)
_____________________________________________________
_____________________________________________________
3.1.4 Explain why the expansion of this farm to the northeast would be (1 x 2) (2)
limited.
_____________________________________________________
_____________________________________________________
3.2 Study the graph showing average monthly precipitation in Ermelo
below and answer the questions that follow.
200 mm Precipitation
Precipitation
100 mm
0 mm
Jan Feb Mar Apr May Jun Jul Aug Sep Oct Nov Dec
Average rainy days (rain/snow) Ermelo, South Africa, Copyright © 2023 weather-and-climate.com
3.2.1 Does Ermelo receive seasonal rainfall or rainfall all year through? (1 x 1) (1)
_____________________________________________________
Downloaded from hlayiso.com
3.2.2 Give ONE point of evidence from the climatic graph and ONE point
of evidence from the topographic map to support your answer to
QUESTION 3.2.1.
(1 x 2) (2)
Graph:
________________________________________________
(1 x 2) (2)
_______________________________________________
Topographic map:______________________________________
______________________________________
3.2.3 Will Ermelo experience continental or maritime climate? (1 x 1) (1)
_____________________________________________________
3.2.4 Give a reason for answer to QUESTION 3.2.3. (1 x 2) (2)
_____________________________________________________
_____________________________________________________
3.2.5 Name the ocean current that flows on the eastern part of Ermelo. (1 x 1) (1)
_____________________________________________________
3.3 Refer to the river flowing in between blocks C3 and D3 on the
topographical map.
3.3.1 Is this river a perennial or non-perennial? Give a reason for your
answer.
(a) Type of river: (1 x 1) (1)
__________________________________________ (1 x 2) (2)
(b) Reason:
______________________________________________
3.3.2 State the general direction in which this river flows and give a
reason for your answer.
(a) General flow direction: (1 x 2) (2)
_________________________________ (1 x 2) (2)
(b) Reason:
______________________________________________
______________________________________________
3.4 Refer to Sewage works (at J) on the topographic map and in blocks (1 x 2) (2)
A1 – 2 & B1 – 2 on the orthophoto map.
Comment on the location of this sewage works.
Downloaded from hlayiso.com
_____________________________________________________
_____________________________________________________
[25]
QUESTION 4 – GEOGRAPHIC INFORMATION SYSTEMS
4.1 Define the concept GIS. (1 x 2) (2)
_____________________________________________________
_____________________________________________________
4.2 What are the TWO historic events that led to the development of (2 x 1) (2)
GIS?
_____________________________________________________
_____________________________________________________
4.3 The following diagram shows the components of GIS.
4.3.1 Identify component A and B respectively. (2 x 1) (2)
A: ___________________________________________________
B: ___________________________________________________
4.3.2 State the role played by component B on GIS. (1 x 1) (1)
_____________________________________________________
_____________________________________________________
4.3.3 Identify spatial feature at 6 on the orthophoto map and state its
importance to the people of Wessel ton.
Downloaded from hlayiso.com
(a) Identification: (1 x 1) (1)
_________________________________________ (1 x 2) (2)
(b) Importance:
___________________________________________
___________________________________________
[10]
TOTAL: 60
Downloaded from hlayiso.com
GAUTENG DEPARTMENT OF EDUCATION
2023
GEOGRAPHY
MAPWORK TASK 1
MARKING GUIDELINE
GRADE 10
This marking guideline consists of 10 pages.
Downloaded from hlayiso.com
QUESTION 1: MULTIPLE-CHOICE QUESTIONS
The questions below are based on the 1:50 000 topographic map (2629DB ERMELO) as
well as the 1:10 000 orthophoto map of a part of the mapped area. Various options are
provided as possible answers to the following questions. Choose the answer and write only
the letter (A–D) in the block next to each question.
1.1. The town of ERMELO is in the …province.
A. Free State
B. Gauteng
C. Northwest
D
D. Mpumalanga
1.2. The distance from a T-junction in block A5 (topographic map) to Chrissiesmeer
using the N17 road is…
A. 18 km
B. 35 km C
C. 36,65 km
D. 53 km
1.3. The map sheet index south of 2629DB 5 ERMELO is …
A. 2629DD
B. 2629BD
C. 2529DB 25
D
D. 2630DB 10
1.4. The 2629 of the map code indicates that the town lies on …
A. 29º E longitude and 26º N latitude
B. 26º S longitude and 29º E latitude
C. 26º S latitude and 29º E longitude
C
D. 29º E latitude and 26º N longitude.
1.5. The topographic map covers a / the …than the orthophoto map.
A. smaller area of reality on a smaller scale map
B. larger area of reality on a smaller scale map
C. same area of reality on a similar sized map
D. smaller area of reality on a larger scale map
B
Downloaded from hlayiso.com
1.6. The contour interval of the orthophoto map is ... meters.
A. 5
B. 10
C. 15
A
D. 20
1.7. The photograph used to compile the orthophoto map is …
A. Vertical aerial photograph
B. Horizontal photograph
C. Reservoir
A
D. oblique photograph A
1.8. The height of the trignometrical station in block D4 (topographic map) is...
A. 309 m.
B. 1773,7 m.
C. 2082,7 m.
B
D. 1464,7 m. B
1.9. The conventional symbol for a shopping mall is…
A. ◼PS
B. ◼S
C. ◼W
C
D. ◼K
1.10. The shadows on the orthophoto map indicate that the photograph was taken…
A. between 08:00 – 10:00
B. between 10:00 –12:00
C. exactly at 12:00
D
D. between 12:00 – 14:00
(10 x 1) (10)
[10]
Downloaded from hlayiso.com
QUESTION 2: MAP CALCULATIONS AND TECHNIQUES
2.1 Convert the topographic map scale into a word scale. (1 x 1) (1)
• One centimetre (1cm) on the map represents fifty thousand
centimetres (50000cm) in reality/on the ground. (1)
2.2 Determine the coordinates of a dam in block D5 (topographic map) (3 x 1) (3)
by completing the missing values below.
26°33’37” (1)S; 29⁰ 59’ (1) 27” (1) E. [ACCEPT +/- 2” – 4”DIFFERENCE]
2.3 Refer to trig station 305 in block D2 and trig station 309 in block D4
on the topographic map.
2.3.1 Give the compass direction of trig station 305 from trig station 309. (1 x 1) (1)
• W/WNW (1)
2.3.2 Determine True Bearing of trig station 305 from trig station 309. (1 x 1) (1)
273° (1)
2.3.3 Which ONE (compass direction or true bearing) would be a more (2 x 1) (2)
accurate way of indicating direction? Explain your answer.
• True bearing (1)
Reason: It gives exact location in degrees (1)
2.4 Calculate the mean Magnetic Declination for the current year.
Mean magnetic declination = 18°34’ West of True North
Difference in years: 2023 – 2013 = 10 years (1)
Annual Change: 4’ W
Total change: 4’ x 10yrs = 40’W (1)
Present magnetic declination: 18°34’ + 40’ (1)
= 19° 14’ West of True North (1)
2.5 A guide wants to take a group of tourists on a tour in the Ermelo (1 x 2) (2)
area. The guide will use a topographic map of this area to plan a
route. State the importance of calculating the magnetic declination
for the present year before departing on their tour.
• It keeps on changing every year (2)
• To get the correct direction (2)
• For them not to get lost (2)
• To determine the True North (2)
Downloaded from hlayiso.com
2.6 Use your answers in QUESTIONS 2.3.2 and 2.4 to calculate (1 x 1) (1)
present magnetic bearing.
Formula: Magnetic Bearing = TB + MD
273 ° + 19° 14’
= 292° 14’ (1)
[15]
QUESTION 3: APPLICATION AND INTERPRETATION
Refer to both topographical, orthophoto map, vertical photographs and all sources provided
to answer the questions below.
3.1 Refer to block C2 on the topographic map to answer the following
questions.
3.1.1 What evidence is there that farming is taking place? (1 x 1) (1)
• Cultivation (1)
3.1.2 Identify TWO factors/points of evidence from the map that support (2 x 1) (2)
(favour) the development of farming in this block.
• Rivers and Dams/availability of water (1)
• Ground water (1)
• Flat land/fertile soil (1)
• North facing slopes (1)
[ANY TWO]
3.1.3 What role does the row of trees play in this farm? (1 x 2) (2)
• Act as a fence (2)
• Helps protect crops from strong prevailing winds (2)
[ANYONE]
3.1.4 Explain why the expansion of this farm to the northeast would be (1 x 2) (2)
limited.
• Hilly area/steep slopes in the northeast (2)
• There is the presence natural water feature/river/and a dam
(expansion of a farm can tamper with/change the natural
flow of the rivers/dams in the northeast) (2)
[ANYONE]
Downloaded from hlayiso.com
3.2 Study the graph showing average monthly precipitation in Ermelo
below and answer the questions that follow.
Average rainy days (rain/snow) Ermelo, South Africa, Copyright © 2023 weather-and-climate.com
3.2.1 Does Ermelo receive seasonal rainfall or rainfall all year through? (1 x 1) (1)
• Seasonal (1)
3.2.2 Give ONE point of evidence from the climatic graph and ONE point
of evidence from the topographic map to support your answer to
QUESTION 3.2.1.
Graph: Highest rainfall during summer months (September–
(1 x 2) (2)
April) (2)
: Little/lowest or no rainfall in the winter months (May
- Aug) (2)
Topographical map: Non-perennial/ Periodic rivers/water (2)
(1 x 2) (2)
: Many dams / Reservoirs / Windmills =
Irrigation implemented (2)
[ANYONE]
3.2.3 Will Ermelo experience continental or maritime climate? (1 x 1) (1)
Continental (1)
3.2.4 Give a reason for answer to QUESTION 3.2.3. (1 x 2) (2)
Located further away from the sea (2)
Climate is affected by continental surfaces (2)
[ANYONE]
3.2.5 Name the ocean current that flows on the eastern part of Ermelo. (1 x 1) (1)
Warm Mozambique current (1)
Downloaded from hlayiso.com
3.3 Refer to the river flowing in between blocks C3 and D3 on the
topographical map.
3.3.1 Is this river a perennial or non-perennial? Give a reason for your
answer.
(a) Type of river: Perennial (1) (1 x 1) (1)
(b) Reason: It has a blue solid line indicating continuous (1 x 2) (2)
flow
throughout the year. (2)
3.3.2 State the general direction in which this river flows and give a
reason for your answer. (1 x 2) (2)
(a) General flow direction: North/NNW (2)
(b) Reason: tributaries join the main river at acute angle in a (1 x 2) (2)
northerly direction (2)
: Position of the dam wall (2)
[ANYONE]
3.4 Refer to Sewage works (at J) on the topographic map and in blocks (1 x 2) (2)
A1 – 2 & B1 – 2 on the orthophoto map.
Comment on the location of this sewage works.
• It gives off bad odours therefore it is located away from
residential areas & the CBD (2)
• It is located on a cheap land/open land (2)
OR
• The location of the sewage works is not ideal as it is
located near residential areas (bad odours/pollution
would negatively affect the residents nearby and sewage
works may decrease property value) (2)
[ANY ONE]
[25]
Downloaded from hlayiso.com
QUESTION 4 – GEOGRAPHIC INFORMATION SYSTEMS
4.1 Define the concept GIS (1 x 2) (2)
• is a computer programme which allows users to work,
manipulate and display geographical data in different
ways? (CONCEPT) (2)
4.2 What are the TWO historic events that led to the development of (2 x 1) (2)
GIS?
• WWI and WWII – use of aerial photographs (1)
• Cold War – use of satellites (1)
4.3 The following diagram shows the components of GIS.
4.3.1 Identify component A and B respectively. (2 x 1) (2)
A: Software (1)
B: People (1)
4.3.2 State the role played by component B on GIS. (1 x 1) (1)
• People do geographic research. (1)
• People decides on what kind of data is needed. (1)
• People collect and capture data into GIS. (1)
• People process, interpret, analyse and manipulate
information.(1)
• People develop GIS software and hardware. (1)
[ANYONE]
4.3.3 Identify spatial feature at 6 on the orthophoto map and state its
importance to the people of Wesselton.
(a) Identification: Hospital (1)
(1 x 1) (1)
Downloaded from hlayiso.com
(b) Importance: Offers medical care/extensive treatment to
the 1 x 2) (2)
sick (2)
• They are equipped with medical equipment
which helps in the diagnosis and treatment of
many types of diseases (2)
• They also help in promoting health, giving
information on the prevention of illnesses and
providing curative services (2)
• Offers employment (offer multiple healthcare
professionals e.g., doctors, nurses and
interns) to the community of Wesselton (2)
[10]
TOTAL: 60
Downloaded from hlayiso.com
MAPWORK TASK
COGNITIVE GRID
Downloaded from hlayiso.com
GRADE 10 EXEMPLAR
SBA ITEM 3
ESSAY
Downloaded from hlayiso.com
TYPE OF TASK: ARGUMENTATIVE ESSAY
TOPIC: GLOBAL WARMING
DRAFT OF INSTRUCTIONS AND INFORMATION TO EDUCATORS AND LEARNERS
1. This Assessment Task is set according to guidelines and assessment options as presented in the
Geogra CAPS document and the GDE SBA Guideline.
2. This Assessment Task consists of TEN sections/steps. You must complete all steps.
4. The task may/must be completed in TEN phases.
5. SUBJECT
The total time allocated to this : GEOGRAPHY
task is from Term 1 (Phase 1) to Consolidation
and Completion in Term 2 (Phase 2)
5. The completion of all ten steps of this task should not go beyond the second term.
CODE : GEOG
7. All information is included in this Research Guideline document.
8. The research can be typed or handwritten but must be clear and legible.
9. Marking MUST be completed in RED pen. :
GRADE 10
10 First level Moderation (HOD/Senior Teacher) MUST be completed in BLACK pen.
11. Second level Moderation (Cluster/Circuit/District Teacher Moderator) MUST be completed in
GREEN p TERM : ONE
12. Subject Advisor Moderation (District) MUST be completed in ORANGE pen
DATE OF IMPLEMENTATION : March 2022
TERM WEIGHTING % : 25
TOTAL : 100
Downloaded from hlayiso.com
INSTRUCTIONS AND INFORMATION TO EDUCATORS
1. This Assessment Task is set according to guidelines and assessment options as
presented in the FET Geography CAPS - Implementation of the Abridged Section
4 Amendments 2021.
2. Learners can bring their resources to the class.
3. Educators must use the rubric attached to mark the essay.
4. The rubric must be handed out to the learners before completion of the task
5. Educators must mediate the task with the learners. Don’t only hand it out.
6. Date for completion: March 2022
7. Prepare yourself as educator before you facilitate the essay to the learners.
GUIDELINE FOR THE EDUCATOR TO FACILITATE THE WRITING OF AN ESSAY:
THE ATMOSPHERE
Give learners the extract and QR code on page 2 based on global warming and
climate change.
Facilitate learners on Writing an (argumentative essay) on global warming focusing on the
following key points:
• Global warming is the biggest threat we are facing.
• If we do not deal with it the consequences are grim (very serious)
• We can deal with it and are already busy.
Discuss different points regarding Global Warming, by means of supplying case studies, to
make learners aware of the topic.
Downloaded from hlayiso.com
INSTRUCTIONS AND INFORMATION TO LEARNERS
1. This Assessment Task is set according to guidelines and assessment options as
presented in the FET Geography CAPS - Implementation of the Abridged
Section 4 Amendments 2021.
2. You can gather resources for the essay to assist you in planning and writing of
the essay.
3. Your essay must be 1 ½ or 2 typed pages long (introduction, body, and
conclusion) excluding cover page, mind map and page of references.
• Font size : 12
• Theme font : Arial
• Font color : Black
• Line spacing : 1.5
4. Use the extract and QR code on the next page to increase your awareness and
understanding about the topic.
5. Use the rubric attached to guide you in the writing of the essay.
6. This essay must be completed by the March 2022.
CONDUCTING THE ARGUMENTATIVE ESSAY
• Your essay must be argumentative and relevant to the group of articles that you have
sourced.
• Definition of an Argumentative Essay
An argumentative essay is a type of essay that presents arguments about both sides of
an issue. It could be that both sides are presented equally balanced, or it could be that
one side is presented more forcefully than the other. It all depends on the writer, and what
side he supports the most. The general structure of an argumentative essay follows this
format:
o Introduction: Attention Grabber, Background, Information, Statement.
o Body: Body paragraphs (Each paragraph should present a major argument that
you want to convey to the reader).
o Counterargument: An argument to refute earlier arguments and give weight to
the actual position.
Downloaded from hlayiso.com
o Conclusion: Rephrasing the statement, major points, call to attention,
or concluding remarks.
{{{
• Function of an Argumentative Essay
o An argumentative essay presents both sides of an issue. However, it presents
one side more positively or meticulously than the other one, so that readers
could be swayed to the one the author intends. The major function of this type
of essay is to present a case before the readers in a convincing manner,
showing them the complete picture.
• Examples:
o Importance of the atmosphere.
o Causes and effects of ozone depletion.
o Reducing ozone depletion.
o Greenhouse Effect.
o Global warming: evidence, causes, and consequences, with reference to Africa.
o Impact of climate and climate change on Africa’s environment and people.
o U.S. President, Donald Trump’s view on climate change and global warming
being a “hoax”
As opposed to;
Teenage climate change activist, Greta Thunberg’s view of climate change
being; an existential (relating to the existence of) crisis that humanity is currently
faced with.
Downloaded from hlayiso.com
CONDUCTING OF THE (ARGUMENTATIVE) ESSAY
Write an (argumentative essay) on global warming focusing on the following key points:
• Global warming is the biggest threat we are facing.
• If we don’t deal with it the consequences are grim (very serious)
• We can deal with it and are already busy
Your essay should consist of cover page, mind map, introduction, body, conclusion and
page of references.
CURRICULUM CONTENT: GLOBAL WARMING
Global warming is burning the
Earth.
Sir James Bevan, Chief Executive of the Environment Agency Royal Society
24 September 2018
Greta Thumberg’s UN speech:
... “Change is coming whether you like it or not”
Global warming is one of the problems which the whole world is aware of. It can be said that
it is the product of society’s development without giving much concern to nature. Countries
are addressing this problem to try and find a solution to this problem.
The recent studies in this sphere have proved beyond a shadow of doubt that the temperature
of the atmosphere is increasing each year. The increase in the amount of carbon dioxide in
the atmosphere is considered as the contributing reason for this global phenomenon. This
has caused an increase of the temperature by about 1 degree Fahrenheit per year.
Downloaded from hlayiso.com
It is not just the responsibility of the various governments to take steps for preventing this. It
is high time to make strong decisions and unite to protect our land and the planet from
dilapidation. Each one of us has a duty to do what we can, to prevent this imminent disaster.
Some simple steps are enough in order to prevent this big problem.
Bill Gates says ending COVID-19 pandemic 'easier'
than solving climate change.
Cutting greenhouse gas emissions takes the collective effort of governments
around the world, Gates said.
Microsoft co-founder and billionaire climate activist Bill Gates on Sunday claimed that
eradicating climate change would be harder than ending the coronavirus pandemic.
Gates, who has funnelled millions into coronavirus relief efforts over the past year, told
the BBC that ending the pandemic is "very, very easy" in comparison to the climate crisis,
which will get worse unless governments worldwide aid in this effort.
In fact, Gates said that funding a solution to climate change would "the most amazing thing
humanity has ever done."
Currently, the world emits about 50 billion tonnes of greenhouse gasses into the atmosphere
each year. The goal is to lower emissions net zero, which means attaining an equal
balance between the greenhouse gases that are put into the atmosphere and the
greenhouse gases that are taken out.
Cutting these emissions takes the collective effort of governments around the world, he
argued.
"We need to have price signals to tell the private sector that we want green products," Gates
said.
Governments will not only have to heavily invest in the research and development of new
green products, but they will also have to allow for these products and technologies to grow
in the market, the outlet reported.
Although this effort takes more than just one person, Gates said during an interview on CBS'
"60 minutes" that he is paying $7 million a year to offset his own carbon footprint.
Aside from his own efforts, Gates is encouraging others -- if they can afford to do so -- to
buy carbon offsets and green products which may get move the world closer to net-zero
emissions. His hope is that in doing so, the production cost for reducing carbon emissions
will decline while the quality of products will increase.
Although it will be hard, Gates said it is not impossible.
"There are days when it looks very hard," he said. "If people think it is easy, they're wrong.
If people think it is impossible, they're wrong."
[Source: https://www.foxbusiness.com/lifestyle/bill-gates-60-minutes-climate-change]
Downloaded from hlayiso.com
Types of questions
1 Statement: Agree or disagree. Motivate your
point of view.
2 Critically discuss …
3 To what extent …
Downloaded from hlayiso.com
[Source: https://www.google.co.za/search?q=essay+writing&source]
Downloaded from hlayiso.com
RUBRIC/MARK STRUCTURE
0 1-2 3-4
COVER PAGE No cover page, Only Neat, but some Neat with all
name. information lacks. relevant
information, like
name, topic, class
group.
0 1-3 4-7 8-10
PLANNING No mind map. Mind map clearly Mind map clearly Mind map clearly
indicate the point of indicate the point indicate the point
discussion. Two of discussion. of discussion.
central ideas Three central Three central
without conclusion ideas without ideas and
is indicated on the conclusion is conclusion is
mind map. indicated on the indicated on the
mind map mind map
1 2-4 5-7 8-10
INTRODUCTION Problem is vaguely or Introduction states Introductory Well-developed
unclear. the topic but does paragraph introductory
Background detail are not adequately contains some paragraph
seemingly random explain the background contains detailed
collection of background of the information and background.
information, unclear, or problem. states the problem A clear
not related to the topic The problem is but does not explanation of the
stated but lacks explain using problem and a
detail. detail. topic statement.
States the topic of
the essay
1-5 6-10 11-15 16-20
MAIN POINTS ➢ Three main points is ➢ Three main ➢ Three main ➢ Three main
BODY discussed, with no points are poorly points are well points are well
PARAGRAPHS logical organisation developed developed but developed with
➢ Paragraphs poorly without supporting supporting
constructed and is supporting detail detail lacks detail
haphazardly written ➢ Paragraphs are ➢ Paragraphs ➢ Paragraphs
➢ Central Idea is not very weak constantly constantly
well discussed, with constructed and acknowledge acknowledge
no research is haphazardly point of view or point of view or
➢ No opposing written central idea central idea
viewpoints in ➢ Central Idea is ➢ Some ➢ Opposing
paragraphs not well opposing viewpoints are
➢ No structure discussed and viewpoints are summarised
lacks proper summarised ➢ Logical,
research ➢ The is some compelling
➢ No opposing logical progression of
viewpoints in progression of ideas in essay
paragraphs ideas in essay ➢ Clear structure
➢ No structure ➢ Clear structure ➢ Organisation
➢ Organisation flows smoothly,
flows the reader
➢ Research has hardly thinks
been done about it
➢ Research has
been done and
well put in the
paragraphs
0 1-3 4-7 8-10
CONCLUSION No Conclusion. Conclusion Summarizes the Summarizes the
summarizes main main ideas. main ideas.
ideas but is Some suggestions Does not repeat
repetitive. for change are previous
No suggestions for evident. sentences.
change and/or
Downloaded from hlayiso.com
opinions are Writer’s opinion
included. and suggestions
are logical and
well thought out
5-6 3-4 1-2 0
REFERENCES No references One reference Two references At least three
acknowledged acknowledged references
acknowledged
MARK ALLOCATION Total
Max Achieved Max Achieved
Cover Page Paragraph
4 20
1
Planning
10
Paragraph
20
100
2
Introduction Paragraph
10 20
3
Conclusion Reference
10 6
s
Downloaded from hlayiso.com
GRADE 10 EXEMPLAR
SBA ITEM 4
MID-YEAR EXAMINATION
Downloaded from hlayiso.com
GAUTENG DEPARTMENT OF EDUCATION
EXEMPLAR
GEOGRAPHY
Mid-year Examination
NUMBER OF PAGES : 11
Downloaded from hlayiso.com
SECTION A: THE ATMOSPHERE AND GEOMORPHOLOGY
QUESTION 1: THE ATMOSPHERE
1.1 Choose a term from COLUMN B that matches the characteristic/description in COLUMN A.
Write only the letter (A–I) next to the question numbers (1.1.1 to 1.1.8) in the ANSWER
BOOK, e.g., 1.1.9 J.
COLUMN A COLUMN B
1.1.1 Height above sea-level. A. Atmosphere
1.1.2 The upper level of the B. Weather
troposphere.
C. Ozone
1.1.3 The direction in which a slope
face. D. Condensation
1.1.4 A process whereby areas E. Tropopause
become more arid.
F. Aspect
1.1.5 A gaseous layer which envelops
the earth. G. Altitude
1.1.6 Molecules of three oxygen atoms H. Updraught
which absorbs ultraviolet rays.
I. Desertification
1.1.7 The condition of the atmosphere
at any place and any time.
1.1.8 Change of state of water vapour
into ice.
(8x1) (8)
1.2 Choose a word/term from the information box for each of the following descriptions. Write
ONLY the word/term next to the question number (1.2.1-1.2.7) in the ANSWER BOOK for
example 1.1.8 temperature.
Insolation, Scattering, Absorption, Conduction, Solar constant, Reflection,
Radiation, Convection
1.2.1 The amount of solar radiation that reaches the tropopause.
1.2.2 When gases like CO² and water vapour in the atmosphere take up
radiation.
1.2.3 When radiation strike a cloud or the ground surface and is sent back into the
atmosphere without being absorbed.
1.2.4 Heat distribution by means of waves.
49
Downloaded from hlayiso.com
1.2.5 The sun’s energy that passes through the Earth’s atmosphere.
1.2.6 Heat distributed by means of moving molecules.
1.2.7 When radiation particles bounce of dust particles in the atmosphere.
(7x1) (7)
1.3 Study FIGURE 1.3 below before answering the following questions.
1.3.1 Define the concept greenhouse effect. (1x2) (2)
1.3.2 Give ANY greenhouse gas. (1x1) (1)
1.3.3 Explain why the greenhouse effect is necessary for life on Earth.
(1x2) (2)
1.3.4 Describe how greenhouse gasses contribute to the rise in global warming.
(1x2) (2)
1.3.5 In a paragraph of approximately EIGHT lines, discuss the impacts of increased
greenhouse gasses on people and the environment.
(4x2) (8)
1.4 Study the map below illustrating the ocean currents and answer the following questions.
50
Downloaded from hlayiso.com
1.4.1 Name the ocean on the west coast of South Africa (1x1) (1)
1.4.2 List ANY TWO factors that affect the climate of the world. (2x1) (2)
1.4.3 Identify the ocean currents labelled 1 and 2 on the map above.
(2x1) (2)
1.4.4 Describe how the ocean current labelled 1 on the map will
influence the climate of South Africa with regards to temperature
and rainfall. (2x2) (4)
1.4.5 Globally the earth’s continents tend to experience warmer temperatures on their east
coasts. Provide THREE reasons to support this statement.
(3x2) (6)
51
Downloaded from hlayiso.com
1.5 Study the picture below and answer the questions that follow:
1.5.1 Name the phenomenon illustrated by the picture. (1x1) (1)
1.5.2 Define the phenomenon that you named in question 1.5.1 (1x2) (2)
1.5.3 Discuss TWO causes that leads to this phenomenon. (2x2) (4)
1.5.4 In a paragraph of approximately EIGHT lines, discuss the solutions and
strategies to deal with this phenomenon. (4x2) (8)
QUESTION 2
52
Downloaded from hlayiso.com
2.1 Choose a term from COLUMN B that matches the characteristic/description in COLUMN A.
Write only the letter (A–I) next to the question numbers (2.1.1 to 2.1.8) in the ANSWER
BOOK, e.g., 2.1.9 J.
COLUMN A COLUMN B
2.1.1 Forms from the shells of marine A. Basalt
organisms.
B. Sedimentary rock
2.1.2 Medium-sized sediments, such
as sand, accumulate in layers on C. Domes
the seabed.
D. Limestone
2.1.3 Rock which has been changed
by heat or pressure. E. Igneous rock
2.1.4 Crystals are small but visible with F. Metamorphic rock
the naked eye.
G. Shale
2.1.5 Fine-grained sediments become
consolidated to form layers. H. Sandstones
2.1.6 Crystals are too small to see with I. Dolerite
the naked eye.
2.1.7 Rocks that form below Earth’s
surface.
2.1.8 Rocks which form through
mechanical process.
(8x1) (
2.2 Various options are provided as possible answers to the following questions. Choose the
answer and write only the letter (A-D) next to the question number (2.2.1-2.2.7) in the
ANSWER BOOK, for example 2.2.8 A.
2.2.1 The two sides of a fold are called its…
A. anticlines
B. synclines
C. limbs
D. axial planes
2.2.2 The fold which is convex downward is…
A. anticline
B. syncline
53
Downloaded from hlayiso.com
C. U-cline
D. Crestline
2.2.3 Fold in which limbs lie exactly one over another…
A. isoclinal
B. symmetrical
C. recumbent
D. asymmetrical
2.2.4 A normal fault results from which type of force…
A. tension
B. compression
C. transverse
D. thrust
2.2.5 A rift valley results from which type of force…
A. tension
B. compression
C. transverse
D. thrust
2.2.6 Block mountains are as a result of…
A. faulting
B. folding
C. tectonic plates
D. rocks
2.2.7 Faulting takes place when rocks within the Earth’s crust form...
A. water spaces
B. mountains
C. asymmetrical mountains
D. cracks
(7x1) 2.3 Study the
illustration of the internal structure of the Earth below and answer the questions that follow:
54
Downloaded from hlayiso.com
2.3.1 Name the crust beneath the ocean. (1x1) (1)
2.3.2 Define lithosphere (1x2) (2)
2.3.3 Which layers of the earth are the thinnest and thickest? (2x1) (2)
2.3.4 Identify the layers 3 and 4. (2x1) (2)
2.3.5 Which TWO layers of the Earth are in solid form? (2x1) (2)
2.3.6 Give TWO minerals found in the outer core? (2x1) (2)
2.3.7 Name the molten rock found above and below the earth’s surface.
(2x2) (4
2.4 Study the illustration of a cross-section of a composite volcano below and answer the
questions that follow:
55
Downloaded from hlayiso.com
2.4.1 Identify the type of volcano that’s being depicted by the diagram.
(1x1) (1)
2.4.2 What do we call the opening located at the top of a volcano. (1x2) (2)
2.4.3 Where are volcanoes likely to form? (1x2) (2)
2.4.4 Provide the rock formed when lava cools. (1x2) (2)
2.4.5 In a paragraph of approximately EIGHT lines, explain how volcanoes can have a
POSITIVE and a NEGATIVE effect on the environment around them.
(4x2) (
2.5 Refer to the CARTOON below showing the movement of the continents over time. Answer
the following questions.
2.5.1 Name the theory that is described in the cartoon. (1x1) (1)
2.5.2 Name the super continent that the two continents in the cartoon
belonged to 50 million years ago. (1x2) (2)
2.5.3 Explain the difference between divergent and convergent plate boundaries.
(2x2) (4)
56
Downloaded from hlayiso.com
2.5.4 In a paragraph of no more than EIGHT lines, discuss FOUR pieces of evidence to
prove that the continents were once joined. (4x2) (8)
[60
SECTION B
QUESTION 3: GEOGRAPHICAL SKILLS AND TECHNIQUES
3.1 MULTIPLE CHOICE QUESTIONS
3.1.1 Identify the man-made feature found at 6 on the orthophoto map.
A. hospital
B. school
C. cemetery
D. golf course
3.1.2 The distance between F in block B1 and G in block B3 on the topographic map
is…kilometres.
A. 5.5
B.2.75
C. 2750
D. 0.55
3.1.3 The height indicator (s) in block D2 include…
A. Spot height and contour line
B. Benchmark and trigonometrical station.
C. Spot height and benchmark.
D. Trigonometrical station and spot height.
3.1.4 The contour interval of an orthophoto map is…
A. 5
B. 20
C. 10
D. 15
3.1.5 The feature at 26º 33’ 47’’S 29º 55’ 40’’E on the topographic map is a/an…
A. dam
B. wind pump
C. reservoir
D. monument
[5]
57
Downloaded from hlayiso.com
3.2 MAP CALCULTIONS AND TECHNIQUES
A tourist visiting Wesselton in Ermelo requires specific information regarding its location.
3.2.1 State the topographic map index/code of Ermelo. (1x1) (1)
3.2.2 Determine the coordinates of Wesselton in block A4 on the topographic
map. (2x1) (2)
3.2.3 Calculate the area of the demarcated block on the topographic map. The answer
must be in Km². Show ALL calculations. Marks will be awarded for calculations.
Clearly indicate the unit of measurement in your answer.
(5x1) (5)
[8]
3.3 APPLICATION AND INTERPRETATION
3.3.1 Does the mapped area receive annual or seasonal rainfall? (1x1) (1)
3.3.2 Give TWO pieces of evidence from the topographic map to support
your answer. (2x1) (2)
3.3.3 Refer to G (block B3), H (block C4) and I (block B5)
a. Describe the general topography (slope) of the southern section of
G, H and I. (1x1) (1)
b. Give a reason from the topographic map to support your answer.
(1x2) (2)
3.3.4 Draw a station model for De Bruin Park showing the following
conditions:
• Clear skies
• Air temperature 23ºC
• Dew point temperature 4ºC
• South-easterly wind
• Wind speed 10 knots
(5x1) (5)
[11]
3.4 GEOGRAPHICAL INFORMATION SYSTEM (GIS)
3.4.1 Define the concept remote sensing. (1x2) (2)
3.4.2 Name one remote sensing device used to capture data. (1x2) (2)
3.4.3 State disadvantage of remote sensing. (1x2) (2)
[6]
[30
TOTAL: 150
58
Downloaded from hlayiso.com
GAUTENG DEPARTMENT OF EDUCATION
EXEMPLAR
GEOGRAPHY
Mid-year exam
SECTION A: THE ATMOSPHERE AND GEOMORPHOLOGY
QUESTION 1: THE ATMOSPHERE
1.1 1.1.1 G (1)
1.1.2 E (1)
1.1.3 F (1)
1.1.4 I (1)
1.1.5 A (1)
1.1.6 C (1)
1.1.7 B (1)
1.1.8 D (1) (8X1) (8)
59
Downloaded from hlayiso.com
1.2 1.2.1 Solar constant (1)
1.2.2 Absorption (1)
1.2.3 Reflection (1)
1.2.4 Radiation (1)
1.2.5 Insolation (1)
1.2.6 Convection (1)
1.2.7 Scattering (1) (7x1) (7)
1.3 1.3.1 The natural heating of the atmosphere through absorption and
reflection of terrestrial radiation. (2)
[CONCEPT] (1X2) (2)
1.3.2 Carbon dioxide (1)
Methane (1)
Nitrous oxide (1)
Water vapour (1)
CFC’s (1)
HCFC’s (1)
[ANY ONE] (1X1) (1)
1.3.3 Greenhouse gasses are crucial to keeping our planet at a suitable temperature for
life. (2)
Some of the infrared radiation from the Sun passes through the atmosphere, but
most is absorbed and re-emitted in all directions by greenhouse gas molecules. (2)
Without the greenhouse effect, the Earth would be too cold to live on, like the moon.
(2)
[ANY ONE] (1X2) (2)
1.3.4 Humans are increasingly influencing the climate and the earth's temperature by
burning fossil fuels, cutting down forests and farming livestock. (2)
Some gases in the Earth's atmosphere act a bit like the glass in a greenhouse,
trapping the sun's heat and stopping it from leaking back into space and causing
global warming. (2)
Natural causes, such as changes in solar radiation or volcanic activity (2)
[ANY ONE] (1X2) (2)
1.3.5 IMPACTS ON PEOPLE
Every degree Celsius that the planet heats up, crop yields will go down 5 to 15
percent. Food insecurity can lead to mass human migration and political instability.
(2)
Global warming will cause infectious diseases such as malaria, cholera, or dengue to
spread to many more areas of the planet. (2)
People around the world are affected by extreme weather events, such as hurricanes
or typhoons, floods, heat waves, wildfires, droughts, and snowstorms. (2)
60
Downloaded from hlayiso.com
Increase in disease and waterborne disease (2)
Extreme heat can lead to exhaustion, heat cramps, heat stroke, and
heat-related death. People with chronic lung or heart illnesses or other
conditions are at greater risk of heat-related complications or death. (2)
IMPACTS ON THE ENVIRONMENT
Warmer temperature cause sea level to rise due to the thermal
expansion of seawater. Water from melting glaciers and the ice sheets
of Greenland and the Antarctica would also add water to the ocean. (2)
More severe heat waves, floods, and droughts are expected in a
warmer climate. (2)
Climate change can alter where species live and how they interact, which could
fundamentally transform current ecosystems. (2)
Global warming is having a profound impact on the processes of soil
degradation and is contributing to the desertification of areas on the
planet, (2)
[ ANY FOUR. CANDIDATES MUST REFER TO BOTH IMPACTS ON
PEOPLE AND THE ENVIRONMENT] (4X2) (8)
1.4 1.4.1 Atlantic Ocean (1) (1x1) (1)
1.4.2 Ocean currents (1)
Altitude (1)
Latitude (1)
Distance from the sea (1)
Aspect (1)
[ANY TWO] (2X1) (2)
1.4.3 1: Warm Agulhas (1)
2: Cold Benguela (1) (2x1) (2)
1.4.4 It modulates the rainfall along the east coast and interior regions of South Africa (2)
Providing the latent heat of evaporation needed for onshore wind systems to pick up
moisture and carry it inland. (2)
The Agulhas Ocean current is a warm ocean current and therefore will bring in high
temperatures. (2)
As the warm air rises and cools down, there will be rainfall on the east coast. (2)
[ANY TWO] (2X2) (4)
1.4.5 Due to the fact that most the world’s warm currents occur on the east coasts of
continents (2)
The warmer currents cause more evaporation and more rainfall (2)
Causes east coast areas to have mild winters and cooler summers due to the
humidity which also makes the east coast areas feel warmer (2)
The warm current moderate the temperatures along the east coasts causing the
temperatures to be generally warmer than the west coast area (2)
[ANY THREE] (3X2) (6)
61
Downloaded from hlayiso.com
1.5 1.5.1 Global warming (1)
1.5.2 Global warming refer to the increase in average temperature on
earth. (2)
[CONCEPT] (1X2) (2)
1.5.3 The cutting down of trees and removal of natural vegetation. (2)
Increase in carbon dioxide from burning fossil fuels in factories, coal-fired power
stations, carbon dioxide from the burning of fuels in transportation. (2)
Methane from rice paddles, cattle, and clathrates. (2)
When the waste in landfills begins to decompose/break down it releases harmful
gases into the atmosphere which contribute to global warming. (2)
[ANY TWO] (2X2) (4)
1.5.4 Renewable energies
The first way to prevent climate change is to move away from fossil fuels. Renewable
energies like solar, wind, biomass and geothermal. (2)
Sustainable transportation
Promoting public transportation, carpooling, but also electric and
hydrogen mobility, can help reduce CO2 emissions and thus
fight global warming. (2)
Sustainable infrastructure
In order to reduce the CO2 emissions from buildings - caused by heating, air
conditioning, hot water or lighting - it is necessary both to build new low energy
buildings, and to renovate the existing constructions. (2)
Sustainable agriculture & forest management
Encouraging better use of natural resources, stopping massive deforestation as well
as making agriculture greener and more efficient should also be a priority. (2)
Reforestation is the most cost-effective way to prevent global warming,
trees absorb carbon dioxide so planting more trees can help reduce
the amount of carbon in our atmosphere. (2)
Ensuring sustainable development
A successful global compact on climate change must include financial
assistance from richer countries to poorer countries to help make the
transition to low-carbon development pathways and to help adapt to the impacts of
climate change. (2)
[ANY FOUR] (4X2) (8)
QUESTION 2
62
Downloaded from hlayiso.com
2.1 2.1.1 D (1)
2.1.2 H (1)
2.1.3 F (1)
2.1.4 I (1)
2.1.5 G (1)
2.1.6 A (1)
2.1.7 E (1)
2.1.8 B (1) (8X1) (8)
2.2 2.2.1 C (limbs) (1)
2.2.2 B (syncline) (1)
2.2.3 C (recumbent) (1)
2.2.4 B (compression) (1)
2.2.5 A (tension) (1)
2.2.6 A (faulting) (1)
2.2.7 D (cracks) (1) (7x1) (7)
2.3 2.3.1 Oceanic crust. (1)
2.3.2 The crust and upper part of the mantle. (2)
2.3.3 Thinnest: Crust (1)
Thickest: Mantle (1)
2.3.4 3: Outer core (1)
4: Inner core (1)
2.3.5 Crust (1) and Inner core (1)
2.3.6 Nickel (1) and Iron (1)
2.3.7 Above: Lava (2)
Below: Magma (2)
2.4 2.4.1 Composite volcano (1) (1x1) (1)
2.4.2 Crater (2) (1x2) (2)
2.4.3 Along plate boundaries (2) (1x2) (2)
63
Downloaded from hlayiso.com
2.4.4 Igneous rock (2) (1x2) (2)
2.4.5 POSITIVE
Creates a tourist attraction which creates jobs and income (2)
Can be used to generate geothermal energy (2)
Can be used for research into composite of earth rock weathers to
form fertile soil (2)
Volcanoes help in the formation of valuable minerals like diamond,
gold, silver. (2)
Volcanic mountains facilitate moderation of climate and receive higher
rainfall than flat areas. (2)
Igneous rocks are used for the construction of roads, houses, bridges,
etc. (2)
Fishing is likely to be found in crater lakes. (2)
[ANY TWO]
NEGATIVE
Destroys homes due to fires (2)
They can kill people and damage property. (2)
Economic activity can suffer as it is hard for businesses to operate
after an eruption. (2)
Cause loss of crops and livestock (2)
The heat from the eruption and the hot lava causes the destruction of
the natural habitat of the species living around the area as it kills every
living thing nearby. (2)
Ash and gases cause breathing problems (2)
Can cause fires which destroys natural vegetation (2)
[ANY TWO] (4x2) (8)
2.5 2.5.1 Continental drift (1) (1x1) (1)
2.5.2 Pangaea (2) (1x2) (2)
2.5.3 Divergent plate boundary occurs when tectonic plates are moving away from each
other (2) whereas convergent plate boundary occurs when tectonic plates are
moving towards each other (2) (2x2) (4)
64
Downloaded from hlayiso.com
2.5.4 Identical rocks, of the same type and age, are found on both sides of the Atlantic
Ocean. Mountain ranges with the same rock types, structures, and ages are now on
opposite sides of the Atlantic Ocean (2)
Ancient fossils of the same species of extinct plants and animals are found in rocks
of the same age but are on continents that are now widely separated. (2)
Grooves and rock deposits left by ancient glaciers are found today on different
continents very close to the equator. (2)
Coral reefs and coal-forming swamps are found in tropical and subtropical
environments, but ancient coal seams and coral reefs are found in locations where it
is much too cold today. (2)
Africa and South America appeared to fit together like puzzle pieces. (2)
(4x2) (8)
[60]
SECTION B
QUESTION 3: GEOGRAPHICAL SKILLS AND TECHNIQUES
3.1 3.1.1 A (1)
3.1.2 B (1)
3.1.3 B (1)
3.1.4 A (1)
3.1.5 B (1) (5X1) (5)
3.2 3.2.1 2629DB (1) (1X1) (1)
3.2.2 26º 30’ 58’’ S 29º 58’ 12’’ E (2) (2x1) (2)
3.2.3 Formula: Area = length (L) x breadth (B)
Length = 4,2 cm (1) x 0,5 = 2,1 km (Range 2,0 – 2,2)
(4,1 cm – 4,3 cm)
[Accept other formulas to calculate length.]
Breadth = 3,8 cm (1) x 0,5 = 1,9 km (Range 1,8 – 1,10)
(3,7 cm – 3,9 cm)
[Accept other formulas to calculate breadth.]
= 2,1 km (1) x 1,9 km (1)
= 3,99 km² (1)
Range: 3,79 km² – 4.1 km²
65
Downloaded from hlayiso.com
[Accept other calculation methods.] (5x1) (5)
3.3 3.3.1 Seasonal rainfall (1) (1x1) (1)
3.3.2 The area is dominated by non-perennial rivers (1)
There are dams (1)
There are reservoirs (1) (2x1) (2)
3.3.3 a. The slope is gentle (1) (1x1) (1)
b. The contour lines are further apart (2) (1x2) (2)
3.3.4
3.4 3.4.1 Information gathering from a distance, e.g., using aircrafts etc. (2)
(1x2) (2)
3.4.2 Satellites // Aircrafts (2) (1x2) (2)
3.4.3 Equipment is expensive (2)
resolution is poor (2)
data interpretation is difficult (2)
[ANY ONE] (1X2) (2)
[30]
TOTAL: 150
66
Downloaded from hlayiso.com
MID-YEAR EXAMINATION
COGNITIVE GRID
67
Downloaded from hlayiso.com
GRADE 10 EXEMPLAR
SBA ITEM 1
CONTROLLED TEST 2
68
Downloaded from hlayiso.com
GAUTENG DEPARTMENT OF EDUCATION
EXEMPLAR
GEOGRAPHY
CONTROLLED TEST 2
INSTRUCTIONS AND INFORMATION
10. This question paper consists of SIX sub-sections
11. Answer ALL the questions for 60 marks.
12. All diagrams / extracts are included.
13. Leave a line between subsections of questions.
14. Number the answers correctly according to the numbering used in the question paper.
15. Do NOT write in the margins of the Answer sheet/ Folio paper
16. Paragraph questions must be answered in full sentences
17. Write neatly and legibly.
69
Downloaded from hlayiso.com
1.1 Refer to the two pyramids below that explains the population of a country and choose between
pyramids A and B from COLUMN B that gives the correct description for the statement in
column A. Write only Pyramid A or Pyramid B next to the question numbers (1.1.1 to 1.1.7) on
the answer sheet, e.g.,1.1.8 Pyramid B.
COLUMN A COLUMN B
1.1.1 The pyramid indicating a country with the highest birth Pyramid A
and death rates is … Pyramid B
1.1.2 The pyramid indicating a country with the slowest Pyramid A
population growth is … Pyramid B
1.1.3 The pyramid indicating a country with the lowest life Pyramid A
expectancy is … Pyramid B
1.1.4 The pyramid indicating a country with a large number of Pyramid A
adults is … Pyramid B
1.1.5 The pyramid indicating a developing country is … Pyramid A
Pyramid B
1.1.6 The pyramid indicating a country with the best Pyramid A
developed medical infrastructure is … Pyramid B
1.1.7 The pyramid that represents a country with a healthy Pyramid A
workforce is … Pyramid B
70
Downloaded from hlayiso.com
(7 x 1) (7)
1.2 Refer to the following statements and say if the following factors will lead to a
DENSE or SPARSE population density e.g., 1.2.9 dense
1.2.1 Mountainous areas will lead to (dense/sparse) population.
1.2.2 Moderate climates e.g., coastlines will lead to (dense/sparse) population.
1.2.3 Flat grasslands e.g., Highveld will lead to a (dense/sparse) population.
1.2.4 Flat areas with infertile soil e.g., Karoo will lead to a (dense/sparse)
population.
1.2.5 The availability of minerals e.g., gold will lead to (dense/sparse) population.
1.2.6 Dry areas e.g., Deserts will lead to (dense/sparse) areas populations.
1.2.7 Areas with dense forests e.g., Amazon Forest will lead to a
(dense/spares) population
1.2.8 Areas with lots of industries will lead to a (dense/sparse) population.
(8 x 1) (8)
[15]
1.3 Study the FIGURE below that refer to Human Population Growth.
1.3.1 Describe how the growth rate is calculated? (1 x 2) (2)
71
Downloaded from hlayiso.com
1.3.2 Refer to FIGURE 1.3 and determine if the population growth rate between AD and
1800 was steady or rapid growing. (1 x 1) (1)
1.3.3 Explain how the birth rate and death rate compare with each other
Between AD and 1800. (1 x 2) (2)
1.3.4 Can the period between 1800 and 2000 be described as a period of population
growth or population explosion? (1 x 1) (1)
1.3.5 Refer to FIGURE 1.3 and identify TWO problems the earth must cope with
to sustain life. (2 x 1) (2)
1.3.6 Discuss how each of the following factors will increase the population
growth in the world.
(a) Medical facilities.
(b) Sanitation
(c) Food supplies. (3 x 2) (6)
[14]
72
Downloaded from hlayiso.com
1.4 Refer to FIGURE 1.4 an infographic based on Rural Urban Migration.
Unpleasant working conditions
forcing people to leave work areas
Favorable factors attracting people
to cities
1.4.1 Define the term rural urban migration. (1 x 2) (2)
1.4.2 Discuss TWO problems people experience in the rural area. (2 x 2) (4)
1.4.3 Give ONE pull factor why people would prefer to stay in urban areas.
(1 x 2) (2)
1.4.4 Identify the province in the bar-graph with the highest urban population.
(1 x 1) (1)
1.4.5 How many people are staying in the urban areas in the province mentioned in
QUESTION1.4.4. (1 x 1) (1)
1.4.6 Identify the province where the difference between the rural and urban
73
Downloaded from hlayiso.com
population are the biggest. (1 x 2) (2)
1.4.7 Explain the large difference between rural and urban population in the
Province identified in QUESTION 1.4.6 by referring to industrialization (many
factories) and area available for agriculture. (2 x 2) (4)
[16]
1.5 Refer to the SOURCE on Refugees.
REFUGEES FLEE FROM ATTACS BY SOUTH-AFRICANS
John left Zimbabwe with the hope to find a safe haven in South-Africa.Now he
is in faer for his life.”I left my home to be able to provide for my family”.It is
actually better to stay at home and die of hunger than to die in this country.A
group of local people attacked John in Johannesburg.They robbed him of all
his valuables.
1.5.1 Explain the term Refugee. (1 x 2) (2)
1.5.2 Refer to SOURCE 1.5 and determine if John can be seen as a forced or voluntary
migrant. Quote evidence from the source to proof your answer.
(1 + 1 x 2) (3)
1.5.3 John was most probably attacked by the local people because of xenophobia.
Explain the term xenophobia. (1 x 2) (2)
1.5.4 In a paragraph of approximately EIGHT lines discuss TWO reasons why
Zimbabweans would emigrate to South-Africa and TWO challenges they will
experience in South-Africa. (4 x 2) (8)
[15]
Total: 60
GAUTENG DEPARTMENT OF EDUCATION
EXEMPLAR
74
Downloaded from hlayiso.com
GEOGRAPHY
CONTROL TEST 2 Marking Guideline
INSTRUCTIONS AND INFORMATION
18. This question paper consists of SIX sub-sections
19. Answer ALL the questions for 60 marks.
20. All diagrams / extracts are included.
21. Leave a line between subsections of questions.
22. Number the answers correctly according to the numbering used in the question paper.
23. Do NOT write in the margins of the Answer sheet/ Folio paper
24. Paragraph questions must be answered in full sentences
25. Write neatly and legibly.
1.1 Refer to the two pyramids below that explains the population of a country and choose
between pyramids A and B from COLUMN B that gives the correct description for the
statement in column A. Write only Pyramid A or Pyramid B next to the question
numbers (1.1.1 to 1.1.7) on the answer sheet, e.g.,1.1.8 Pyramid B
75
Downloaded from hlayiso.com
COLUMN A COLUMN B
1.1.1 The country with the highest birth and death rates Pyramid A
are … Pyramid B
1.1.2 The country with the slowest population growth is … Pyramid A
Pyramid B
1.1.3 The country with the lowest life expectancy is … Pyramid A
Pyramid B
1.1.4 The country with a large number of adults is … Pyramid A
Pyramid B
1.1.5 The country that can be seen as a developing country is Pyramid A
… Pyramid B
1.1.6 The country with the best developed medical Pyramid A
infrastructure is … Pyramid B
1.1.7 The country with a healthy workforce up to the age of 65 Pyramid A
years is … Pyramid B
(7x 1) (7)
1.1.1 PYRAMID B 1.1.6 PYRAMID A
1.1.2 PYRAMID A 1.1 7 PYRAMID B
1.1.3 PYRAMID B
1.1.4 PYRAMID A
1.1.5 PYRAMID B
1.2 Refer to the following statements and say if the following factors will lead to a
DENSE or SPARSE population density e.g., 1.2.9 dense
1.2.1 Mountainous areas will lead to (dense/sparse) population.
1.2.2 Moderate climates e.g., coastlines will lead to (dense/sparse) population.
1.2.3 Flat grasslands e.g., Highveld will lead to a (dense/sparse) population.
76
Downloaded from hlayiso.com
1.2.4 Flat areas with infertile soil e.g., Karoo will lead to a (dense/sparse)
population.
1.2.5 Many minerals e.g., Gauteng will lead to (dense/sparse) population.
1.2.6 Dry areas e.g., Deserts will lead to (dense/sparse) areas populations.
1.2.7 Areas with dense forests e.g., Amazon Forest will lead to a
(dense/spares) population
1.2.8 Areas with lots of industries will lead to a (dense/sparse) population.
(8x1) (8)
1.2.1 SPARSE 1.2.5 DENSE
1.2.2 DENSE 1.2.6 SPARSE
1.2.3 DENSE 1.2.7 SPARES
1.2.4 SPARSE 1.2.8 DENSE
[15]
77
Downloaded from hlayiso.com
1.3 Refer to the infographic based on HUMAN POPULATION GROWTH and answer the
following questions.
1.3.1 How is the growth rate calculated. (1x2) (2)
By finding the difference between birth rate and death rate
1.3.2 Determine if the population growth rate between AD and 1800 was steady
or rapid growing (1X1) (1)
Steady
1.3.3 Explain how the birth rate and death rate compare with each other during this
period . (1x2) (2)
Birth rate and death rate the same/equal/cancels each
other
1.3.4 Determine if the period between 1800 and 2000 is known as population growth or
population explosion (1x1) (1)
Population explosion
1.3.5 Refer to figure 1.3 and identify two problems the earth must cope to
sustain life. (2x1) (2)
78
Downloaded from hlayiso.com
• World deliverance
• Food systems
1.3.6 Discuss how the factors mentioned below will increase the population growth
in the world
(d) Medical facilities.
(e) Sanitation.
(f) Food supplies. (3x2) (6)
(Discuss one fact for each factor)
Medical facilities:
• Better treatment of diseases
• Vaccination against diseases
• More doctors/hospitals etc.
• Advance in technology of medicine
Sanitation:
• Reduced infections
• More hygienic living conditions
• Control of pests (examples can be given)
• Reduce risks of spread of germs/epidemics
Food supplies:
• More food produced for growing population
• Healthier diet.
(Must refer to all three factors. Other options can also be considered)
[14]
79
Downloaded from hlayiso.com
1.4 Refer to the infographic based on RURAL URBAN MIGRATION and answer the
following questions.
Unpleasant factors forcing people to
leave rural areas
Favorable factors attracting people
to cities
1.4.1 Define the term rural urban migration. (1x2) (2)
The movement/migration of people from rural to urban areas
1.4.2 Discuss two problems people experience in the rural areas (2x2)
(4)
• Lack of jobs
80
Downloaded from hlayiso.com
• Poor schools
• Poor medical services
• Lack of housing/entertainment
• Drought/infertile soil
• Poor working conditions
• Not safe to stay
(Accept other answers) ( Answers must be in full sentences)
1.4.3 Give one Pull factors why people would prefer to stay in urban areas. (1x2) (2)
• Enough jobs
• Good education
• Enough housing
• Good services (examples are acceptable)
• Good entertainment
• Near good medical facilities
(Accept other answers)
1.4.4 Identify the province with the highest urban population. (1x1) (1)
KwaZulu Natal / KZN
1.4.5 Give the number of people staying in the urban areas in the province mentioned in
question1.4.4. (1x1) (1)
10 million / 10 000 000
1.4.6 Identify the province where the difference between the rural and urban population are the
biggest. (1x2) (2)
Gauteng
1.4.7 Explain the large difference between rural and urban population in this
Province identified in question 1.4.6 by referring to Industrialization (many factories)
and Area available for agriculture
Industrialization
• Gauteng is highly industrialized and will attract many people because of
job opportunities to stay in cities
(Accept any similar type of answer)
Area available for agriculture
• Gauteng province has the smallest area for agriculture to take place
(Accept any similar type of answer)
(2x2) (4)
[16]
81
Downloaded from hlayiso.com
1.5 Refer to the source below on Refugees and answer the questions that follow:
REFUGEES FLEE FROM ATTACS BY SOUTH-AFRICANS
John left Zimbabwe with the hope to find a safe haven in South-Africa.Now he is in faer for
his life.”I left my home to be able to provide for my family”.It is actually better to stay at
home and die of hunger than to die in this country.A group of local people attacked John in
Johannesburg.They robbed him of all his valuables.
1.5.1 Explain the term Refugee. (1x2) (2)
Refugees are people that migrate temporarily or permanent because their lives
1.5.2 Refer to the source and determine if John can be seen as a forced or voluntary
Migrant. Give a quote from the source to proof your answer. (1+1x2) (3)
Voluntary: “John left Zimbabwe with the hope to find a safe haven in SA”
“I left home to be able to provide for my family”
1.5.3 John was most probably attacked by the local people because of xenophobia.
Explain the term xenophobia. (1x2) (2)
Strong fear/dislike of foreign people because of their culture/customs
1.5.4 In a paragraph of ±8 lines discuss two reasons why Zimbabweans would emigrate to
South-Africa and two challenges they will experience in South-Africa.
(4x2) (8)
TWO REASONS:
•
The perception of more jobs in SA
•
Country with a good infrastructure (can give examples)
•
Good opportunity to start his own business
•
Good opportunity to find a job because immigrants are prepared to work for less
money
(Any valid reason related to question)
TWO CHALLENGES:
• Will find local people hostile towards them
• Will find it difficult to get a job
• Will find it difficult to get housing
• End up in poverty
• Find it difficult to adapt to new customs and cultures
(Any valid challenge related to answer)
82
Downloaded from hlayiso.com
(Answers must be in full
sentences)
[15]
Total: 60
CONTROLLED TEST 2
COGNITIVE GRID
83
Downloaded from hlayiso.com
GRADE 10 EXEMPLAR
SBA ITEM 6
FINAL EXAMINATIONS
PAPER 1
84
Downloaded from hlayiso.com
GAUTENG DEPARTMENT OF EDUCATION
EXEMPLAR
GEOGRAPHY
Final Exam
GRADE 10
PAPER 1
85
Downloaded from hlayiso.com
INSTRUCTIONS AND INFORMATION paper 1 EXAM
1. This question paper consists of THREE questions:
● QUESTION 1: The Atmosphere (60)
● QUESTION 2: Geomorphology (60)
● QUESTION 3: Mapwork (30)
2. Answer ALL THREE questions.
3. All diagrams are included in this paper.
4. Illustrate your answers with labelled diagrams, where possible.
5. Start EACH question at the top of a NEW page.
6. Number the answers correctly according to the numbering system used in this question
paper. Number the answers on the margin of the line.
7. Draw the margin on the right-hand side of ALL pages in the folio booklet and DO NOT
write in the margins.
8. Write neatly and legibly.
9. You may use a non-programmable calculator and a magnifying glass.
10. The unit of measurement must be given in the final answer, where applicable, e.g.,
10km, 4ºC, East
11. Answer in FULL SENTENCES, except when you have to state, name, identify or list.
12. DO NOT MAKE ANY MARKINGS ON THIS MAP!
SECTION B: MAPWORK AND APPLICATION:
RESOURCE MATERIAL
1. An extract from topographic map 2930AC & AD HOWICK
2. Orthophoto map 2930AC 25 HOWICK
INSTRUCTIONS, INFORMATION AND RESOURCE MATERIAL
1. You are provided with an extract from the 1:50 000 topographical map 2930AC & AD
HOWICK and an orthophoto map 2930AC 25 HOWICK of a part of the mapped area.
2. You must hand in the topographical map and orthophoto map to the invigilator at the
end of the examination session.
86
Downloaded from hlayiso.com
3. Show all calculations and use the supplied formulae, where applicable. Marks will be
allocated for these.
4. NO marks will be awarded for answers to the incorrect units.
5. The area demarcated in RED on the topographical map represents the area covered
by the orthophoto map.
6. You may use a magnifying glass.
7. The following English terms and their Afrikaans translations are shown on the
topographical map:
ENGLISH AFRIKAANS
Furrow Voor
Golf course Gholfbaan
River Rivier
Sewage works Rioolwerke
Weir Stuwal
87
Downloaded from hlayiso.com
SECTION A: THE ATMOSPHERE AND GEOMORPHOLOGY
QUESTION 1: THE ATMOSPHERE
1.1. Study FIGURE 1.1 of a weather station model below and match each statement with a letter
on the diagram. Letters may be used more than once.
FIGURE 1.1
1.1.1 Shows the cloud cover for the area. (1)
1.1.2 Rain is the precipitation shown. (1)
1.1.3 Dew point temperature is shown here. (1)
1.1.4 Wind speed is shown here (1)
1.1.5 The wind direction is shown as NE. (1)
1.1.6 This number shows the temperature in degrees Celsius (1)
1.1.7 This symbol represents overcast. (1)
(7)
1.2. Choose the correct word or phrase from those given in brackets. Write only the question
number and word onto your answer sheet. E.g., 1.2.1
1.2.1 In the lowest layer of our atmosphere, temperature generally
(increases/decreases) with altitude. (1)
1.2.2 (Oxygen / Nitrogen) is the most prominent gas in the atmosphere. (1)
1.2.3 (Longwave / Shortwave) radiation cools the Earth's surface. (1)
1.2.4 The force exerted by the weight of the atmosphere on the earth’s surface is
known as (atmospheric density / atmospheric pressure). (1)
1.2.5 The temperature increases with height is called (diversion/inversion). (1)
1.2.6 Lines joining places of the same pressure are (isobars/isotherms). (1)
(1)
1.2.7 The warm ocean current found along the east coast of South Africa is the (Benguela /
Mozambique) current.
1.2.8 The type of rain usually found in the Western cape is called (frontal /
convection) rainfall. (1)
88
Downloaded from hlayiso.com
1.3. Study FIGURE 1.3 about ozone depletion and then answer the questions that follow.
FIGURE 1.3
1.3.1 Define the term ozone depletion. (1x1)(1)
1.3.2 In which layer of the atmosphere is ozone concentrated? (1x1)(1)
1.3.3 Identify THREE causes of ozone depletion shown in FIGURE 1.3. (3x1)(3)
1.3.4 Describe ONE way in which the depletion of the ozone layer will
affect humans. (1x2)(2)
1.3.5 In a paragraph of approximately EIGHT lines discuss the effects of
ozone depletion and strategies used to reduce ozone depletion. (4x2)(8)
(15)
89
Downloaded from hlayiso.com
1.4. Study FIGURE 1.4 below which shows the types of heating in the atmosphere and
answer the questions that follow.
FIGURE 1.4
1.4.1 Name the factor that is causing the difference in temperature in FIGURE
X and Y respectively. (2x1)(2)
1.4.2
Refer to FIGURE X.
a. Identify the type of sun rays that will take place at the equator and
polar regions respectively. (2x1)(2)
b. Is temperature likely to be higher at area A or area B? (1x1)(1)
c. Provide TWO reasons to support your answer to QUESTION 1.4.2a. (2x2)(4)
1.4.3 Refer to FIGURE Y.
a. Discuss why the temperature would change from sea level to 3000m
on the mountain. (2x2)(4)
b. Describe how the area of the ground has an effect on the temperature (1x2)(2)
change.
(15)
90
Downloaded from hlayiso.com
1.5. Refer to FIGURE 1.5 on a type of rainfall and answer the following questions.
FIGURE 1.5
1.5.1 Identify the type of rainfall depicted by FIGURE 1.5. (1x1)(1)
1.5.2 In which province is the rainfall in FIGURE 1.5 most commonly found? (1x1)(1)
1.5.3
a. Name the type of cloud labelled A. (1x1)(1)
b. Describe TWO weather conditions associated with the type of cloud
mentioned in QUESTION 1.5.3a. (2x2)(4)
1.5.4 Discuss how the type of rainfall in FIGURE 1.5 is created. (2x1)(2)
1.5.5 Examine the negative impacts of thunderstorms on people and the environment.
(3x2)(6)
(15)
TOTAL QUESTION 1: 60 MARKS
91
Downloaded from hlayiso.com
QUESTION 2: GEOMORPHOLOGY
2.1. Read the following statements and choose the appropriate word or phrase in brackets which
will make the statements TRUE. write down only the question number and the answer. E.g., 2.1.9
Clouds
2.1.1 An earthquake is the shaking and vibration of the Earth’s crust due to the
movement of the Earth’s (plates/magma). (1)
2.1.2 Earthquakes usually occur along (tectonic plate boundaries/continental drift
regions). (1)
2.1.3 Earthquakes are caused when tension is released inside the Earth’s
(crust/core). (1)
2.1.4 The point inside the Earth where pressure is released is called the
(epicentre/focus) (1)
2.1.5 The point on the Earth’s surface that is directly above the earthquake is called
the (epicentre/focus). (1)
2.1.6 Energy released by an earthquake is in the form of (seismic
waves/aftershocks). (1)
2.1.7 The strength or magnitude of an earthquake is measured using (Sonar
graph/Richter scale). (1)
2.1.8 (Convergent/Divergent) are the most destructive earthquake zones. (1)
(8)
2.2. Match the letters in FIGURE 2.2 to the statements below. Write only the question number and
the letter. E.g., 2.2.8 G. Letters may be uses more than once.
FIGURE 2.2
2.2.1 Smaller mushroom-shaped intrusions that force the land upwards (1)
92
Downloaded from hlayiso.com
2.2.2 Magma that has cooled parallel to the layers of strata. (1)
2.2.3 Magma that forces itself vertically through the layers. (1)
2.2.4 The largest dome-shaped intrusion. (1)
2.2.5 The vent which allows volcanic eruptions to take place. (1)
2.2.6 A saucer-shaped intrusion that creates a sink in the land. (1)
2.2.7 Igneous formation that occurs inside the land (1)
(7)
2.3. Refer to FIGURE 2.3 showing the structure of the Earth and then answer the questions that
follow.
FIGURE2.3
2.3.1 Redraw and fill in the table below. Make sure to include the name and thickness of
each layer from the following:2900km; 90km; 1200km; 2250km.
93
Downloaded from hlayiso.com
(8x1)(8)
2.3.2 Layer B is broken up into small segments. What are these segments
called? (1x1)(1)
2.3.3 Explain how layer D results in volcanic activity. (1x1)(1)
2.3.4 Describe TWO ways in which the layer labelled B is important to
humans. (2x2)(4)
2.3.5 Identify ONE type of metal that makes up layer A. (1x1)(1)
(15)
2.4. Refer to FIGURE 2.4 showing folding and faulting and then answer the questions that follow.
FIGURE 2.4
2.4.1 Differentiate between a syncline and an anticline. (2x1)(2)
2.4.2 Identify the type of fold that is indicated at the letter A. (1x1)(1)
94
Downloaded from hlayiso.com
2.4.3 Briefly explain why folding occurs in regions where the sedimentary rock
has been deposited. (2x2)(4)
2.4.4 In a paragraph of approximately EIGHT lines explain how folds change
and develop from a symmetrical fold to an overturned fold. Make sure to make
mention of the type of plate boundary and type of pressure. (4x2)(8)
[15]
2.5. Refer to FIGURE 2.5 and the article on the eruption at Mount Pelée and answer the
questions that follow.
FIGURE 2.5
2.5.1 Give a geographical term for the phrase 'Old Pelee was dead'. (1x1)(1)
2.5.2 (1x1)(1)
What is the name given to the big hole through which material is ejected?
2.5.3 (2x2)(4)
State TWO characteristics of Mount Pelee that suggest that it is a composite
volcano.
2.5.4 Identify ONE negative effect of a volcanic eruption. (1x2)(2)
2.5.5 Volcanic activity has many positive effects on an area. Discuss the positive
effects of volcanoes on the economy and the environment.
(3x2)(6)
TOTAL QUESTION 2: 60 MARKS (15)
95
Downloaded from hlayiso.com
SECTION B:
QUESTION 3: GEOGRAPHICAL SKILLS AND TECHNIQUES
• Study the background information on Howick below and answer the questions that
follow. The following resources was sent via WhatsApp:
GENERAL INFORMATION ON HOWICK
Howick is located in the heart of the Midlands along the N3 in KwaZulu Natal. Located 1050m
above sea level, with warm summers and cool winters, which can turn chilly when there are
snowfalls on the nearby Drakensberg. Howick has a booming forestry industry that is great for
the economy. The most well-known landmark for the town is Howick Falls – the Umgeni River
falling approximately 95m over dolerite cliffs en route to the Indian Ocean.
96
Downloaded from hlayiso.com
3.1. MAP SKILLS AND CALCULATIONS
Various options are provided as possible answers to the following questions. Choose the
answer and write only the letter (A-D) next to the question number on your FOLIO PAPER.
3.1.1 The scale of the topographical map as a word scale is…
A. One centimetre on the map represents fifty centimetres in reality.
B. One centimetre on the map represents half a kilometre in reality.
C. One millimetre on the map represents five hundred metres in reality.
D. One centimetre on the map represents fifty thousand centimetres in
reality. (1X1)(1)
3.1.2 Refer to the topographic map. The direction of spot height 1030 in block E3 from
spot height 1048 in block E2 is…
A. NW
B. NE
C. SE
D. SW (1X1)(1)
3.1.3 Refer to the orthophoto map.
a. Draw a freehand cross-section from spot height 1006 in block C4 to
spot height 987 in block C5. Ensure you label the Mgeni river. (2+1)(3)
b. Calculate the gradient from spot height 1006 in block C4 to spot height
987 in block C5. Round of to TWO decimal place.
(5x1)(5)
(10)
3.2. MAP INTERPRETATION
Various options are provided as possible answers to the following questions. Choose the
correct answer and write only the letter (A-D) next to the question number.
3.2.1 Refer to block C2. Identify the type of primary economic activity taking
place to the right of the Shelter River.
A. Fishing
B. Forestry
C. Farming
D. Mining
(1X1)(1)
3.2.2 Identify the fire protection feature the farmer has installed along his farm
in block B4.
A. Row of trees
B. Windbreak
C. Fire Break
(1X1)(1)
97
Downloaded from hlayiso.com
D. Furrow
3.2.3 a. What type of rainfall is experienced by the town of Howick? (1x1)(1)
b. Is the rainfall mentioned in QUESTION 3.2.3a seasonal or annual rainfall? (1+2)(3)
Provide evidence from the map.
3.2.4 Refer to the orthophoto map.
a. Identify the feature at 9. (1x1)(1)
b. How does the feature mentioned in QUESTION 3.2.4a benefit the
(1x1)(1)
community of Howick economically?
(1x1)(1)
c. Identify the feature indicated by 8.
3.2.5 Refer to block E3 on the topographic map.
a. In which direction does the Mgeni river flow? (1x1)(1)
b. Give evidence from the map to support your answer in QUESTION
(1x2)(2)
3.2.5a.
(12)
3.3. GIS APPLICATION
Various options are provided as possible answers to the following questions. Choose the
correct answer and write only the letter (A-D) next to the question number.
3.3.1 Identify TWO components of GIS A.
Capture and store.
B. Hardware and people.
C. Geographic data and manipulation.
D. Software and analysing. (1X1)(1)
3.3.2 Refer to the Orthophoto map and answer the questions that follow.
a. Define the term remote sensing. (1x1)(1)
b. Identify ONE way in which images can be remotely sensed. (1x1)(1)
3.3.3 Refer to the topographic map.
a. Differentiate between spatial and attribute data. (2x1)(2)
b. The location of the Howick Falls at F in block E2 on the topographic
map is an example of (attribute/spatial) data. (1x1)(1)
3.3.4 Refer to block A2 on the orthophoto map.
a. Define raster data. (1x1)(1)
b. Identify one point feature in this block. (1x1)(1)
[8]
[30]
98
Downloaded from hlayiso.com
Total for the examination 150
GAUTENG DEPARTMENT OF EDUCATION
EXEMPLAR
GEOGRAPHY
Final exam
GRADE 10
PAPER 1
Marking guideline
99
Downloaded from hlayiso.com
SECTION A: THE ATMOSPHERE AND GEOMORPHOLOGY
QUESTION 1: THE ATMOSPHERE
1.1. Study FIGURE 1.1 of a weather station model below and match each statement with a letter
on the diagram. Letters may be used more than once
1.1.1 D✔ (1)
1.1.2 F✔ (1)
1.1.3 C✔ (1)
1.1.4 E✔ (1)
1.1.5 B✔ (1)
1.1.6 A✔ (1)
1.1.7 D✔ (1)
[7]
1.2. Choose the correct word or phrase from those given in brackets. Write only the question
number and word onto your answer sheet. E.g., 1.2.1 topographic.
1.2.1 Decreases✔ (1)
1.2.2 Nitrogen✔ (1)
1.2.3 Longwave✔ (1)
1.2.4 Atmospheric pressure✔ (1)
1.2.5 Inversion✔ (1)
1.2.6 Isobars✔ (1)
1.2.7 Mozambique✔. (1)
1.2.8 Frontal✔
(1)
[8]
1.3. Study FIGURE 1.3 about ozone depletion and then answer the questions that follow.
1.3.1 Define the term ozone depletion. (1x1)(1)
Ozone Depletion is the gradual thinning of Earth's ozone layer in the
upper atmosphere. ✔
1.3.2 In which layer of the atmosphere is ozone concentrated? (1x1)(1)
Stratosphere✔
100
Downloaded from hlayiso.com
1.3.3 Identify THREE causes of ozone depletion shown in FIGURE 1.3. (3x1)(3)
Deforestation✔
CFC’s✔
Industrial Activity✔
Cars
[ANY THREE]
1.3.4 Describe ONE way in which the depletion of the ozone layer will
affect humans. (1x2)(2)
Less absorption of UV rays✔✔
Cause skin cancer
Cataracts in human and animal eyes
Lowering the immune system
[ANY ONE]
1.3.5 In a paragraph of approximately EIGHT lines discuss the effects of
ozone depletion and strategies used to reduce ozone depletion. (4x2)(8)
Effects
● Increased incidence of malaria✔✔
● Kill phytoplankton in ocean✔✔
● Disrupt marine food web
● Reduce growth in plants
● Excessive UV kills off living tissue.
● Alters weather patterns
● Increases surface temperatures.
● Less absorption of UV rays
● Causes skin cancer
● Cataracts in human and animal eyes
● Lowering the immune system
Strategies
● Use of ozone-friendly products✔✔
● Reduce the production of CFCs✔✔
● Plant more trees to release oxygen through photosynthesis
● Strict regulations to reduce the emissions of cars and
regulations against the burning of fossil fuels
● Use of solar and wind energy to reduce the emissions of the
burning of coal
● Repair refrigerators and air conditioners with leaks
● Keep high altitude flights to a minimum
● Reforestation
● Education
● Recycle
[Must have TWO effects and TWO strategies]
[15]
1.4. Study FIGURE 1.4 below which shows the types of heating in the atmosphere and
answer the questions that follow.
101
Downloaded from hlayiso.com
1.4.1 Name the factor that is causing the difference in temperature in FIGURE
X and Y respectively. (2x1)(2)
X- Latitudinal Heating✔
Y- Altitude✔
1.4.2 Refer to FIGURE X.
a. Identify the type of sun rays that will take place at the equator and
polar regions respectively. (2x1)(2)
Equator - direct rays✔
Polar Region - oblique rays✔
(1x1)(1)
b. Is temperature likely to be higher at area A or area B?
B✔ (2x2)(4)
c. Provide TWO reasons to support your answer to QUESTION 1.4.2a.
The Equator has a smaller surface area to heat in comparison to a
larger area at the poles.✔✔
The Equator receives direct rays while the poles receive oblique
rays.✔✔
1.4.3 Refer to FIGURE Y.
a. Discuss why the temperature would change from sea level to 3000m
on the mountain. (2x2)(4)
The air in the higher atmosphere is less dense and cannot hold heat as
easily.✔✔
Higher altitudes mean the air is thinner with fewer greenhouse gases
therefore less heat is absorbed, resulting in cooler air.✔✔
b. Describe how the area of the ground has an effect on the temperature (1x2)(2)
change.
The sun heats up the surface of the earth and then heat is radiated back
into the atmosphere✔✔
[15]
1.5. Refer to FIGURE 1.5 on a type of rainfall and answer the following questions.
1.5.1 Identify the type of rainfall depicted by FIGURE 1.5. Convectional (1x1)(1)
Rainfall✔
1.5.2 Where is the rainfall in FIGURE 1.5 most commonly found? (1x1)(1)
Gauteng✔
1.5.3 a. Name the type of cloud labelled A. (1x1)(1)
Cumulonimbus✔
(2x2)(4)
b. Describe TWO weather conditions associated with the type of cloud
mentioned in QUESTION 1.5.3a.
Thunderstorms✔✔
Heavy rain✔✔
Lightning
1.5.4 (2x1)(2)
Discuss how the type of rainfall in FIGURE 1.5 is created.
The surface of the earth is heated by the sun. The warm surface heats the
air above it✔. Because hot air rises this heated air will rise. As it rises it
cools and begins to condensate and create clouds✔.
102
Downloaded from hlayiso.com
1.5.5
Examine the negative impacts of thunderstorms on people and the environment.
People: (3x2)(6)
● Heavy rainfalls can cause flash floods which may lead to the
destruction of infrastructure and houses✔✔
● The impact of thunderstorms on people can be very harmful
e.g., electrocution, shock and even deaths✔✔
● Leads to people getting sick Environment:
● It can hurt/scare animals✔✔
● Thunder can destroy the environment flooding/destruction of
trees and vegetation✔✔
● It can burn vegetation
● Causes fires if the land is dry enough.
[MUST REFER TO PEOPLE AND ENVIRONMENT]
[15]
TOTAL QUESTION 1: 60 MARKS
QUESTION 2: GEOMORPHOLOGY
2.1. Read the following statements and choose the appropriate word or phrase in brackets which
will make the statements TRUE. write down only the question number and the answer. E.g.,
2.1.9 Clouds
2.1.1 Plates✔ (1)
2.1.2 Tectonic plate boundaries✔ (1)
2.1.3 Crust✔ (1)
2.1.4 Focus✔ (1)
2.1.5 Epicentre✔ (1)
2.1.6 Seismic waves✔ (1)
2.1.7 Richter scale✔ (1)
2.1.8 Divergent✔ (1)
[8]
103
Downloaded from hlayiso.com
2.2. Match the letters in FIGURE 2.2 to the statements below. Write only the question number and
the letter. E.g., 2.2.8 G.
2.2.1 D✔ (1)
2.2.2 C✔ (1)
2.2.3 B✔ (1)
2.2.4 E✔ (1)
2.2.5 A✔ (1)
2.2.6 F✔ (1)
2.2.7 E✔ (1)
[7]
104
Downloaded from hlayiso.com
2.3. FIGURE 2.3 showing the structure of the Earth and then answer the questions that follow.
2.3.1 Redraw and fill in the table below. Make sure to include the name and
thickness of each layer from the following:2900km; 90km; 1200km;
2250km.
(8x1)(8)
MUST BE IN A TABLE. IF NOT -1
2.3.2 Layer B is broken up into small segments. What are these segments
called? (1x1)(1)
Plates✔
2.3.3 (1x1)(1)
Explain how layer D results in volcanic activity.
Mantle/magma is a hot plastic consistency that results in convection
currents moving the crust.✔
2.3.4 Describe TWO ways in which the layer labelled B is important to
humans. (2x2)(4)
● The layer we live on✔✔
● It is suitable for buildings✔✔
● It is suitable for agricultural activities
[ANY TWO]
2.3.5 (1x1)(1)
Identity ONE type of metal that makes up layer A. Nickel ✔
Iron
[ANY ONE]
[15]
2.4. FIGURE 2.4 showing folding and faulting and then answer the questions that follow.
2.4.1 Differentiate between a syncline and an anticline. (2x1)(2)
Anticlines are folds in which each half of the fold dips away from the
crest.✔ Synclines are folds in which each half of the fold dips toward the
trough of the fold✔
OR
Anticline has a peak that sticks out as a hill✔ and Syncline has a trough and
forms a valley. ✔
2.4.2 Identify the type of fold that is indicated at the letter A. (1x1)(1)
Overthrust fold✔
105
Downloaded from hlayiso.com
2.4.3 Briefly explain why folding occurs in regions where the sedimentary rock
has been deposited. (2x2)(4)
Sedimentary rock is weaker than igneous rock.✔✔
Sedimentary rock will be more prone to bending and buckling✔✔
2.4.4
In a paragraph of approximately EIGHT lines explain how folds change and
develop from a symmetrical fold to an overturned fold. Make sure to
make mention of the type of plate boundary and type of pressure. (4x2)(8)
● At a convergent plate boundary, the plates move towards one
another.✔✔
● With a symmetrical fold there is Equal pressure from both
sides.✔✔
● With an asymmetrical fold the pressure is greater from one
side (unequal pressure) and the fold leans to one side✔✔
● When it develops to an overturned fold, the pressure is even
greater on one side than the asymmetrical fold and it leans more to
the one side. One limb is very steep✔✔
[15]
2.5. FIGURE 2.5 and the article on the eruption at Mount Pelée and answer the questions that
follow.
2.5.1 Give a geographical term for the phrase 'Old Pelee was dead'. Extinct✔ (1x1)(1)
2.5.2 (1x1)(1)
What is the name given to the big hole through which material is
ejected? Crater✔
2.5.3 State TWO characteristics of Mount Pelee that suggest that it is a composite (2x2)(4)
volcano.
Tall✔✔
Explosive volcano✔✔
2.5.4 Identify ONE negative effect of a volcanic eruption. (1x1)(1)
● People may be buried under ash and cinders.✔✔
● Lava and ash may destroy large areas of farmland and roads,
buildings and infrastructure
● Large, explosive, ash-filled eruptions may cause the world’s
temperature to cool (Krakatoa) and prevent air travel
(Iceland) and have an influence on plant growth
● Toxic gases can cause acid rain and pollution
● Eruptions can melt snow and cause mudslides that bury
settlements, e.g., Mt St Helens
● Areas covered in lava cannot be reused for many years
● Pyroclastic flows kill living creatures [ANY ONE
106
Downloaded from hlayiso.com
2.5.5
Discuss the positive effects of volcanoes on the economy and the environment.
Economy: (3x2)(6)
● Cooled ash and lava weather to form fertile soil which is good
for farming✔✔
● Volcanic rock is good for building and making roads.✔✔
● Hot springs and geysers associated with volcanoes can be
used to generate electricity and tourist attractions
● Many of the world’s tourist popular spots are volcanic islands,
e.g., Hawaii
● Generation of geothermal energy.
Environment:
● Volcanic ash contains nutrients that enrich soil✔✔
● Fertile land
● Land formation - volcanic islands
● Minerals
[MUST REFER TO ECONOMY AND ENVIRONMENT]
[15]
TOTAL QUESTION 2: 60 MARKS
107
Downloaded from hlayiso.com
SECTION B: MAPWORK AND APPLICATION
QUESTION 3
3.1. TOPOGRAPHIC AND ORTHOPHOTO MAP TECHNIQUES
Four options are provided as possible answers to the following questions. Choose the answer
and write only the letter (A-D) next to the question number on your FOLIO PAPER.
3.1.1 The scale of the topographical map as a word scale is… (1)
D✔
3.1.2 Refer to the topographic map. The direction of spot height 1030 in block
E3 from spot height 1048 in block E2 is… (1) D✔
3.1.3 Refer to the orthophoto map.
a. Draw a freehand cross-section from spot height 1006 in block C4 to spot
height 987 in block C5. Ensure you label the Mgeni river. (2+1)(3)
b. Calculate the gradient from spot height 1006 in block C4 to spot height
987 in block C5. Round of to TWO decimal place.
(5x1)(5)
Downloaded from hlayiso.com
H= 1006m-987m = 19m✔ D=4,9cm✔ x 100 (4,8-5cm) =490m✔ (480-500m)
𝐺𝐺 == 49025191,79✔
G=1:25,79✔ (25,26-26,32) :Steep [10]
3.2. TOPOGRAPHIC AND ORTHOPHOTO MAP APPLICATION
Various options are provided as possible answers to the following questions. Choose the
correct answer and write only the letter (A-D) next to the question number.
3.2.1 Refer to block C2. Identify the type of primary economic activity taking place to the (1)
right of the Shelter River.
B✔
3.2.2 Identify the fire protection feature the farmer has installed along his farm in block (1)
B4.
C✔
3.2.3 (1x1)(1)
a. What type of rainfall is experienced by the town of Howick?
Orographic / Relief Rainfall✔ (1+2)(3)
b. Is the rainfall mentioned in QUESTION 3.2.3a seasonal or annual rainfall?
Provide evidence from the map.
Seasonal✔
Many non-perennial dams/lots of dams/lots of reservoirs✔✔
3.2.4 Refer to the orthophoto map.
a. Identify the feature at 9. (1x1)(1)
Waterfall✔
(1x1)(1)
b. How does the feature mentioned in QUESTION 3.2.4a benefit the community (1x1)(1)
of Howick economically?
There is an increase in tourism as people want to visit the falls✔
c. Identify the feature indicated by 8. Spur / Saddle ✔
3.2.5 Refer to block E3 on the topographic map.
a. In which direction does the Mgeni river flow? (1x1)(1)
NE✔
(1x2)(2)
b. Give evidence from the map to support your answer in QUESTION
3.2.5a.
The direction of the smaller rivers flowing into the Mgeni✔✔ The water
must have come from the falls and led into the Mgeni river in block
E3.✔✔
[12]
Downloaded from hlayiso.com
3.3. GIS APPLICATION
Various options are provided as possible answers to the following questions. Choose the
correct answer and write only the letter (A-D) next to the question number.
3.3.1 Identify TWO components of GIS (1)
B✔
3.3.2 Refer to the Orthophoto map and answer the questions that follow.
a. Define the term remote sensing. (1x1)(1)
Remote sensing is obtaining information about the earth from a
distance✔
b. Identify ONE way in which images can be remotely sensed.
(1x1)(1)
Satellite/weather balloon/aeroplane/helicopters/drones✔
3.3.3 Refer to the topographic map.
a. Differentiate between spatial and attribute data. (2x1)(2)
Spatial: refers to the position of an object✔
Attribute: information that gives the characteristics of an
object.✔
b. The location of the Howick Falls at F in block E2 on the topographic (1x1)(1)
map is an example of (attribute/spatial) data.
Spatial✔
3.3.4 Refer to block A2 on the orthophoto map.
a. Define raster data. (1x1)(1)
Spatial data stored in the form of pixels✔
b. Identify one point feature in this block. Place of
(1x1)(1)
worship / Church✔
[8]
TOTAL OF PAPER 1 = 150 MARKS
Downloaded from hlayiso.com
P1 FINAL EXAMINATIONS
COGNITIVE GRID
Downloaded from hlayiso.com
GRADE 10 EXEMPLAR
SBA ITEM 6
FINAL EXAMINATIONS
PAPER 2
Downloaded from hlayiso.com
GAUTENG DEPARTMENT OF EDUCATION
EXEMPLAR
GEOGRAPHY
Final Paper
GRADE 10
PAPER 2
Downloaded from hlayiso.com
INSTRUCTIONS AND INFORMATION
1. This question paper consists of THREE questions:
● QUESTION 1: Population (60)
● QUESTION 2: Water Resources (60)
● QUESTION 3: Mapwork (30)
2. Answer ALL THREE questions.
3. All diagrams are included in this paper.
4. Illustrate your answers with labelled diagrams, where possible.
5. Start EACH question at the top of a NEW page.
6. Number the answers correctly according to the numbering system used in this question
paper. Number the answers on the margin of the line.
7. Draw the margin on the right-hand side of ALL pages in the folio booklet and DO NOT
write in the margins.
8. Write neatly and legibly.
9. You may use a non-programmable calculator and a magnifying glass.
10. The unit of measurement must be given in the final answer, where applicable, e.g., 10km,
4ºC, East
11. Answer in FULL SENTENCES, except when you have to state, name, identify or list.
12. DO NOT MAKE ANY MARKINGS ON THIS MAP!
SECTION B: MAPWORK AND APPLICATION:
RESOURCE MATERIAL
1. An extract from topographic map 2931AB TUGELA
2. Orthophoto map 2931AB 19 TUGELA
INSTRUCTIONS, INFORMATION AND RESOURCE MATERIAL
1. You are provided with an extract from the 1:50 000 topographical map
2931AB TUGELA and the orthophoto map 2931AB 19 TUGELA of
a part of the mapped area.
Downloaded from hlayiso.com
2. You must hand in the topographical map and orthophoto map to the invigilator at the
end of the examination session.
3. Show all calculations and use the supplied formulae, where applicable.
Marks will be allocated for these.
4. NO marks will be awarded for answers to the incorrect units.
5. The area demarcated in RED on the topographical map represents the area
covered by the orthophoto map.
6. You may use a magnifying glass.
7. The following English terms and their Afrikaans translations are shown
on the topographical map:
ENGLISH AFRIKAANS
Furrow Voor
Golf course Gholfbaan
River Rivier
Sewage works Rioolwerke
Weir Stuwal
Downloaded from hlayiso.com
SECTION A: POPULATION AND WATER RESOURCES QUESTION 1: POPULATION
1.1. Choose the answer that best fits the statement. Write the correct letter next to the number
on your answer sheet.
1.1.1 The graphical representation of the percentage of males and females in different age (1)
groups.
A. population pyramid
B. population bar graph
C. population line graph
D. population pie graph
(1)
1.1.2 Choose the correct statement to fit with the following sentence. Life choices that
can help to increase life expectancy. A. Healthy meals and alcohol abuse.
B. Fast food and good medical care.
C. Good medical care and exercise.
D. Smoking and regular exercise.
1.1.3 High birth rate and high death rate result in … population growth. (1)
A. high
B. zero
C. rising
D. low.
1.1.4 The … of a country refers to the total number of babies that are born per 1000
of the population per year. (1)
A. population growth
B. birth rate
C. fertility rate
D. demography
(1)
1.1.5 Life expectancy is…
A. the age of your grandparents.
B. what you can expect of your life.
C. how long you will live.
D. the average number of years that the average person in a population can expect
to reach.
1.1.6 A "baby boom" is… (1)
A. an increase in the number of babies who go to preschool.
B. an increase in the number of births.
C. a decrease in the number of babies born.
D. an increase in the number of babies who die before they reach one year.
Downloaded from hlayiso.com
(1)
1.1.7 When skilled and highly educated people leave a country to work in another it is called
…
A.brain drain.
Talent recycling.
Skills migration.
D. Brain loss.
1.1.8 Unregistered and informal entry into a country. (1)
A. Refugee immigration
B. Asylum seeking
C. Illegal immigration
D. Alien migration
[8]
1.2. Refer to the two pyramids below that explains the population of a country and
choose between pyramids A and B from COLUMN B that gives the correct
description for the statement in column A. Write only Pyramid
FIGURE 1.1
COLUMN A COLUMN B
1.2.1
The pyramid indicating a country with the highest birth and death rates Pyramid A
is … Pyramid B
(1)
1.2.2
The pyramid indicating a country with the slowest population growth is Pyramid A
… Pyramid B
(1)
1.2.3
Pyramid A
The pyramid indicating a country with the lowest life expectancy is …
Pyramid B
(1)
Downloaded from hlayiso.com
1.2.4 The pyramid indicating a country with a large number of adults is Pyramid A
… Pyramid B
(1)
1.2.5 The pyramid indicating a developing country is … Pyramid A
Pyramid B
(1)
1.2.6
The pyramid indicating a country with the best developed medical Pyramid A
infrastructure is … Pyramid B
(1)
1.2.7
Pyramid A
The pyramid that represents a country with a healthy workforce is …
Pyramid B
(1)
[7]
1.3. Refer to FIGURE 1.3 (Table showing 2018 Population Statistics for
Australia and Monaco) and answer the following questions.
Country Population (people) Area (km²)
Australia 24 898 152 7 692 024
Monaco 38 682 2
1.3.1 Which country has the larger population (1x1)(1))
1.3.2 Which country has the smaller area? (1x1)(1)
1.3.3 Define population density. (1x2)(2)
1.3.4 Calculate the population density for Australia. Round off to the nearest
WHOLE number. Show ALL working out. (2x2)(4)
1.3.5 Calculate the population density for Monaco. Round off to the nearest
WHOLE number. Show ALL working out. (2x2)(4)
1.3.6
Look at the answers from your previous calculations.
a. Which country (Australia or Monaco) has a higher population
density? (1x1)(1)
b. Explain why this is the case. (1x2)(2)
Downloaded from hlayiso.com
[15]
1.4. Refer to FIGURE 1.4A (China’s One-Child Policy) and FIGURE 1.4B
(Future Population Pyramid for China) and answer the following questions.
1.4.1 What does it mean that China was “the world's most populous country”? (1x1)(1)
1.4.2 (2x1)(2)
According to the article, list TWO reasons why the Chinese authorities put the
one-child policy in place.
1.4.3 How many children are Chinese parents allowed to have in 2021? (1x1)(1)
1.4.4
a. Define the term birth rate. (1x1)(1)
b. What “future population crisis” will China face because of this declining
birth rate? (1x2)(2)
1.4.5 What year does the Chinese population pyramid show? (1x1)(1)
1.4.6 Describe the birth rate of China and use evidence from the population
pyramid to support your answer. (2x1)(2)
1.4.7 (3x1)(3)
Look at China’s population pyramid and use the words high OR low to
describe the following population indicators: a. Life expectancy
b. Death rate
c. The number of elderly dependants
1.4.8 According to this population pyramid, China is predicted to have an ageing (1x2)(2)
population. Name ONE problem that a country with an ageing population can
experience.
[15]
Downloaded from hlayiso.com
1.5. Refer to FIGURE 1.5 on a Brain drain and answer the following questions.
FIGURE 1.5
Brain drain loading: SA’s ’emigration exodus’ is causing a major problem
Wherefore art thou, skilled workers? South Africa is losing its brightest sparks to mass
emigration while struggling to find replacements.
by Head 22-10-2021
South Africa is losing skilled workers faster than it can hire replacements from abroad,
sparking a wave of concern amongst some of the biggest companies in the country. That’s
according to Marisa Jacobs of Xpatweb, who claimed this week that an ’emigration exodus’
of highly-trained workers is creating a brain drain on our shores.
EMIGRATION EXODUS LEAVES TOP JOBS EMPTY
Jacobs has identified that many South Africans are choosing to pursue international
opportunities, in order to earn more money and potentially create opportunities for their
families back home. However, as our best and brightest flock overseas, the same enthusiasm for
skilled workers to ply* their trade in SA is missing:
“It cannot be ignored that a contributor to the ever-increasing skills shortages in South Africa, is
the exodus of skilled and experienced professionals moving abroad. Their motivation is to pursue
international exposure, take advantage of earning a foreign currency, gain global experience,
and create opportunities for their families.”
“The big concern is indeed the sad loss of South African professionals who have chosen to
emigrate. However, it has also raised another glaring concern. There are companies in dire need
of filling key positions to conduct their business.”
“Failure to find suitable South African candidates for these roles has resulted in Human Resource
professionals casting their lines further afield with the hopes of snagging professionals abroad.”
| Marisa Jacobs
*ply - use
[Adapted from
https://www.thesouthafrican.com/news/south-africa/emigration-south-africa-lacking-skilled -
workers-how-to-apply/ ]
1.5.1 Explain the term brain drain. (1x1)(1)
1.5.2 Differentiate between pull factors and push factors. (2x1)(2)
1.5.3 (2x1)(2)
Name TWO reasons why South Africans are emigrating, according to Jacobs.
1.5.4 Explain why South African companies are concerned. (1x2)(2)
Downloaded from hlayiso.com
1.5.5 Write a paragraph of approximately EIGHT lines discussing both the positive and (4x2)(8)
negative effects of emigration.
[15]
TOTAL QUESTION 1: 60 MARKS
QUESTION 2: WATER RESOURCES
2.1. Describe the hydrological cycle by choosing the correct word(s) in brackets in the following
paragraph. Write the number (2.1.1-2.1.8) and the correct word next to it.
Most water evaporates from 2.1.1 (oceans/rivers) to form moist air. When water leaves trees
and plants as water vapour 2.1.2 (evapotranspiration/evaporation) takes place. The water
vapour rises and cools this process is called 2.1.3 (evaporation/condensation), when the
water vapour turns back into water droplets 2.1.4 (condensation/evapotranspiration) occurs
and 2.1.5 (rain/clouds) form. Off). 2.1.6 (Precipitation / Percolation) takes place and the
water lands on the earth’s surface. Water drains into rivers, and this is called 2.1.7 (surface
run-off/base (8x1) (8) flow). As the water infiltrates, the water table will 2.1.8 (rise /
subside).
[8]
2.2. Match the letters in FIGURE 2.2 to the statements below. Write only the question number and
the correct letter
FIGURE 2.2
2.2.1 Indicates the time on the graph (1x1)(1)
2.2.2 Highest amount of discharge after a rainfall event. (1x1) (1)
2.2.3 Where water is rising after a rainfall event. (1x1) (1)
Downloaded from hlayiso.com
2.2.4 Highest amount of rainfall. (1)
2.2.5 Shows the run-off discharge in cumecs. (1)
2.2.6 Indicates the normal flow of the river. (1)
2.2.7 The time indicated between the highest rainfall and the peak discharge. (1)
[7]
2.3. Refer to FIGURE 2.3 showing interbasin transfer and then answer the questions that follow.
FIGURE2.3
LHWP
Lesotho is an LEDC in southern Africa with an abundance of water. It is completely surrounded by
South Africa, which is a much richer country and also short of water. This circumstance has led to
the ambitious Lesotho Highlands Water Project - one of Africa's largest engineering schemes.
The project involves damming some of Lesotho's major rivers - most of which flow south into the
Senqu (known to South Africans as the Orange River). This damming process has created large
artificial lakes. The water from the lakes is then diverted north (through tunnels under the
mountains) to South African rivers. These rivers lead to the Vaal Dam, which supplies the densely
populated urban and industrial regions around Johannesburg and Pretoria.
South Africa pays Lesotho royalties of around US$1.5 million a month for this water supply. The
project was first thought of in the 1950s, but the treaty formalising the project was not signed until
1986.
The project's objectives
1. To provide funds for Lesotho by transferring water from the catchment of the
Senqu/Orange River in Lesotho to meet the growing demand for water in South Africa's
major industrial and population centres.
2. To generate hydroelectric power for Lesotho.
3. To promote the general development of the remote and underdeveloped mountain
regions of Lesotho.
4. To provide water for irrigation and drinking water supply.
2.3.1 Explain what is meant by water transfer. (1x1)(1)
2.3.2 (2x2)(4)
Discuss the benefits for Lesotho and South Africa with the Lesotho Highlands
Water Project
2.3.3 Give TWO activities that water is used for once it reaches South Africa. (2x1)(2)
2.3.4 (1x2)(2)
Water is transported through tunnels to the rivers in South Africa. Explain why
the tunnels are used and no other river channels to move the water.
Downloaded from hlayiso.com
2.3.5 Discuss THREE government initiatives that can be used to secure South (3x2)(6)
Africa's scarce water supply in the future.
[15]
2.4. Refer to FIGURE 2.4 showing Sustainable water use and then answer the questions that
follow.
FIGURE 2.4
Water Sustainability – Securing a sustainable future
Water is a finite resource, meaning that it cannot be readily replaced by natural means at a pace quick enough
to keep up with consumption. Water conservation is an issue that hits close to home for South Africans as
our climate is classified as semi-arid, and with an average rainfall of 464mm per year, it ranks South Africa as
one of the top 30 driest countries in the world. Due to the sensitivity of our climate, we have also been one
of the first countries to experience the effects of climate change on our weather, causing the recent and
ongoing droughts and floods in South Africa. These events are not isolated and affect vast areas of the country
— areas that are also responsible for producing a large portion of food in South Africa. With an increase in
extreme weather events, the conservation of water as one of the building blocks of life is essential.
Current water levels in South African agriculture
According to the National Business Initiative (NBI), the agricultural industry uses roughly 60% of the available
water in South Africa. Therefore, it is no surprise that it is one of the first to feel the effects of the lack and
mismanagement of water. The incorrect management of water and wastewater can lead to a whole host of
environmental and social issues, including water shortages, soil erosion, aquifer salinisation, and pollution,
all of which affect the ability of farmers to produce crops sustainably and cost-effectively.
To effectively reduce the pressure placed on our water resources, we need to mitigate and reduce the risks
associated with improper water management whilst encouraging the continuous improvement of
management practices. The mismanagement of water and wastewater by one person has the potential to
affect whole communities downstream; therefore, every person needs to do their part in ensuring South
Africa’s water future. Every drop counts when it comes to sustainable water management, including safe and
appropriate treatment and disposal of wastewater generated.
Adapted:[https://siza.co.za/water-sustainability-securing-a-sustainable-future/]
2.4.1 Define sustainable water use.
(1x2)(2)
2.4.2 Quote why the article states “ Water conservation is an issue that hits
close to home for South Africans” (1x2)(2)
2.4.3 Identify ONE natural and ONE man-made reason as to why South
Africans need to conserve water stated in the article. (2x1)(2)
2.4.4 Explain ONE negative impact of unsustainable water use. (1x2)(2)
2.4.5 Discuss ways in which South Africans can contribute to sustainable
water use in their homes and workplaces. (3x2)(6)
Downloaded from hlayiso.com
2.4.6 Describe the impact on the cos of food if farmers cannot produce crops (1x1)(1)
sustainably.
[15]
2.5. Refer to FIGURE 2.5 and the article on Flooding and answer the questions that follow.
FIGURE 2.5
2.5.1 Define the term flooding. (1x2)(2)
2.5.2 In which province did this flood occur? (1x1)(1)
2.5.3 Refer to the infographic and state effects of the flooding that occurred in (3x1)(3)
KwaZulu-Natal for: a. Social effect
b. Economic effect
c. Environmental effect
2.5.4 According to the infographic, identify ONE thing people who can’t swim
can do to keep safe in a flood. (1x1)(1)
2.5.5 There are different ways to reduce flooding. In a paragraph of approximately EIGHT
lines, outline the different management schemes that the government can put in
place in order to manage floods in future. (4X2)(8)
TOTAL QUESTION 2: 60 MARKS
Downloaded from hlayiso.com
SECTION B: MAPWORK AND APPLICATION
QUESTION 3: GEOGRAPHICAL SKILLS AND TECHNIQUES
Study the background information on Tugela below and answer the questions that follow.
GENERAL INFORMATION ON TUGELA
INFORMATION: TUGELA
The uThukela River originates as a stream on the 3 050 m high Mont-aux-Sources plateau near
the merger point of the Lesotho-Free State provincial borders. Its upper course, which lies within
Royal Natal National Park, flows through the Drakensberg range before coming down fast through
a series of waterfalls having a total drop of 948 m. The river cuts through the Tugela Gorge at the
foot of the escarpment (about 1,500 m above sea level) and is quickly joined by many tributaries.
The uThukela River ends its course of 502 km at the Indian Ocean, about 84 km north of Durban.
The mouth is almost completely blocked in times of normal flow by a sandbar. Its narrow valley
and alluvial deposits restrict irrigation.
The climate in this area is mild and generally warm and temperate. The summers have a good
deal of rainfall, while the winters have very little. The average annual temperature is 19,4°C at the
Tugela Mouth resort and the average annual rainfall is 679 mm.
Downloaded from hlayiso.com
3.1. MAP SKILLS AND CALCULATIONS
Various options are provided as possible answers to the following questions. Choose the answer
and write only the letter (A-D) next to the question number (3.1.1) on your FOLIO PAPER.
3.1.1 The map reference for the map to the southwest of 2931AB is …
A. 2831BC
B. 2931AC
C. 2931BA (1x1)(1)
D. 2831DC
3.1.2 (1x1)(1)
Distance = measurement in cm x map scale. The distance from spot height
83 in block A4 to 6 in block C5 on the orthophoto map in kilometres.
A. 6,7 cm x 0,5
B. 6,9cm x 100
C. 6,9cm x 500
D. 6,7cm x 0.1
3.1.3
Refer to your answer in QUESTION 3.1.2 and calculate the distance in
kilometres from the spot height 83 in block A4 to 6 in block C5 on the
orthophoto map. (1x1)(1)
3.1.4 Use the following formula and steps to determine the magnetic bearing
from trigonometrical beacon 97 in block E2 to trigonometrical beacon 113
in block E1 for 2022 on the topographical map. Formula: magnetic
declination + true bearing
a. Difference in years
b. Mean annual change
c. Total annual change
d. Magnetic declination
e. True bearing
f. Magnetic bearing (7x1)(7)
[10]
Downloaded from hlayiso.com
3.2. MAP INTERPRETATION
3.2.1 Refer to blocks B1 and B2 on the topographic map.
(1x2)(2)
a. Explain the reason for the farm placement in blocks B1 and B2.
b. Discuss ONE negative effect the uThukela River will have on the (1x2)(2)
farm placement in blocks B1 and B2.
3.2.2 People are often influenced to stay in particular places based on various factors.
Look at the settlements in block A1 on the topographic map and answer the
following questions:
a. When people live close to each other it is (densely/sparsely)
populated. (1x1)(1)
b. Identify a factor from the map to explain your answer in QUESTION
3.2.2 a. (1x2)(2)
3.2.3 Refer to the orthophoto map:
a. Identify the human-made feature in block C3. (1x1)(1)
b. What economic activity takes place at the feature you identified in
QUESTION 3.2.3 a? (1x1)(1)
3.2.4
Four options are provided as possible answers to the following questions.
Choose the answer and write only the letter (A-D) next to the question number
(3.2.4) on your FOLIO PAPER.
Refer to the slope in block D1 on the topographic map. Is the slope steep or
gentle?
A. Steep
B. Gentle (1x1)(1)
3.2.5 Refer to your answer in QUESTION 3.2.4 and motivate your answer
with evidence from the map. (1x2)(2)
[12]
Downloaded from hlayiso.com
3.1. GIS APPLICATION
Various options are provided as possible answers to the following questions. Choose the
correct answer and write only the letter (A-D) next to the question number.
3.3.1 Refer to block E5 on the topographic map.
a. Define the term data layering. (1x1)(1)
b. Identify ONE data layer found in block E6 and select the correct option
below.
A. Drainage: Row of trees
B. Relief: Hiking trail
C. Economic Activity: Orchard
(1x1)(1)
D. Geographic data: Information
(1x2)(2)
c. How can the government use data layering to keep people safe in block
E5?
3.3.2 Refer to the orthophoto map.
a. Define spatial resolution. (1x1)(1)
b. Is the orthophoto map a high or low resolution? (1x1)(1)
3.3.3 Refer to the block C5 on the topographic map.
a. Define vector data. (1x1)(1)
b. Identify ONE point feature in block C5. (1x1)(1)
[8]
TOTAL QUESTION 3: 30 MARKS
TOTAL PAPER 2: 150 MARKS
Downloaded from hlayiso.com
GAUTENG DEPARTMENT OF EDUCATION
EXEMPLAR
GEOGRAPHY
FINAL EXAM PAPER 2
GRADE 10
MARKING GUIDELINES
Downloaded from hlayiso.com
SECTION A: POPULATION AND WATER RESOURCES QUESTION 1: POPULATION
1.1.1 A✔ (1)
1.1.2 C✔ (1)
1.1.3 D✔ (1)
1.1.4 B✔ (1)
1.1.5 D✔ (1)
1.1.6 B✔ (1)
1.1.7 A✔ (1)
1.2.8 C✔ (1)
[8]
1.2.1 Pyramid B✔ (1)
1.2.2 Pyramid A✔ (1)
1.2.3 Pyramid B✔ (1)
1.2.4 Pyramid A✔ (1)
1.2.5 Pyramid B✔ (1)
1.2.6 Pyramid A✔ (1)
1.2.7 Pyramid A✔ (1)
[8]
1.3.1 Which country has the larger population?
Australia✔
1.3.2 Which country has the smaller area? (1x1)(1)
Monaco✔
1.3.3 (1x2)(2)
Define population density.
The number of people per square kilometre. ✓✓
1.3.4 Calculate the population density for Australia. Round off to the nearest
WHOLE number. Show ALL working out. (2x2)(4)
Population density = population/area
= 24 898 152/7 692 024 ✓✓
= 3,236…
= 3 people per km² ✓✓ (NO UNIT=NO MARK)
Downloaded from hlayiso.com
1.3.5 Calculate the population density for Monaco. Round off to the nearest
WHOLE number. Show ALL working out. (2x2)(4)
Population density = population/area
= 38 682/2 ✓✓
= 19 341 people per km² ✓✓ (NO UNIT=NO MARK)
1.3.6
Look at the answers from your previous calculations.
a. Which country (Australia or Monaco) has a higher population density?
Monaco✔
b. Explain why this is the case. (1x1)(1)
Monaco has a smaller population but also has a much smaller area, which
means that there are a lot of people who occupy a much smaller space. ✓✓
(CONCEPT)
(1x2)(2)
[15]
1.4.1 What does it mean that China was “the world's most populous country”?
It has the most people/highest population ✓
1.4.2 According to the article, list TWO reasons why the Chinese authorities put the one-child (2x1)(2)
policy in place.
To counter overpopulation ✓ and to raise the standard of living ✓
1.4.3 (1x1)(1)
How many children are Chinese parents allowed to have in 2021? 3
children ✓
1.4.4 (1x1)(1)
a. Define the term birth rate.
The number of babies born per 1000 of the population per year.✓ (1x2)(2)
b. What “future population crisis” will China face because of this declining birth
rate?
Not enough economically active people to support the economy and
dependants ✓✓ (CONCEPT)
1.4.5 (1x1)(1)
What year does the Chinese population pyramid show? 2050 ✓
1.4.6 Describe the birth rate of China and use evidence from the population
pyramid to support your answer. (2x1)(2)
Low birth rate ✓ can be seen by the narrow base ✓
1.4.7 (3x1)(3)
Look at China’s population pyramid and use the words high OR low to
describe the following population indicators: a. Life expectancy
High✓
b. Death rate
Low✓
c. The number of elderly dependants
High✓
Downloaded from hlayiso.com
1.4.8 (1x2)(2)
According to this population pyramid, China is predicted to have an ageing population.
Name ONE problem that a country with an ageing population can experience.
● fewer workers to support the financial demands of an ageing
population. ✓✓
● greater pressure on health and social care services
● increased expense from pension claims, that can lead to tax
increases to meet the demand.
● a higher dependency ratio [ANY ONE]
[15]
1.5.1 Explain the term brain drain.
Brain drain - when highly skilled and educated people leave the country
✓
1.5.2 Differentiate between pull factors and push factors. (2x1)(2)
Pull factors are favourable/positive conditions that attract people to an area ✓
Whereas push factors are unfavourable/negative conditions that discourage
people from remaining in an area ✓
1.5.3 (2x1)(2)
Name TWO reasons why South Africans are emigrating, according to Jacobs.
● Earn more money ✓
● Create more opportunities for family back home ✓
● Earn foreign currency
● Gain global experience
[ANY TWO]
1.5.5 (4x2)(8)
Write a paragraph of approximately EIGHT lines discussing both the positive and
negative effects of emigration.
Positives:
● People who enter the country have specialized skills and the new
country benefits from the added skills of the immigrants. ✓✓
● People who leave rural areas send money to people remaining
behind. The economic prosperity is thereby increased and distributed. ✓✓
● The new country receives cultural influences that enhance the
country Negatives:
● Brain drain ✓✓
● Boost active workforce in another country ✓✓
● Reduced or increased unemployment
● Strain social services (housing shortages & poor sanitation)
● Exploitation
● Less money to support local businesses
● Increases multicultural places
[MUST HAVE TWO POSITIVES AND TWO NEGAITVES]
[15]
TOTAL QUESTION 1: 60 MARKS
Downloaded from hlayiso.com
QUESTION 2: WATER RESOURCES
2.1.1 Oceans ✓ (1)
2.1.2 Evapotranspiration✓ (1)
2.1.3 Evaporation✓ (1)
2.1.4 Condensation✓ (1)
2.1.5 Clouds✓ (1)
2.1.6 Precipitation✓ (1)
2.1.7 Surface Runoff✓ (1)
2.1.8 Rise✓ (1)
[8]
2.2.1 G✓ (1)
2.2.2 D✓ (1)
2.2.3 B✓ (1)
2.2.4 A✓ (1)
2.2.5 H✓ (1)
2.2.6 F✓ (1)
2.2.7 C✓ (1)
[7]
2.3.1 Explain what is meant by water transfer. (1x1)(1)
Water transfer is moving water from one area to another.✔
2.3.2 (2x2)(4)
Discuss the benefits for Lesotho and South Africa with the Lesotho Highlands Water
Project
● To provide funds for Lesotho by transferring water from Lesotho to South
Africa's✔✔
● To generate hydroelectric power for Lesotho.✔✔
● To promote the general development of the remote and underdeveloped
mountain regions of Lesotho. ✔✔
● To provide water for irrigation and drinking water supply for South
Africa.✔✔
[ANY TWO, MUST REFER TO SA AND LESOTHO]
133
Downloaded from hlayiso.com
2.3.3 Give TWO activities that water is used for once it reaches South Africa. (2x1)(2)
● Industrial Use - In factories, etc.✔
● Drinking water✔
● Household Use.✔
● Irrigation✔
[ANY TWO]
2.3.4 (1x2)(2)
Water is transported through tunnels to the rivers in South Africa. Explain why the
tunnels are used and no other river channels to move the water. The water would
be more easily evaporated if transported through normal river channels.✔✔
OR
Tunnels prevent the evaporation and allow for more water to reach South
Africa’s rivers.✔✔
2.3.5 Discuss THREE government initiatives that can be used to secure South (3x2)(6)
Africa's scarce water supply in the future.
● Introduce new policies to manage water.✔✔
● Plan and develop new dams.✔✔
● Manage interbasin transfer schemes better.✔✔
● Recycle water – purification or sewage treatment plants provide safe,
quality water.✔✔
● Fix leaking taps and pipes✔✔
● Monitor pollution and introduce fines✔✔
● Restore wetland✔✔
● Introduce water restrictions✔✔
[ANY THREE]
[15]
2.4.1 Define sustainable water use. (1x2)(2)
Sustainable water use is using water resources in a way and at a rate that
prevents the long-term loss of water.✔✔
2.4.2 Discuss why the article states “ Water conservation is an issue that hits
close to home for South Africans” (1x2)(2)
South Africa is a semi-arid climate with an average rainfall of 464mm per year,
minimal rainfall means minimal water production.✔✔
2.4.3 Identify ONE natural and ONE man-made reason as to why South Africans
need to conserve water stated in the article. (2x1)(2)
Natural: Climate Change✔
Man-made: Mismanagement of water✔
2.4.4 (1x2)(2)
Explain ONE negative impact of unsustainable water use.
● Lose available fresh water✔✔
● Lack of water for irrigation
● Soils dry out
● Soil erosion
● Lack of drinking water
[ANY ONE]
2.4.5 Discuss ways in which South Africans can contribute to sustainable water
134
Downloaded from hlayiso.com
use in their homes and workplaces. (3x2)(6)
● Recycle water – purification or sewage treatment plants provide safe,
quality water.✔✔
● Do not waste water – reduce use of water.✔✔
● Do not pollute – affects water supplies.✔✔
● Remove alien vegetation – high water consumption ● Water plants
early in the morning or at night.
● Take showers instead of baths.
● Fix leaking taps and pipes
● Use grey water for gardening
● Use water saving appliances and showerheads. ● Use energy
efficient washing machines ● Turn off taps when not in use. [ANY FOUR]
2.4.6 Describe the impact on the cost of food if farmers cannot produce crops
sustainably. (1x1)(10
Food prices will increase to accommodate the production costs.✔
[15]
2.5.1 Define the term flooding. (1x1)(1)
The covering of usually dry land with water overflowing from an abnormally
full body of water, such as a river.✔
OR
A flood occurs when a river has more water in it than the river's channel can
hold. The water then flows over the banks of the river, onto the adjacent land
areas.✔
2.5.2 (1x1)(1)
In which province did this flood occur?
KwaZulu-Natal✔
2.5.3 (2x2)(4)
Refer to the infographic and state ONE of the effects of the flooding that
occurred in KwaZulu-Natal for: a. Social effect
Missing People ✔
People Died
People left homeless [ANY ONE]
Knocked out power and water
b. Economic effect
Houses destroyed✔
Damaged infrastructure [ANY ONE]
Port disruptions
c. Environmental effect
Mudslides✔
2.5.4 According to the infographic, identify ONE thing people who can’t swim
135
Downloaded from hlayiso.com
can do to keep safe in a flood. (1x1)(1)
● Face upstream if you are forced to stand in fast flowing
water.✔
● Make yourself as light as possible, remove heavy boots or
clothing.
● Try get into a back float on your back with your feet in front of
you and your head up facing down river and above water.
● Stay away from rocks and vegetation.
2.5.5
There are different ways to reduce flooding. In a paragraph of approximately
EIGHT lines, outline the different management schemes that the government can
put in place in order to manage floods in future.
● Build dams and reservoirs✔✔ (4x2)(8)
● Building ‘upstairs shelters’ as refuges in floods✔✔
● Flood warning system✔✔
● Temporary measure e.g., sandbags✔✔
● Build levees high banks at the side of rivers)
● Land use zoning so that less damage is done e.g.,
open spaces next to the river
● Plant trees
● Dredge and straighten rivers
● Provide National Insurance
● Evacuate people from flood prone areas
● Widen rivers [ANY FOUR]
[15]
TOTAL QUESTION 2: 60 MARKS
SECTION B: MAPWORK AND APPLICATION
3.1.1 The map reference for the map to the southwest of 2931AB is … (1x1)(1)
B✔
3.1.2 (1x1)(1)
Distance = measurement in cm x map scale. The distance from spot height 83 in
block A4 to 6 in block C5 on the orthophoto map.
D. 6,7cm x 0.1✔
3.1.3
Refer to your answer in QUESTION 3.1.2 and calculate the distance in kilometres from
the spot height 83 in block A4 to 6 in block C5 on the
orthophoto map. (1x1)(1)
6,7 cm X 0,1 = 0,67km✔
136
Downloaded from hlayiso.com
3.1.4
Use the following formula and steps to determine the magnetic bearing from
trigonometrical beacon 97 in block E2 to trigonometrical beacon 113 in block E1 for
2022 on the topographical map. a. 2022 - 2016 = 6 years ✔
b. 9’ Westwards✔
c. 6 years X 9’W = 45’W✔
d. 24० 26’ W
+ ✔ 54’ W
MD= 25० 20’ W of TN✔
e. 328०✔ (Leeway 327० / 329०)
f. MB= MD + TB
= 25० 20’ W + 328० (7x1)(7)
= 353०20’ W✔ LEEWAY: 352०20’W OR 354०20’W
[10]
3.2.1 Refer to blocks B1 and B2 on the topographic map.
(1x2)(2)
a. Explain the reason for the farm placement in blocks B1 and B2.
Access to water and nutrients from the uThukela River.✔✔ (1x2)(2)
b. Discuss ONE negative effect the uThukela River will have on the farm placement
in blocks B1 and B2.
The river can flood its banks and flooding could destroy crops. ✔✔
3.2.2
People are often influenced to stay in particular places based on various factors. Look
at the settlements in block A1 on the topographic map and answer the following
questions:
a. When people live close to each other it is (densely/sparsely) populated.
Densely ✔ (1x1)(1)
b. Identify a factor from the map to explain your answer in QUESTION
3.2.2a.
The proximity to the uThukela River - Access to water for the
population.✔✔ (1x2)(2)
3.2.3 Refer to the orthophoto map:
a. Identify the human-made feature in block C3. (1x1)(1)
Quarry / Excavation ✔
b. What economic activity takes place at the feature you identified in (1x1)(1)
QUESTION 3.2.3 a? Mining ✔
137
Downloaded from hlayiso.com
3.2.4
Four options are provided as possible answers to the following questions. Choose the
answer and write only the letter (A-D) next to the question number (3.2.4) on your
FOLIO PAPER.
(1x1)(1)
Refer to the slope in block D1 on the topographic map. Is the slope steep or gentle?
A. Steep✔
3.2.5 Refer to your answer in QUESTION 3.2.4 and motivate your answer with
evidence from the map. (1x2)(2)
The contour lines are close together✔✔
[12]
3.3.1 Refer to block E5 on the topographic map.
a. Define the term data layering. (1x1)(1)
When different kinds of Information are placed on top of the other to
see the overall picture.✔
b. Identify ONE data layer found in block E6 and select the correct option
below.
C✔ (1)
c. How can the government use data layering to keep people safe in (1x1)(1)
block E5?
The government can use data layering to identify where the river can
flood and stop people from building on the flood plain.✔
3.3.2 Refer to the orthophoto map.
a. Define spatial resolution. (1x1)(1)
How clear and easy the detail on an image is to see.✔
b. Is the orthophoto map a high or low resolution? High (1x1)(1)
Resolution✔
3.3.3 Refer to the block C5 on the topographic map.
a. Define vector data (1x1)(1)
Spatial data stored in the form of coordinates shown as points, lines and
polygons.✔
b. Identify ONE point feature in block C5. (1x1)(1)
Spot height 166 / communication tower / Trig. beacon 146✔
[8]
TOTAL 30
TOTAL MARKS PAPER 2: 150 MARKS
138
Downloaded from hlayiso.com
P2 FINAL EXAM
COGNITIVE GRID
139
Study this subject
Recommended for this subject
Question paper
Geography Grade 10 P1 2020 QP (Eng)
Question paper
Geography Grade 10 P1 Eastern Cape November 2018 QP (Eng)
Question paper
Geography Grade 10 P2 National November 2018 QP (Eng)
Question paper
Geography Grade 10 P1 Eastern Cape November 2017 QP (Eng)
Question paper
Geography Grade 10 P1 National November 2017 QP (Eng)
Question paper
Geography Grade 10 P2 National November 2017 QP (Eng)
More from Grade 10 Geography
Study guide
Gr10 Geografie OG studyguide LR
Annual teaching plan
Gr 10 Geo ATP 2023 24
Question paper and memo
Geography Grade 10 Free State March Test 2025 Paper & Memo
Question paper and memo
Geography Grade 10 Paper 1 Limpopo June 2025 Paper & Memo
Question paper and memo
Geography Grade 10 Eastern Cape June 2024 Paper & Memo
Addendum