
Downloaded from hlayiso.com
GAUTENG DEPARTMENT OF EDUCATION
PREPARATORY EXAMINATION
2021
MARKING GUIDELINES
GEOGRAPHY (PAPER 1) (10781)
13 pages
Skip to contentAll 2021 papers 
View all


Geography Grade 12 Paper 1 Gauteng Mock 2021 Memo (English)
Grade 12 Geography Paper 1 memorandum from the Gauteng Mock Exam 2021 (English), 13 pages. Read online or download the free PDF.
Geography · Grade 12 · Gauteng Mock Exam · 2021 · English. Memorandum, 13 pages. Read online or download the PDF.
- Subject
- Geography
- Grade
- Grade 12
- Language
- English
- Document type
- Memorandum
- Year
- 2021
- Exam period
- Gauteng Mock Exam
- Paper
- 1
- Curriculum
- CAPS
- Pages
- 13
- File size
- 460.6 KB
Free to read online, no sign-up needed
Loading document…
Loading document…
1 of 13
This exam
Gauteng Mock Exam 2021
Questions in this paper
Document textSearch extracted text and jump to a page.
Downloaded from hlayiso.com
10781/21
INFORMATION BEFORE COMMENCEMENT OF MARKING FOR INTERNAL AND
EXTERNAL MODERATION PURPOSES.
1. Use a single tick for the allocation of ONE (1) mark.
2. Use TWO ticks for the allocation of TWO (2) marks.
3. Ticks MUST be placed on/on top of/at the end of, the correct response in the
sentence.
4. A cross (X) MUST be placed at the end of each incorrect/invalid sentence or
response.
5. All paragraph questions must include the use of the symbol:
M … when a candidate has achieved 8 marks.
6. DO NOT allocate marks to candidates where paragraphs are not completed in full
sentences.
7. DO NOT allocate marks where vague responses are given in paragraph responses
that do not include an appropriate link to the responses in the Marking Guideline.
8. Each sub-section MUST have a total reflected on the right-hand margin e.g.1.1
should be a total out of (7) and 1.2 should be a total out of (8) and 1.3 should be a
total out of (15).
9. The subtotals for each sub-section must be CORRECTLY added to give you a
TOTAL for the question, which must be written on the top left-hand margin at the
beginning of the answered question.
10. The subtotals for each completed question MUST be written on the FRONT page
with a TOTAL out of 150.
11. Marking MUST be completed in RED pen.
12. First level Moderation (HOD/Senior Teacher) MUST be completed in BLACK pen.
13. Second level Moderation (Cluster/Circuit) MUST be completed in GREEN pen.
14. You are encouraged to engage with the Marking Guidelines and ADD appropriate
(valid) responses that may have been omitted during the completion of this
marking guideline. For moderation purposes you are required to write these
additions on your marking guidelines in RED and include the amended marking
guidelines as part of an educator portfolio of evidence for external moderation
purposes.
2
Downloaded from hlayiso.com
10781/21
SECTION A: CLIMATE, WEATHER AND GEOMORPHOLOGY
QUESTION 1: CLIMATE AND WEATHER
1.1 1.1.1 Micro-climate (1)
1.1.2 Down-slope (1)
1.1.3 daytime (1)
1.1.4 thermal belt (1)
1.1.5 Frost pocket (1)
1.1.6 calm conditions (1)
1.1.7 Higher (1)
(7 x 1) (7)
1.2 1.2.1 B (1)
1.2.2 B (1)
1.2.3 C (1)
1.2.4 A (1)
1.2.5 B (1)
1.2.6 D (1)
1.2.7 D (1)
1.2.8 C (1)
(8 x 1) (8)
1.3 Refer to FIGURE 1.3 showing mid-latitude cyclones on a synoptic weather map.
1.3.1 Which season is represented on the synoptic weather map in FIGURE 1.3?
Winter (1) (1 x 1) (1)
1.3.2 What stage of development is mid-latitude cyclone C?
Occluded (stage) (1) (1 x 1) (1)
3
Downloaded from hlayiso.com
10781/21
1.3.3 Give evidence from the synoptic map to support your answer to
QUESTION 1.3.2.
The cold front has “caught up” with the warm front. (2)
The occlusion occurs (at the apex)/Cold front overtakes the warm
front. (2)
[Any ONE] (1 x 2) (2)
1.3.4 (a) Which mid-latitude cyclone, A, B or C is the oldest?
C (1) (1 x 1) (1)
(b) Give TWO reasons for your answer to QUESTION 1.3.4 (a).
Mid-latitude cyclones move from west to east/C lies
furthest to the east/they are steered by the westerlies to
move eastwards. (2)
The occluded front has developed at C. (2)
The warm sector has narrowed at C/warm sector at B not as
narrow as C. (2)
[Any TWO] (2 x 2) (4)
1.3.5 Refer to the extract of the station model of Cape Town. Account for the
change in temperature, wind direction and cloud cover as the cold front
of mid-latitude A approaches Cape Town.
Temperature decreases due to upliftment of warm air by the cold
front. (2)
Wind direction will change due to backing of winds (caused by the
cold front. (2)
Cloud cover increases/cumulonimbus clouds due to rapid
upliftment of air caused by steep pressure gradient of the cold
front. (2)
[Learner must indicate the difference and account for why it
occurred.] (3 x 2) (6)
(15)
1.4 FIGURE 1.4 shows a line thunderstorm.
1.4.1 In which season does the line thunderstorm develop over South Africa?
Summer (1) (1 x 1) (1)
1.4.2 Describe the air that flows from the:
(a) South Indian Anticyclone
The warmer, moister and less dense air (2) (1 x 2) (2)
4
Downloaded from hlayiso.com
10781/21
(b) South Atlantic Anticyclone
Colder, drier and denser air (2) (1 x 2) (2)
1.4.3 On which side of the moisture front do line thunderstorms occur?
East (1) (1 x 1) (1)
1.4.4 Give a reason for your answer to QUESTION 1.4.3.
The cold air from the west uplifts the warm, moist air on the east of
the moisture front. (Rising air cools and condenses and forms
clouds.) (2) (1 x 2) (2)
1.4.5 In a paragraph of approximately EIGHT lines, suggest the positive and
negative impact that line thunderstorms have on the agricultural sector
of the interior of South Africa.
POSITIVE:
Line thunderstorms bring rain to irrigate crops. (2)
Line thunderstorms bring rain to irrigate pasture land for livestock.
(2)
It can fill dams creating availability of water during dry periods (2)
It replenishes the ground water as well as rivers to be used for crops
/cattle. (2)
Gives relief to droughts or semi-arid areas practicing agriculture. (2)
NEGATIVE:
Thunderstorms can damage/flood crops. (2)
Thunderstorms can injure/kill/drown cattle. (2)
The gusty wind, hail or rain can wash away/erode the fertile soil. (2)
Affect trading/production of food that impacts on the agricultural
sector (2)
Damage to agricultural infrastructure due to flooding (2)
Silt is washed into dams, reducing their water holding capacity
which is much needed for crops/livestock. (2)
[Any FOUR facts. Must include both positive and negative impacts]
(4 x 2) (8)
(16)
5
Downloaded from hlayiso.com
10781/21
1.5 Refer to FIGURE 1.5 that shows methods to reduce the effects of a heat island.
1.5.1 Define the term urban heat island.
It is an urban area of higher temperature surrounded by rural
areas of lower temperature. (2)
[CONCEPT] (1 x 2) (2)
1.5.2 Describe how the glass windows in FIGURE 1.5 will result in the
increase of temperature in the urban area.
It lets heat in and acts as a greenhouse that traps the heat inside
the building. (2)
It reflects heat between buildings. (2)
[Any ONE] (1 x 2) (2)
1.5.3 Explain TWO possible negative effects that urban heat islands have on
the health of human beings.
It increases human discomfort because of high temperatures. (2)
Heat stress/stroke/cardiovascular illnesses during heat waves (2)
Urban smog reduces visibility and may cause accidents. (2)
Loss of energy to be productive in working environment( 2)
Increases the number of insects such as mosquitoes and fleas
which infect/irritate humans (2)
[Any TWO – must be a negative effect on humans] (2 x 2) (4)
1.5.4 Explain how the THREE strategies (A, B and C) evident in FIGURE
1.5, contributed to the reduction of the heat island effect.
A – By planting more trees, it reduces the amount of heat through
absorbtion. (2)
Transpiration by trees lowers temperatures. (2)
Shadows of the trees will cool the temperatures. (2)
[Any ONE]
B – Dense buildings prevent air from moving freely between
buildings, causing heat to build up. (2)
Space between buildings lowers temperatures because air moves
freely and winds increase. (2)
Cooler winds increase between buildings with significant space.
(2)
[Any ONE]
C – Water sources absorb heat and use it in evaporation. (2)
Evaporation of water uses heat and lowers temperatures. (2)
Water is cooler than surfaces such as sand, tar, concrete etc. (2)
[Any ONE]
[Must refer to A, B and C. All THREE must be explained.] (3 x 2) (6)
(14)
[60]
6
Downloaded from hlayiso.com
10781/21
QUESTION 2: GEOMORPHOLOGY
2.1 2.1.1 Confluence (1)
2.1.2 Drainage basin (1)
2.1.3 River system (1)
2.1.4 Catchment area (1)
2.1.5 Surface run off (1)
2.1.6 Interfluve (1)
2.1.7 Water table (1)
(7 x 1) (7)
2.2 2.2.1 D (1)
2.2.2 E (1)
2.2.3 F (1)
2.2.4 B (1)
2.2.5 C (1)
2.2.6 I (1)
2.2.7 H (1)
2.2.8 G (1)
(8 x 1) (8)
2.3 Refer to FIGURE 2.3 that shows the different types of drainage patterns.
2.3.1 Identify drainage patterns A and B.
A – Dendritic (1)
B – Radial (centrifugal) (1) (2 x 1) (2)
2.3.2 What is the dominant physical factor that determines the development of
different types of drainage patterns?
Underlying rock structure (1) (1 x 1) (1)
2.3.3 Give TWO visible characteristics of drainage pattern A on FIGURE 2.3.
Streams meet at acute angles. (1)
Looks like branches of trees (1) (2 x 1) (1)
7
Downloaded from hlayiso.com
10781/21
2.3.4 Why would farming be more suitable in an area with drainage pattern A?
Drainage pattern A:
Water evenly distributed and more accessible for irrigation (2)
Easier to build storage dams at various locations (2)
Fairly flat land which facilitates the cultivation of soil (2)
[Any TWO] (2 x 2) (4)
2.3.5 Explain how physical factors limit the effective use of water in drainage
pattern B.
Steep slopes result in more runoff and less infiltration. (2)
Steep slopes result in higher velocity of water flow and thus more
erosion, resulting in silting of dams. (2)
Higher velocity and erosion cause water to flow into deep (2)
V-shaped valleys which reduces the accessibility of water. (2)
Uneven landscape results in uneven distribution of water. (2)
More resistant rock structure reduces infiltration and increases
runoff. (2)
[Any THREE] (3 x 2) (6)
(15)
2.4 Refer to FIGURE 2.4 that shows river capture.
2.4.1 Define the concept river capture.
River capture – When a more energetic river captures the
headwaters of a less energetic river (2)
(CONCEPT) (1 x 2) (2)
2.4.2 Name the main physical factor (natural factor) visible in FIGURE 2.4 that
resulted in river capture taking place.
Gradient (1) (1 x 1) (1)
2.4.3 Identify features of river capture labelled C and D in FIGURE 2.4.
C – Elbow of capture (1)
D – Misfit stream (1) (2 x 1) (2)
2.4.4 State the impact that river capture will have on the volume of water in
river D.
The volume will decrease (1) (1 x 1) (1)
8
Downloaded from hlayiso.com
10781/21
2.4.5 Discuss how the process of river capture has led to the rejuvenation of
river F.
Increased flow of water from captured stream E increased the
volume. (2)
The increased volume increases the velocity and erosive power of
river F. (2) (2 x 2) (4)
2.4.6 Explain the negative impact that rejuvenation will have on the economic
activity visible next to river F on FIGURE 2.4.
Higher volume of water will result in flooding of the riverbanks. (2)
Flooding will damage crops grown on the floodplain and
riverbanks. (2)
Damage of crops will result in lower production. (2)
Flooding will cause soil erosion of fertile soils and less economic
activity. (2)
Higher volume and velocity cause damage to crops. (2)
[Any TWO] (2 x 2) (4)
(14)
2.5 Study the extract on Gauteng River Catchment Management in FIGURE 2.5.
2.5.1 Define the concept river management.
The planned and coordinated use of the river without
compromising people’s well-being and the environment (2)
(CONCEPT) (1 x 2) (2)
2.5.2 Give evidence from the extract that shows the importance of catchment
management in Gauteng.
Healthy riverbanks maintain the form of the river channel. (1)
It provides habitat for species (aquatic and terrestrial) and filter
sediment, minerals and light. (1)
Water quality includes the chemical; physical and bacteriological
properties of water that determines its suitability for use. (1)
[Any TWO] (2 x 1) (2)
2.5.3 Identify TWO issues from the article that poses a challenge to effective
river management.
The urban nature of Gauteng (especially the central part) (1)
Road networks across the province seal natural surfaces in a
manner that does not allow natural infiltration of rainwater into the
ground. (1)
This high run-off scenario during rainfall events coupled with
pollution emanating from the urban environment (1)
[Any TWO] (2 x 1) (2)
9
Downloaded from hlayiso.com
10781/21
2.5.4 Explain why aquatic life is affected by poor river management in
Gauteng.
Rivers are home to aquatic life. (2)
Aquatic life feeds directly from the polluted rivers. (2)
Aquatic species have softer skins thereby exposing them more to
chemical waste. (2)
[ANY TWO] (1 x 2) (2)
2.5.5 In a paragraph of approximately EIGHT lines, provide sustainable
strategies that can be implemented to deal with problems associated
with poor river management systems.
Strict local by-laws on disposal of waste from both domestic use
and industry (2)
Buffering the area to prevent pollution (can give examples) (2)
Maintaining the natural vegetation and reducing deforestation (2)
Education and public awareness on environmental management
(2)
Regular cleaning of riverbanks and surrounding areas(2)
Implementing of fines for violation of environmental regulations (2)
[Any FOUR] (4 x 2) (8)
(16)
[60]
TOTAL SECTION A: 120
10
Downloaded from hlayiso.com
10781/21
SECTION B: MAPWORK AND APPLICATION
QUESTION 3: TOPOGRAPHIC AND ORTHOPHOTO MAP TECHNIQUES
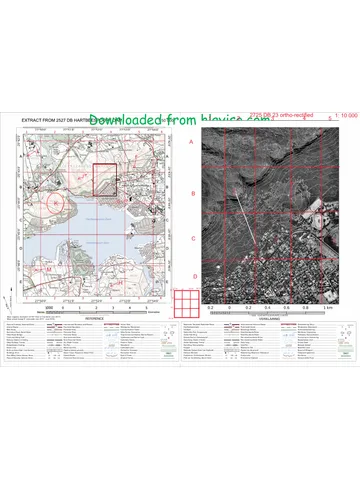
3.1 Refer to the topographical map extract as well as the orthophoto map extract.
3.1.1 C (1) (1 x 1) (1)
3.1.2 B (1) (1 x 1) (1)
3.1.3 Use the following formula and steps to determine the magnetic bearing
from the benchmark, G in block D5 to trigonometrical beacon 93, H in
block C4.
Magnetic bearing = magnetic declination + true bearing
(a) Difference in years: 2021 – 2016 = 5 years (1)
(b) Mean annual change: 9’W (1)
(c) Total annual change: 9’ x 5 years = 45’ (1)
(d) Magnetic declination: 24̊ 26’ + (1) 45’ = 25̊ 11’ W of TN
(e) True bearing: 329 ̊ (1)
(f) Magnetic bearing: 329̊ + 25̊ 11’ = 354̊ (1)
(7 x 1) (7)
3.1.4 Why is it important to calculate the current magnetic declination?
To determine the correct magnetic bearing (2) (1 x 1) (1)
(10)
3.2 Refer to the valley I − J on the topographical map.
3.2.1 (a) The wind that blows at night in the valley is a/an (anabatic/katabatic)
wind?
katabatic wind (2) (1 x 1) (1)
(b) Describe the flow of the wind identified in QUESTION 3.2.1(a).
It flows downslope. (2) (1 x 2) (2)
(c) Identify the type of vegetation at J.
Woodlands (1) (1 x 1) (1)
11
Downloaded from hlayiso.com
10781/21
(d) Explain the climatological factor that determined the location of the
vegetation type at J.
It is located on the (cooler) south/southeast facing slope. (2)
(1 x 2) (2)
3.2.2 Refer to the uThukela River on the orthophoto map.
(a) Identify the fluvial landform created by the uThukela River on the
orthophoto map.
Meander (1) (1 x 1) (1)
(b) Identify slope 5 and give a reason for your answer.
Undercut slope (1)
It is a steeper slope. (1)
More erosion that takes place (1)
[Any ONE] (1 + 1) (2)
(c) (Grass/Trees) are found at 6 on the orthophoto map.
Trees (1) (1 x 1) (1)
(d) Explain the positive impact that the vegetation at 6 will have on the
cultivated land at 7.
It will act as a windbreak./It will reduce the windspeed which
might damage the crops. (1)
It will reduce erosion. (1)
It will increase soil fertility. (1)
[Any ONE] (1 x 2) (2)
(12)
12
Downloaded from hlayiso.com
10781/21
3.3 GIS APPLICATION
3.3 Refer to both the topographical map and the orthophoto map.
3.3.1 (a) Does an orthophoto map consist of raster or vector data?
Raster (1) (1 x 1) (1)
(b) Motivate your answer to QUESTION 3.3.1(a).
It is developed from an aerial photo which consists of pixels. (2)
(1 x 2) (2)
3.3.2 There is clear evidence of the application of buffering on both the
topographic and orthophoto maps.
(a) What is buffering?
A demarcation of an area around a feature/location. (2)
(1 x 2) (2)
(b) Provide evidence of how buffering was applied in block D3 on the
topographic map
There is an open space between the built up area and the
river (2) (1 x 2) (2)
(c) Name ONE data layer that would have been consulted in the
application of buffering in block D3.
Drainage (1)
Topography/Gradient (1)
Transport routes/Infrastructure (1)
Land use (1)
[Any ONE] (1 x 1) (1)
(8)
TOTAL SECTION B: 30
TOTAL: 150
13
Study this subject
Recommended for this subject
Addendum
Geography Grade 12 P1 Eastern Cape Mock 2021 Addendum (Eng)
Question paper
Geography Grade 12 P1 Gauteng Mock 2022 Question Paper (Eng)
Memorandum
Geography Grade 12 P1 Eastern Cape Mock 2018 Memo (English)
Memorandum
Geography Grade 12 Paper 1 EC June 2018 Memo (English)
Memorandum
Geography Grade 12 P1 Eastern Cape Mock 2017 Memo (English)
Question paper
Geography Grade 12 P1 NSC June 2025 Question Paper (English)
More from Grade 12 Geography
Question paper
Geography Grade 12 P2 Gauteng June 2025 Question Paper (Eng)
Question paper
Geography Grade 12 Paper 1 KZN Mock 2025 Question Paper
Question paper
Geography Grade 12 Paper 2 KZN Mock 2025 Question Paper
Question paper
Geography Grade 12 Eastern Cape June 2023 Question Paper
Question paper
Geography Grade 12 GAU June 2023 Question Paper
Question paper