
Prediction
hlayiso mock exams
Practice Series:
Grade 12 NSC Preparation
WWW.HLAYISO.COM
NATIONAL
SENIOR CERTIFICATE
GRADE 12
GEOGRAPHY P1
PREDICTION EXAMINATION 2026
MARKS: 150
TIME: 3 hours
This question paper consists of 15 pages.
Copyright reserved Please turn over
Skip to contentAll 2026 papers 

View all

Geography Grade 12 P1 NSC November Prediction 2026 QP (Eng)
Grade 12 Geography Paper 1 question paper from the NSC November Prediction Exam 2026 (English), 15 pages. Read online or download the free PDF.
Geography · Grade 12 · NSC November Prediction Exam · 2026 · English. Question paper, 15 pages. Read online or download the PDF.
- Subject
- Geography
- Grade
- Grade 12
- Language
- English
- Document type
- Question paper
- Year
- 2026
- Exam period
- NSC November Prediction Exam
- Paper
- 1
- Publisher
- Hlayiso
- Curriculum
- CAPS
- Pages
- 15
- File size
- 1.1 MB
Free to read online, no sign-up needed
Loading document…
Loading document…
1 of 15
This exam
NSC November Prediction Exam 2026
- Paper 1Question paperAddendumMemo
- Paper 2Question paperAddendumMemo
Document textSearch extracted text and jump to a page.
Geography/P1 2 Hlayiso/Prediction 2026
NSC Prediction
INSTRUCTIONS AND INFORMATION
1. This question paper consists of TWO sections.
SECTION A
QUESTION 1: CLIMATE AND WEATHER (60)
QUESTION 2: GEOMORPHOLOGY (60)
SECTION B
QUESTION 3: GEOGRAPHICAL SKILLS AND TECHNIQUES (30)
2. Answer ALL THREE questions.
3. ALL diagrams are included in the question paper.
4. Leave a line between the subsections of questions answered.
5. Start EACH question at the top of a NEW page.
6. Number the answers correctly according to the numbering system used in this question
paper.
7. Do NOT write in the margins of the ANSWER BOOK.
8. Draw fully labelled diagrams when instructed to do so.
9. Answer in FULL SENTENCES, except when you have to state, name, identify or list.
10. Units of measurement MUST be indicated in your final answer, e.g. 1 020 hPa, 14 ◦ C
and 45 m.
11. You may use a non-programmable calculator.
12. You may use a magnifying glass.
13. Write neatly and legibly.
SPECIFIC INSTRUCTIONS AND INFORMATION FOR SECTION B
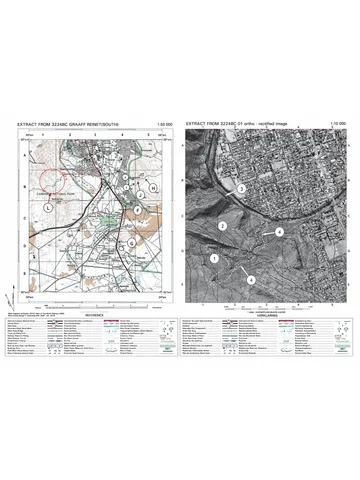
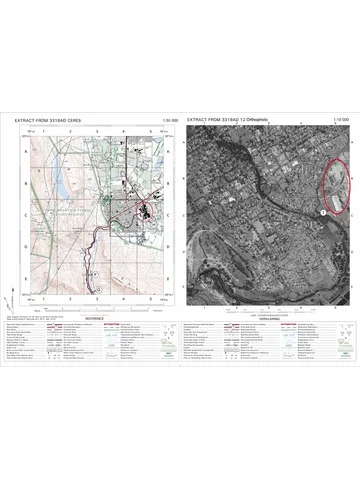
14. A 1 : 50 000 topographical map extract of 3320BB LAINGSBURG and a 1 : 10 000
orthophoto map extract of LAINGSBURG are used in this section. The map sheet is
supplied with this paper as Geography P1 Prediction 2026 Map (3320BB Laingsburg).
This extract was first used in the 2025 Eastern Cape preparatory examination; it is NOT
the map of the real 2026 examination. Letters, numbers and shapes on the maps that
are not referred to in this paper must be ignored.
15. The area demarcated in RED on the topographical map represents the area covered
by the orthophoto map.
16. Show ALL calculations. Marks will be allocated for steps in calculations.
Copyright reserved Please turn over
Geography/P1 3 Hlayiso/Prediction 2026
NSC Prediction
SECTION A: CLIMATE AND WEATHER AND GEOMORPHOLOGY
QUESTION 1: CLIMATE AND WEATHER
1.1 Refer to the synoptic weather map below. Various options are provided
as possible answers to the following questions. Choose the answer and
write only the letter (A–D) next to the question numbers (1.1.1 to 1.1.8)
in the ANSWER BOOK, e.g. 1.1.9 D.
N dry air
D
moist air
1012
1008
L
1020
C
1024 1020
28
H 24 E
1024
A H
Atlantic Ocean
Indian Ocean B
[Source: Examiner’s own sketch]
1.1.1 The season represented on the synoptic weather map is …
A winter.
B summer.
C autumn.
D spring.
1.1.2 High-pressure cell A is the … high.
A Kalahari
B South Indian
C South Atlantic
D Siberian
1.1.3 Low-pressure cell C over the interior forms because of …
A air subsiding from the upper atmosphere.
B intense heating of the land surface.
C cold air moving in from the south.
D the ridging of a high-pressure cell.
1.1.4 Line D represents a …
A cold front.
B warm front.
C moisture front.
D occluded front.
Copyright reserved Please turn over
Geography/P1 4 Hlayiso/Prediction 2026
NSC Prediction
1.1.5 The air to the east of line D is … and …
(i) warm (ii) cold (iii) moist (iv) dry
A (i) and (iii)
B (i) and (iv)
C (ii) and (iii)
D (ii) and (iv)
1.1.6 High-pressure cell B transports moisture into the interior
because its … circulation results in … winds along the east
coast.
A clockwise; offshore
B anticlockwise; onshore
C clockwise; onshore
D anticlockwise; offshore
1.1.7 The wind direction and wind speed recorded at weather station
E are …
A south-westerly; 15 knots.
B north-easterly; 5 knots.
C north-easterly; 15 knots.
D south-westerly; 25 knots.
1.1.8 The thunderstorms that develop to the east of line D are
associated with … clouds and …
(i) cumulonimbus (ii) nimbostratus (iii) hail (iv) drizzle
A (i) and (iv)
B (ii) and (iii)
(8 x 1) (8)
C (ii) and (iv)
D (i) and (iii)
Copyright reserved Please turn over
Geography/P1 5 Hlayiso/Prediction 2026
NSC Prediction
1.2 Refer to the sketch below showing a valley on a clear, calm winter night
in the Southern Hemisphere. Complete the statements in COLUMN A
with the options in COLUMN B. Write only Y or Z next to the question
numbers (1.2.1 to 1.2.7) in the ANSWER BOOK, e.g. 1.2.8 Y.
D
(north-facing slope)
A A
inversion layer
C
S N
B
farmstead
[Source: Examiner’s own sketch]
COLUMN A COLUMN B
1.2.1 Wind A is a/an … wind. Y anabatic
Z katabatic
1.2.2 Wind A develops when the valley Y terrestrial
slopes lose heat through … Z radiation
insolation
1.2.3 The zone of cold air at B is called Y thermal belt
a… Z frost pocket
1.2.4 Between B and the inversion layer Y decreases
the temperature … with height. Z increases
1.2.5 Zone C on the valley slopes is most Y fruit orchards
suitable for … Z factories that emit
smoke
1.2.6 Slope D receives … insolation Y more
during the day than the opposite Z less
slope.
1.2.7 Radiation fog forms at B when Y above 0 ◦ C
the air cools to its dew point at a Z below 0 ◦ C
temperature …
(7 x 1) (7)
Copyright reserved Please turn over
Geography/P1 6 Hlayiso/Prediction 2026
NSC Prediction
1.3 Refer to the sketch of a mid-latitude cyclone and the weather warning
below.
Cape Town
warm air WEATHER WARNING
A strong cold front will reach Cape
Town on Sunday morning. Gale-force
A B north-westerly winds are expected
ahead of the front, followed by heavy
rain, a sharp drop in temperature and
possible hail. Snow is expected on the
cold air
L high mountains of the Western Cape
988 on Monday. Farmers are warned that
cold air livestock may be at risk.
direction of movement
[Source: Examiner’s own sketch and weather warning]
1.3.1 In which stage of development is the mid-latitude cyclone? (1 x 1) (1)
1.3.2 Give evidence from the sketch to support your answer to
QUESTION 1.3.1. (1 x 2) (2)
1.3.3 Why do mid-latitude cyclones influence the Western Cape
mainly in winter? (1 x 2) (2)
1.3.4 In the ANSWER BOOK, draw a fully labelled cross-section
along line A–B. Clearly indicate the following:
(a) Cold front and warm front (b) Warm sector (c) ONE
cloud type (d) Direction of movement (4 x 1) (4)
1.3.5 Explain why the weather associated with the cold front is more
severe than the weather associated with the warm front. (2 x 2) (4)
1.3.6 Suggest ONE precaution that farmers should take after this
weather warning has been issued. (1 x 2) (2)
Copyright reserved Please turn over
Geography/P1 7 Hlayiso/Prediction 2026
NSC Prediction
1.4 Refer to the infographic below on Tropical Cyclone Kumbi, a fictional
tropical cyclone based on real cyclones in the South-West Indian Ocean.
10◦ S
1
2
MOZAMBIQUE 3
4
5
6 MAD
7 AGA
Beira SCA 20◦ S
R
Mozambique
Channel
Circled numbers show the position of the cyclone at noon on Day 1 to Day 7.
Day 1 2 3 4 5 6 7
Pressure (hPa) 1 004 992 966 986 972 958 994
Max. wind speed (km/h) 55 95 165 110 150 185 70
FACT FILE: Kumbi formed north-east of Madagascar, crossed northern
Madagascar on Day 4 and strengthened again over the warm Mozambique
Channel. It made landfall near Beira late on Day 6. A storm surge of almost
3 m flooded low-lying parts of the coast. The national weather service had
issued warnings three days before landfall.
[Source: Examiner’s own sketch and fictional data]
1.4.1 State TWO conditions in the Mozambique Channel that allowed
Tropical Cyclone Kumbi to strengthen again after Day 4. (2 x 1) (2)
1.4.2 On which day was Tropical Cyclone Kumbi at its most intense? (1 x 1) (1)
1.4.3 Give TWO pieces of evidence from the table to support your
answer to QUESTION 1.4.2. (2 x 1) (2)
1.4.4 Explain why Tropical Cyclone Kumbi weakened as it crossed
Madagascar on Day 4. (2 x 2) (4)
1.4.5 Explain how the storm surge mentioned in the fact file
developed. (1 x 2) (2)
1.4.6 Suggest strategies that the authorities in Mozambique can put
in place to reduce the impact of future tropical cyclones on
coastal communities. (2 x 2) (4)
Copyright reserved Please turn over
Geography/P1 8 Hlayiso/Prediction 2026
NSC Prediction
1.5 Refer to the infographic below on urban climates.
A: AIR TEMPERATURE AT 22:00 ON A CLEAR, CALM WINTER
NIGHT ACROSS A CITY
◦C
18 17
16 15
14
14
12 12
12
10
10 9
8
6
4
2
0
Rural Outer Industrial CBD City Inner Rural
farm suburb area park suburb farm
B: POLLUTION OVER THE SAME CITY BY DAY AND AT NIGHT
wind
pollution dome
inversion layer
pollution
X (DAY) Y (NIGHT)
[Source: Examiner’s own sketches and fictional data]
1.5.1 Define the concept urban heat island. (1 x 2) (2)
1.5.2 Refer to graph A. Calculate the difference in temperature
between the CBD and the rural farm on the left of the graph. (1 x 1) (1)
1.5.3 Explain why the temperature drops over the city park. (1 x 2) (2)
1.5.4 Refer to sketches X and Y in B. Explain why the pollution in
sketch Y (at night) is concentrated close to the surface of the
city. (1 x 2) (2)
1.5.5 In a paragraph of approximately EIGHT lines, suggest
sustainable strategies that the city planners can put in place
to reduce the urban heat island effect and the pollution dome. (4 x 2) (8)
[60]
Copyright reserved Please turn over
Geography/P1 9 Hlayiso/Prediction 2026
NSC Prediction
QUESTION 2: GEOMORPHOLOGY
2.1 Refer to the sketches below showing cross-sections through three river
channels (P, Q and R) and the position of the water table. Complete the
statements in COLUMN A with the options in COLUMN B. Write only Y or
Z next to the question numbers (2.1.1 to 2.1.8) in the ANSWER BOOK,
e.g. 2.1.9 Y.
P Q R
wet-season water table dry-season water table water in channel
[Source: Examiner’s own sketch]
COLUMN A COLUMN B
2.1.1 River P is a … river. Y permanent
Z periodic
2.1.2 River Q flows … Y all year round
Z only in the wet
season
2.1.3 River R, which flows only after Y episodic
heavy rainfall, is a/an … river. Z periodic
2.1.4 The upper surface of the saturated Y groundwater
zone below the ground is the … Z water table
2.1.5 Rainwater that seeps into the soil Y infiltration
is known as … Z surface run-off
2.1.6 A river that originates in a Y episodic
high-rainfall area and flows Z exotic
through a dry area is a/an … river.
2.1.7 Most rivers in the dry western half Y perennial
of South Africa are … Z non-perennial
2.1.8 Surface run-off is increased by … Y impermeable
Z surfaces
dense vegetation
(8 x 1) (8)
Copyright reserved Please turn over
Geography/P1 10 Hlayiso/Prediction 2026
NSC Prediction
2.2 Refer to sketches 1 and 2 below. Various options are provided as
possible answers to the following questions. Choose the answer and
write only the letter (A–D) next to the question numbers (2.2.1 to 2.2.7)
in the ANSWER BOOK, e.g. 2.2.8 D.
SKETCH 1: A WATERFALL (SIDE VIEW)
flow
resistant (hard) rock
steep-sided valley
downstream of the falls
Q
less resistant
(soft) rock
P
SKETCH 2: A REJUVENATED RIVER
height
T T
T T original profile
K
cross-profile longitudinal profile distance
[Source: Examiner’s own sketches]
2.2.1 The waterfall in sketch 1 formed because the river flows over
…
A rock of uniform resistance.
B a layer of resistant rock that overlies less resistant rock.
C loose sediment deposited by the river.
D a gentle gradient.
2.2.2 The feature at P at the base of the waterfall is a …
A pothole.
B rapid.
C plunge pool.
D gorge.
2.2.3 The waterfall retreats upstream as a result of …
A lateral erosion and deposition.
B undercutting and the collapse of the overhanging rock.
C deposition in the plunge pool.
D a decrease in the volume of water.
Copyright reserved Please turn over
Geography/P1 11 Hlayiso/Prediction 2026
NSC Prediction
2.2.4 The steep-sided valley at Q that forms as the waterfall retreats
is a …
A floodplain.
B meander.
C delta.
D gorge.
2.2.5 The flat steps labelled T on the cross-profile in sketch 2 are …
A levees.
B river terraces.
C interlocking spurs.
D slip-off slopes.
2.2.6 The rejuvenation shown in sketch 2 could have been caused
by … and …
(i) uplift of the land (ii) a rise in sea level (iii) a drop in sea
level (iv) a decrease in discharge
A (i) and (iii)
B (i) and (ii)
C (ii) and (iv)
D (iii) and (iv)
2.2.7 The break of slope labelled K on the longitudinal profile is a …
A watershed.
B knickpoint.
(7 x 1) (7)
C permanent base level.
D confluence.
2.3 Refer to drainage patterns A and B below. The two areas are the same
size.
lake
X
A B
[Source: Examiner’s own sketch]
2.3.1 Identify drainage patterns A and B. (2 x 1) (2)
2.3.2 Describe the underlying rock structure that resulted in drainage
pattern A. (1 x 2) (2)
Copyright reserved Please turn over
Geography/P1 12 Hlayiso/Prediction 2026
NSC Prediction
2.3.3 Why do the streams in drainage pattern B flow towards a central
point? (1 x 2) (2)
2.3.4 Determine the stream order of the main stream at X in drainage
pattern A. (1 x 1) (1)
2.3.5 Define the concept drainage density. (1 x 2) (2)
2.3.6 Which drainage pattern, A or B, has the higher drainage
density? (1 x 1) (1)
2.3.7 Give a reason for your answer to QUESTION 2.3.6. (1 x 1) (1)
2.3.8 Explain how EACH of the following influences drainage density:
(a) High rainfall (1 x 2) (2)
(b) Dense vegetation cover (1 x 2) (2)
2.4 Refer to the sketch below showing rivers X and Y BEFORE river capture.
headward
erosion
N
Y
X gentle gradient
hard rock
steep gradient higher altitude
soft rock (shale) (900 m)
high rainfall
lower altitude (300 m)
watershed
[Source: Examiner’s own sketch]
2.4.1 Define the concept river capture (stream piracy). (1 x 2) (2)
2.4.2 Which river, X or Y, is likely to become the captor stream? (1 x 1) (1)
2.4.3 Give ONE reason from the sketch for your answer to
QUESTION 2.4.2. (1 x 2) (2)
2.4.4 In the ANSWER BOOK, draw a labelled sketch to show the
area AFTER river capture has taken place. Clearly indicate the
following:
(a) Captor stream (b) Elbow of capture (c) Wind gap (d)
Misfit stream (4 x 1) (4)
2.4.5 Explain the negative impact of river capture on farmers who
depend on the water of river Y downstream of the point of
capture. (2 x 2) (4)
2.4.6 Why will the captor stream be rejuvenated after river capture? (1 x 2) (2)
Copyright reserved Please turn over
Geography/P1 13 Hlayiso/Prediction 2026
NSC Prediction
2.5 Refer to the extract below on catchment and river management.
A RIVER AND ITS WETLAND IN TROUBLE
The Sizwe River (a fictional river) rises in a grassland wetland
above the town of Khanyisa. Over the past ten years, a large part of
the wetland has been drained and filled in for new houses and a
shopping centre. Further downstream, illegal sand mining has
removed sand from the riverbed and the riverbanks have collapsed.
The town’s sewage works is old and overloaded, and after heavy
rain raw sewage overflows into the river. About 4 000 households
downstream use water from the river for drinking, washing and
irrigating food gardens. Residents report that the river now floods
more often after summer storms and dries up earlier in winter than it
did in the past.
[Source: Examiner’s own extract]
2.5.1 Define the concept catchment management. (1 x 2) (2)
2.5.2 Identify TWO human activities in the extract that have damaged
the Sizwe River. (2 x 1) (2)
2.5.3 According to the extract, how many households depend on the
Sizwe River? (1 x 1) (1)
2.5.4 Explain why the river now floods more often and dries up earlier
since the wetland was drained. (1 x 2) (2)
2.5.5 In a paragraph of approximately EIGHT lines, suggest
sustainable strategies that the municipality and the community
of Khanyisa can implement to restore the health of the Sizwe
River and its catchment. (4 x 2) (8)
[60]
TOTAL SECTION A: 120
Copyright reserved Please turn over
Geography/P1 14 Hlayiso/Prediction 2026
NSC Prediction
SECTION B
QUESTION 3: GEOGRAPHICAL SKILLS AND TECHNIQUES
GENERAL INFORMATION ON LAINGSBURG
Laingsburg is a small town in the Great Karoo in the Western Cape. It is on the N1 national
road between Cape Town and Johannesburg, in the valley of the Buffels River, which the
Wilgehout River joins near the town. The climate is semi-arid, with low and unreliable
rainfall, hot summers and cold winters. Clear winter nights are often frosty. The town was
largely destroyed by a flood of the Buffels River on 25 January 1981.
[Adapted from various sources. Map extracts: Chief Directorate: National Geo-spatial Information]
3.1 MAP SKILLS AND CALCULATIONS
3.1.1 Compared with the orthophoto map, the topographical map has
a … scale and shows … detail.
(i) larger (ii) smaller (iii) more (iv) less
A (i) and (iii)
B (ii) and (iv)
(1 x 1) (1)
C (i) and (iv)
D (ii) and (iii)
3.1.2 The feature found at 33◦ 09′ 31′′ S; 20◦ 50′ 22′′ E on the
topographical map is a …
A trigonometrical station.
B reservoir.
(1 x 1) (1)
C windpump.
D bench mark.
3.1.3 Calculate the magnetic declination for 2026. Use the
information printed on the topographical map. (3 x 1) (3)
3.1.4 Calculate the area, in km2 , of the area demarcated in red on the
topographical map (the area covered by the orthophoto map).
Use the following measurements taken on the topographical
map:
Length = 3,9 cm Breadth = 3,3 cm
Formula: Area = Length × Breadth (3 x 1) (3)
Trigonometrical station 103 in block D2 on the orthophoto map
is NOT intervisible with the railway bridge at 6 in block D3.
3.1.5 Name the type of slope responsible for the lack of intervisibility. (1 x 1) (1)
3.1.6 Give evidence from the orthophoto map to support your answer
to QUESTION 3.1.5. (1 x 1) (1)
Copyright reserved Please turn over
Geography/P1 15 Hlayiso/Prediction 2026
NSC Prediction
3.2 MAP INTERPRETATION
Refer to the Wilgehout River (Wilgehoutrivier) in blocks A1 to
B2 on the topographical map.
3.2.1 The Wilgehout River generally flows in a
(north-westerly/south-easterly) direction. (1 x 1) (1)
3.2.2 Give evidence from the topographical map to support your
answer to QUESTION 3.2.1. (1 x 2) (2)
Refer to the Buffels River (Buffelsrivier) south of the railway
bridge at 6 in blocks D4 and E4 on the orthophoto map.
3.2.3 The many channels separated by sand deposits show that this
section of the river is a (braided stream/meander). (1 x 1) (1)
3.2.4 Explain why this type of channel (answer to QUESTION 3.2.3)
has developed in the Buffels River. (1 x 2) (2)
Laingsburg lies on the valley floor below the ridge with
trigonometrical station 102 (block C3 on the topographical
map).
3.2.5 On a clear winter night, a/an (anabatic/katabatic) wind will blow
down the slopes of this ridge towards the town. (1 x 1) (1)
3.2.6 Explain why smoke and other pollutants from the town are likely
to be trapped over Laingsburg on such a night. (1 x 2) (2)
Refer to the ridge with trigonometrical station 103 in block D2
on the orthophoto map.
3.2.7 Which slope of this ridge, the north-facing or the south-facing
slope, will receive more insolation in winter? (1 x 1) (1)
3.2.8 Explain your answer to QUESTION 3.2.7. (1 x 2) (2)
3.3 GEOGRAPHICAL INFORMATION SYSTEMS (GIS)
3.3.1 The orthophoto map is an example of (raster/vector) data. (1 x 1) (1)
3.3.2 The height of 846,8 m at trigonometrical station 104 on the
topographical map is an example of (spatial/attribute) data. (1 x 1) (1)
3.3.3 Define the concept remote sensing. (1 x 2) (2)
3.3.4 Explain how remote sensing could help the Laingsburg
municipality during a flood of the Buffels River. (1 x 2) (2)
3.3.5 Why would a GIS specialist use the orthophoto map rather than
the topographical map to identify individual houses that are at
risk of flooding? (1 x 2) (2)
[30]
TOTAL SECTION B: 30
GRAND TOTAL: 150
Copyright reserved
Study this subject
Recommended for this subject
Question paper
Geography Grade 12 P1 GP Prelim 2023 Question Paper (Eng)
Question paper
Geography Grade 12 P1 Gauteng Mock 2022 Question Paper (Eng)
Question paper
Geography Grade 12 P1 Eastern Cape Mock 2019 QP (Eng)
Question paper
Geography Grade 12 P1 EC June 2016 Question Paper (English)
Memorandum
Geography Grade 12 Paper 1 NSC November 2025 Memo (English)
Memorandum
Geography Grade 12 P1 Gauteng Prelim 2024 Memo (English)
More from Grade 12 Geography
Memorandum
Geography Grade 12 Paper 2 Gauteng Mock 2025 Memo
Memorandum
Geography Grade 12 Gauteng June 2024 Memo (English)
Memorandum
Geography Grade 12 Paper 1 KZN Prelim 2023 Memo
Question paper
Geography Grade 12 Paper 2 KZN Prelim 2023 Question Paper
Question paper
Geography Grade 12 MAPS 2023 Question Paper
Question paper