
we
ay
()
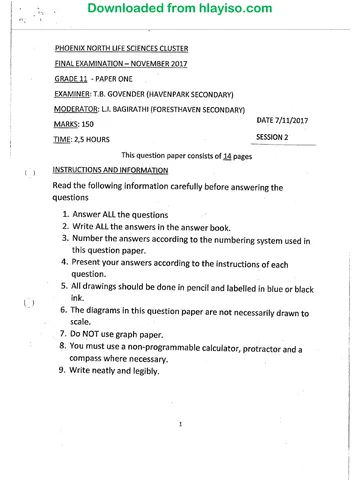
PHOENIX NORTH LIFE SCIENCES CLUSTER
FINAL EXAMINATION — NOVEMBER 2017
GRADE 11 - PAPER ONE
EXAMINER: T.B. GOVENDER (HAVENPARK SECONDARY)
MODERATOR: L.|, BAGIRATHI (FORESTHAVEN SECONDARY)
DATE 7/11/2017
MARKS: 150
TIME: 2,5 HOURS SESSION 2
This question paper consists of 14 pages
INSTRUCTIONS AND INFORMATION
Read the following information carefully before answering the
questions
1. Answer ALL the questions
2. Write ALL the answers in the answer book.
3. Number the answers according to the numbering system used in
this question paper.
4. Present your answers according to the instructions of each
question. a
5. All drawings should be done in pencil and labelled in blue or black
ink.
6. The diagrams in this question paper are not necessarily drawn to
scale.
_7. Do NOT use graph paper. .
8. You must use a non-programmable calculator, protractor and.a
compass where necessary.
9. Write neatly and legibly.
Skip to contentAll 2017 papers 

View all
Life Sciences Grade 11 Paper 1 NSC Prelim 2017 Paper & Memo
Grade 11 Life Sciences Paper 1 question paper and memo from the NSC Prelim Exam 2017, 22 pages. Read online or get the free PDF download.
Life Sciences · Grade 11 · NSC Prelim Exam · 2017. Question paper and memorandum, 22 pages. Read online or download the PDF.
- Subject
- Life Sciences
- Grade
- Grade 11
- Document type
- Question paper and memo
- Year
- 2017
- Exam period
- NSC Prelim Exam
- Paper
- 1
- Curriculum
- CAPS
- Pages
- 22
- File size
- 850.3 KB
Free to read online, no sign-up needed
Loading document…
Loading document…
1 of 22
This exam
NSC Prelim Exam 2017
- Paper 1Paper and memo
- Paper 2Paper and memo
- Paper 3Paper and memo
- Paper and memo
Document textSearch extracted text and jump to a page.
SECTION A
QUESTION 1
1.1. Various options are provided as possible answers to the following questions. Choose the
correct answer and write only the LETTER (A to D) next to the question number (1.1.1 to
1.1.10) in your answer book for example 1.1.11 D.
4.1.1. Cellular respiration in a green leaf takes place ...
A.. continuously
B_ - during the day only
C intissues without chlorophyll only
D during the night only
1.4.2. Air breathed out is different from air breathed in because it ...
A is cooler
Bis drier
C contains less carbon dioxide °
D contains less oxygen
1.1.3. Which ONE of the following can be absorbed without further digestion?
A proteins
B lipids
C glucose
D starch
1.1.4. Photolysis occurs during ....
A dark phase
B light phase
C kreb’s cycle
D oxidative phosphorylation
1.1.5. Which ONE of the following characteristic of a developing country is
false?
A high birth rate
B high infant mortality rate
C high standard of living
D high population growth
Questions 1.1.6, and 1.1.7. are based on the diagram showing the human thorax
1.4.6 Which of the following are represented by A, B, D and E?
A trachea, lung, intercostal muscle, larynx
B larynx, trachea, lung, intercostal muscle
“¢ larynx, intercostal muscle, trachea, lung
D bronchiole, lung, alveolus, trachea
1.1.7 Study the features listed below
1. Lined with hair to remove dust
2. Has cartilage that are C- shaped to allow the oesophagus to
stretch during swallowing
3. Lined with ciliated columnar epithelial tissue with goblet cells to
secrete mucus to trap dust and germs.
Which combination of features are adaptation of part B?
A 1,2,3
B Land 3
c 2 and 3 only
dD 1 and 2 only
1.1.8 Which one of the following is the correct sequence of activities that
occur during nutrition? C )
A egestion, digestion, absorption, ingestion
B ingestion, digestion, absorption, egestion
c digestion, absorption, ingestion, egestion
D absorption, ingestion, digestion, egestion
1.1.9 Each of the following increase the rate of photosynthesis except an
Increase in .....
A carbon dioxide
_B light intensity
¢ oxygen
D temperature
oa
4.1.10 Which ONE of the following represent the correct function of the
renal artery and the renal vein?
ot
Renal artery Renal Vein
A Carries deoxygenated with waste Carries oxygenated blood with waste
products to the kidney products to the kidney
B Carries oxygenated blood with no Carries deoxygenated blood with waste
waste products to the kidney products away from the kidney
c Carries oxygenated blood with waste | Carries deoxygenated blood with no waste
products to the kidney products away from the kidney
D Carries oxygenated blood with waste | Carries deoxygenated blood with waste
products away from the kidney products to the kidney
(10%2) (20)
1.2. Give the correct bialogical term for each of the following descriptions . Write only the
term next to the question number (1.2.1. to 1.2.8.) in the ANSWER BOOK,
1.2.1. Storage form of glucose in plants
1.2.2. Lymph vessel which transport absorbed fats
1.2.3. Wave like muscular contractions which moves food along the alimentary canal
1.24, A nutritional disease which occur in children who are fed on a high carbohydrate
and a low protein dist
1.2.5. A protective membrane surrounding the lung
1.2.6, Structural and functional unit of the kidney
1.2.7. Energy carrier in a call
1.2.8. The acid which accumulates in the muscles of humans during continuous strenuous
physical activity
(8)
1.3. Indicate whether each of the staterment.in COLUMN | applies to A ONLY, B ONLY ,
BOTH A AND B or NOME of the items in COLUMN Il. Write A only, B only, both A and B,
ornane next to the question number (1.3.1. to 1.3.5.) in the ANSWER BOOK for example
13.6. Banly.
4.3.5,
Individuals of the same species competing
fora resource
Interspecific competition
Intraspecific competition
COLUMN COLUMN
1.3.1. Micro -organism which cause tuberculosis | A: Bacteria
B: Fungi
1.3.2, Occur in the mitochondria A: Kreb’s cycle
i B: Oxidative Phosphorylation
1.3.3. Organ which secretes gastric juice A: Liver
: B: Pancreas
4.3.4. Density independent factor A: Drought
B: Flood
A:
B:
(5X 2}
(10)
1.4, The diagram below represent age distribution pyramid for the human population of a
developing country in one year at a certain time.
age groups In years .
Y.
85+
80-84
75-79
[] 70-74
65-69
60-64
55-59
30-54
45-49
40-44
38-39
[ 30-34 ]
il 25-29 l
[ 20-24 l
{ 119 l
Co 10-14 l
59 I
o-~* . _]
Percentage of Percentage of
females males
Age Pyramid A
1.4.1. Comment on why the above diagram represent an age pyramid of a developing
country. (2) . ‘
1.4.2, Name the method used to determine the population size of a country (1)
1.4.3. Why is the life expectancy lower in a developing country than in a developed country? (2)
re
(5)
1.5, The following diagram illustrates some investigations carried out on photosynthesis.
The plant was kept in the dark for 48 hours before being placed in sunlight.
leaf C
Potassium
hydroxide
solution
Apparatus to investigate aspects of photosynthesis
4.5.1. What is the aim of the investigation on:
(i) leaf A
(ii) leaf B
1.5.2. Why was the plant kept in the dark for 48 hours before being placed in sunlight ?
1.5.3, What is the purpose of the potassium hydroxide solution?
1.5.4. The following question refers to the method used to test the leaf (A, B and C)
for starch.
1.5.4.1. Why was the leaf boiled in a beaker of water?
1,5.4.2. Why was the leaf boiled in a test tube containing alcohol?
1.5.4.3. Name the chemical used to test for starch.
TOTAL SECTION A:
(1)
(4)
(1)
(1)
(1)
(1)
(1)
(7)
50
2.1, The results below show the effect of light intensity on the rate of photosynthesis in
a plant when placed, in turn, in two concentrations of carbon dioxide.
Light Rate of photosynthesis in | Rate of photosynthesis in
Intensity 0,03% CO2 0,13% CO2
1 0.9 15
2 1.5 2.3
3 2.0 3.1
4 2.3 3.9
5 2.4 4.3
6 2.4 4.3
7 2.4 43
2.1.1. Using the results reflected in the table above draw, on the same system of axes,
line graphs showing the rate of photosynthesis in the two consecutive concentrations of
CO2 when exposed to different light intensities. (8)
2.1.2. Describe two conclusions that can be made from the graphs. (4)
2.1.3. Suggest a reason as to why the rate of photosynthesis would drop if the CO2 level is
raised to 4%. (3)
(15)
2.2. Study the diagram below showing the human digestive system.
2.2.1. Give the LETTER and the NAME of the part that:
2.2.1.4, produces bile (2)
2.2.1.2. contains millions of tiny finger like projections called villi. (2)
2.2.13, a bag like organ which store food temporarily (2)
2.2.2. State the end products of:
2.2.2.1 lipid digestion (2)
2.2.2.2. protein digestion (1)
2.2.3.1. Identify organ B. (1)
2.2.3.2. Explain the role played by organ B when the blood glucose level is raised above the
normal limit. (4)
(14)
10
2.3. A test tube containing some yeast and sugar was placed in a water bath as shown in the
diagram below. After 10 minutes the rate of bubbling was measured. The experiment was
then repeated with the temperature of the water bath at each temperature
shown in the table below. Test tube A has a layer of paraffin to prevent O2from reaching
the yeast and sugar solution.
delivery
tube
~ paraffin bubbles of =
gas, ; ,
yeast &
sugar fy
water bath “FA :
Tee Aree NOS BO cuceenre
Temperature (°C) 10 20 30 40 50 60
Number of gas bubbles per minute 5 12 20 26 28 14
2.3.1, Name the type of anaerobic respiration taking place in yeast cells which produces the
gas. (2)
2.3.2. Identify the :
2.3.2.1. dependent variable (1) |
2.3.2.2, independent variable (1) |
o . . |
|
2.3.3. Name the gas being produced. (1)
2.3.4. Describe the test used to identify the gas present in test tube B. (3)
2.3.5, Explain why the number of gas bubbles released per minute decreases when the
temperature is 60°C, (3)
(14)
TOTAL FOR QUESTION 2: 40 |
11
QUESTION 3
3.1. The diagram below represent a section through an alveolus and surrounding
blood capillary in the human body.
3.4.4.
3.1.2.
3.1.3,
3.1.4,
3.4.5,
Name the type of epithelial tissue numbered 1. and 2. (2)
Identify the blood cell numbered 3. . (2)
Discuss ONE structural adaptation displayed by the blood cell identified in
3.1,2.above which enables it to carry out its function efficiently. (2)
Discuss the difference in composition of blood entering at A and leaving
at B. {2)
List any two structural adaptations of the alveolus which makes it well
suited for gas exchange, (2)
“Inhalation is the process by which air rich in oxygen is drawn into the lungs
as a result of the action of the breathing muscles,”
3.2. Discuss how the process of inhalation occurs. {6)
(16)
12
3.3.1, Differentiate between the terms:
3.3.1.1. Immigration and emigration (2)
3.3.1.2. Natality and mortality . (2)
3.3.2. The graph below represent a population of zebras in a:specific habitat.
d
A B c '
| Population, D ¥
size
Lerner
>
Time
3.3.2.1. Name the growth form shown in the graph. (1)
3.3.2.2. [dentify phases A, B and C. (3).
3.3.2.3. Explain the initial phase A start slowly. (2)
3.3.2.4. What does the dotted line X represent. (1)
3.3.2.5, List 3 density dependent factors which could limit the size of the zebra population. (3)
(10)
13
|
|
|
3.4, In an investigation to determine the size of the crab population in a dam, 45 crabs were
caught. The shell of each crab was marked with a spot of black paint. The crabs were
then released back into the dam.
Two weeks later, a sample of 36 crabs was taken from the same dam. The following diagram
show the crabs that were caught.
3.4.1. Using the Petersen Index, estimate the total number of crabs in the dam. Show all
working, . (5)
3.4.2. Suggest TWO reasons why the estimated size of the population may differ from the
real population size. (2)
3.4.3. List 3 precautions to be taken to ensure that the mark-recapture method is
reliable, ~ (3)
(10)
TOTAL FOR QUESTION 3: 40
SECTION C
UESTION 4
The kidneys function as excretory as well as osmoregulatory organs. A group of scientists
investigated the relationship between the colour of urine and the loss of water fram the body.
It was observed that on a hot day the urine generally tends to be dark yellow and concentrated.
Discuss the role played by the kidneys, hypothalamus and pituitary gland on a hot day which
results in concentrated urine being produced which is dark yellow and also discuss 4 ways in
which the kidneys are structurally suited to carry out their function as excretory organs.
Content (17)
Synthesis (3)
(20)
Grand Total: 150
14
aN
PHOENIX NORTH LIFE SCIENCES CLUSTER
FINAL
EXAMINATION ~ NOVEMBER 2017
GRADE 11 — PAPER 1
SUGGESTED ANSWERS AND MARKING GUIDELINES
SECTION A
QUESTION ONE
1.1.1,
1.1.2.
1.1.3.
1.1.4,
1.1.5.
1.1.6.
1.1.7.
1.1.8.
1.1.9,
1.1.10.
1.2.1.
1.2.2.
1.2.3.
1.2.4.
1.2.5.
1.2.6.
1.2.7.
1.2.8.
°1.3.1,
1.3.2.
1.3.3.
1.3.4,
1.3.5.
14.4,
1.4.2.
1.4.3.
AL
nee
y
“
c
B
c
B:
c
Be
Starch “~ ;
Lacteal «
Peristalsis
Kwashiokor~
Pleura ~~
Nephron”
ATP =",
Lactic acid
Aonly” ,
Both A aiid B
None c-
Both A anid B
B only <=
The pyramid has a very broad base due to high’birth rates,
In the older age group fewer individuals survive ~~
o
Census ‘
ra
Lack of medical'tare/ Low standard of living./ Lack of nutritious food
1.5.1. (i) To investigate whether light is required for photosynthesis.
(if) To investigate whether carbon dioxide is required for photosynthesis. “
1.5.2. To destarch the plant a
1.5.3. To absorb carbon dioxide from within the belljar A
wi .
1.5.4.1, To softenthe tissues/ To break down‘the cell walls. 4° +
Va
1.5.4.2. To extract the chlorophyll vw
/
1.5.4.3, lodine C 4 |
SECTION B “TOTAL SECTIONA, GO
QUESTION 2
C:
244,
Line graphs showing the rate of photosynthesis in 0,03% CO, and 0,13% CQ, at different light intensities
smite
un T1018 % COp
a“ erect e eM OOIS OI CO
0"
Tigntintenally
Rubric for marking of graph
Aspect | Mark
Type of graph: Line graph with both the graphs 1
drawn on the same system of axes
Title for the graph 1
Correct scale for X axis and Y axis 1 j ( ‘
Correct label for x axis and Y axis 1
Graph showing photosynthesis in 0.13% CO2 All7 points plotted and joined : 2
1-6 points plotted and joined: 1
Graph showing photosynthesis in 0.03% CO2 All 7 points plotted and joined : 2
1-6 points plotted and joined: 1
oe é
2.1.2. The rate of photosynthesis is higher'ét CO; concentration of 0.13% than at 0,03%. “” “
For both CO2 concentrations , the rate of photosynthesis increases up to light intensity of 5 and
thereafter levels off. ra
2.1.3. High concentration of CO; in cells increases the acidity and lowers the DH causing the enzymes
controlling the dark phase to become denatured . +“
The reaction rate decreases and the rate of photosynthesis will drop.
|
|
a we
2.2.1.1. E Liver a
, Ww
2.2.1.2. Dw” — Small Intestine
2.2.1.3. A. Stomach ~
2.2.2.1. Fatty ‘acidé ‘and glycerol”
2.2.2.2. Amino acids
2.2.3.1. Pancreas
a
2.2.3.2. When the blood glucose level is raised , organ B/pancreas secretes inulin into the blood. Insulin
decreases the blood glucose levels by converting excess glucose Into glyt6gen which is then
stored in the liver and musclés. It also promotes the absorption of glucose into the body célls.
Cie]
2.3.1. Alcoholic fermentation”
2.3.2.1. Amount of Carbon dioxide / CO2 prodiiéed
2.3.2.2, Temperature a
v
. va
2.3.3. Carbon dioxide’? con” An \
co
2.3.4, Introduce the gas into a test tube containing clear lime water, If the.clear lime water turns
milky/becéries cloudy , then the gas tested for is carbon dioxide 7’ CO,
a
2.3.5. High temperature causes the enzymés controlling the process of anaerobic respiration to become
denatured The reaction rate decreases'résulting In a decrease in the number of bubbles released.
QUESTION 3
nc MOO
3.1.1. Squamous epithelium ©
ea
3.1.2. Red blood iy red blood’ ‘Crpuscle/ Erythrocyte.
e
3.1,3. Itis anucleated/doesn’t have a niécleus making more space available to accommodate riore
haemoglobin to take up more oxygen. “
Itis bi-concave’to increase the surface aréd so that more oxygen can enter/diffuse into the red
blood cell.
a“
It is very flexible and can twist and bend itself out of shdfe to fit into blood capillaries with a
narrower diameter, sloWing down its movement allowing for more time to take up more oxygen.
3.1.4. The blood at A.is deoxygenated/ has a concentration of carbon dioxide while the blood at B is
oxygenated? has a high concentration of oxygen.
3.1.5, The wall of the alveolus is mace up of a single layetof squamous epithelial cells, making it very
thin to promote the rapid diffusion of gases.
The alveolus Is lined with a thin film Wf moisture allowing for oxygen to dissolve before diffusing
The alveolus is pouched/ cup shaped/lobed, increasing the surface area for gas exchange. any 2
A ; a ciel
3.2. The diaphragm contracts and flattens, inergasing t e volume of the thorax from top to bottom.
The external intercostal muscles contracts, causing the ribs/ribeage to be lifted upwards and
outwards,
(
The volume of the thoracic cavity increases ¥ideways/from side to side and from back to Pronk x
Total volume of the thoracic cavity increases and pressure on the lungs (interpleural pressure)
decreases. va
Since atmospheric pressure is now higher than pressure within the lungs, air rusheg“into the lungs Any &
via the nostrils/air is drawn in through the air passages into the lungs. / °
3.3.1.1. Immigration refers to movement.of organisms into ‘an area while emigration refers to
movement of organisms out of an area.
3.3.1.2. Natality refers to the inherent ability of a population to increase incregse in the population
owing to new offspring being added while mortality refers to death ‘of individuals in a a
population A
3.3.2.1, Logistic growth form
3,3,2.2. A—lag or establishment phase a
B- Geometric or logarithmic phase”
C~ Stationary or equilibrium phase va
3.3.2.3, Population is adapting “to the new environment
There are few sexually mature individuals y<*
3.3.2.4. Carrying capacity A ( ,
3.3.2.5. Competition | for food, for space,,for mating partners}
Disease ~
Predation tied
34.1.N=Cx M
}
Wt
Ea
Ed
fea
\
OR
Estimated population
size of crabs = total number of crabs in 2" capture x number of crabs marked in 1"capture
number of marked crabs recaptured in 2"! capture
Pa
a“ Zo
= 36 x 45~
9
= 180% hwy weTtHob (5)
3.4.2. | Some of the crabs may have left the até
Gy Some of the crabs may have died j | %
Estimate is unreliable because only 1 sample ken we ,
3.4.3. The mark must yot harm nor affect the animal’s behavior, movement or acceptance within the
population.
The mark must last for the entire period of investigation .
The population must be a closed population i.e. no immigration or emigration must take place
during the sampling and the count must not take place during the breeding season
Sufficient time must be allowed for the marked animals to mix with the population before the
2" capture ismade. ‘
The chances of the animid being caught must not be affected by the method of capture i.e. they
must not become trap shy or trap addicted.
on) A number of samples should be taken and an average result calculated to reliably estimate the
total population size. w Any 4
Cel
SECTION C
QUESTION 4
Role of the kidney, hypothalamus and pituitary gland on a hot day
On a hot day when the water content of the blood is low, osmoreceptors In the hypothalamus are
. a
stimulated. ~“ . a .
A message is sent,to the pituitary gland which now releases ADH into the bloodstream.
- ADH increasesthe permeability of the cells in the wall of the distal convolutitg tubule and the
collecting tubule.
- More water now leaves the tubule by oynost aa enters the blood in c&fillaries in the medulla.
- The water content of the blood increasés and the urine becomes more concentrated.
Max 9
The structural suitability of the kidneys in carrying out its function (
The afferent vessel is wider than the efferent vessel, causing pressure 6 be built up in the
glomerulus which facilitates the filtration process.
- rodocviee et the Bowman’s capsule and eptiothelial cells of the capillaries form an effective
filtration hembrane allowing only smaltsubstances to pass through.
The cyp-shape of the Bowman’s capsule allows for a close fitting of the glomerulus and a greater
areafor filtration.
Cells of the tubules have brush border / micfovilli which provides a large surface aféa for selective
reabsorption. . J
- The renal tubule is long and convoluted, allowing sufficient time for tubular reabsorption and
excretion.
A large number pf mitochondria are present in the cells of the proximal convoluted tubule which
provide energy‘for active reabsorption to occur,
Max 8
Synthesis: 3
Content: 17
(20)
ASSESSING THE PRESENTATION OF THE ESSAY
Criterion Relevance (R) Logical Sequence (L) Comprehensive (C)
Generally | All information Ideas are arranged ina All aspects of the essay have
provided is relevant to | logical sequence been sufficiently addressed
the question
In this Provided information The description of At least the following marks
essay in relevant only to - The role of the should be obtained:
Qa - Role of the kidneys, - Role of kidneys,
kidneys, hypothalamus and hypothalamus and
hypothalamus and pituitary gland in pituitary gland in
pituitary gland in restoring water restoring water balance
restoring water balance when the when the water content
balance in the water content of the of the blood decreases
blood when the blood decreases. 7/9
water content of - Structural suitability - Structural suitability of
the blood of the kidneys for it the kidneys for its
decreases. function function 6/8
- Structural Are presented in a logical
suitability of the and sequential manner
kidneys to carry
out its function
No relevant
information
Mark 1 1 1
db
ea
Study this subject
Recommended for this subject
Question paper and memo
Life Sciences Grade 11 NSC Prelim 2017 Paper & Memo
Question paper and memo
Life Sciences Grade 11 Paper 3 NSC Prelim 2017 Paper & Memo
Question paper and memo
Life Sciences Grade 11 P1 September Test 2017 Paper & Memo
Memorandum
Life Sciences Grade 11 P1 Eastern Cape November 2017 Memo
Memorandum
Life Sciences Grade 11 P1 Eastern Cape November 2017 Memo
Question paper
Life Sciences Grade 11 P1 NSC Prelim 2022 Question Paper
More from Grade 11 Life Sciences
Annual teaching plan
Gr 11 Life Sci ATP 2023 24
Memorandum
Life Sciences Grade 11 Eastern Cape November 2025 Memo (Afr)
Memorandum
Life Sciences Grade 11 P1 Eastern Cape November 2025 Memo
Question paper
Life Sciences Grade 11 Eastern Cape November 2025 QP (Afr)
Question paper
Life Sciences Grade 11 P2 Eastern Cape November 2025 QP
Memorandum