
Downloaded from hlayiso.com
NELSON MANDELA DISTRICT
GRADE 10
ECONOMICS
01 JUNE 2022
MARKS: 100
TIME: 1.5 hrs
This question paper consists of 10pages.
You're offline
Skip to contentMemorandum %20June%202024%20Possible%20Answers_hlayiso.com_--2e8a22fb-f428-4bd0-8ef5-1d0feef1fa94/v1-5027dac0c665104a0589/card.webp)
%20June%202024%20Possible%20Answers_hlayiso.com_--6510048d-9b76-4cdc-ac94-b3b211d47d8b/v1-52e7289b8d86e1dff0a2/card.webp)
%20June%202023%20Possible%20Answers_hlayiso.com_--11295fb7-f85e-4c3b-a272-dc3b895ef1e0/v1-6af73504f128f579fb3f/card.webp)
%20June%202022%20Possible%20Answers_hlayiso.com_--1b8a91ca-1678-40f0-b46e-4d1f0e139826/v1-d1c56c105652ccf57e8b/card.webp)
%20June%202022%20Possible%20Answers_hlayiso.com_--2fbfaa0f-9b3a-4494-b490-4ccc43257d1e/v1-54308755fd21ae4402bb/card.webp)
%20November%202022%20Possible%20Answers_hlayiso.com_--9de6b3a6-46fe-40a4-8283-c5aa0d0b1912/v1-af38c5608b114b94656b/card.webp)
View all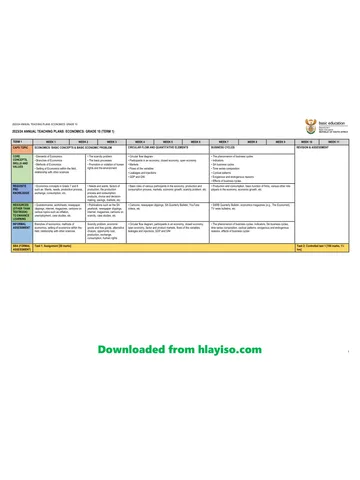
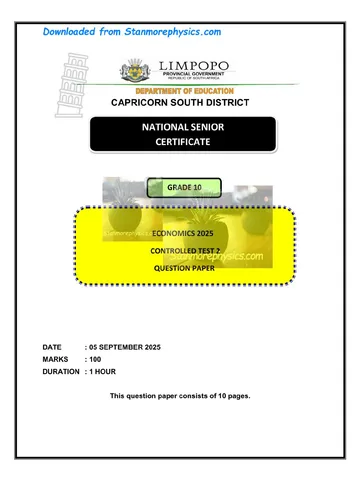
%20June%202024%20Question%20Paper_hlayiso.com_--6c40d10f-82fe-43f3-bea3-c9d464a800ff/v1-a2a9af5a64558783eb27/card.webp)
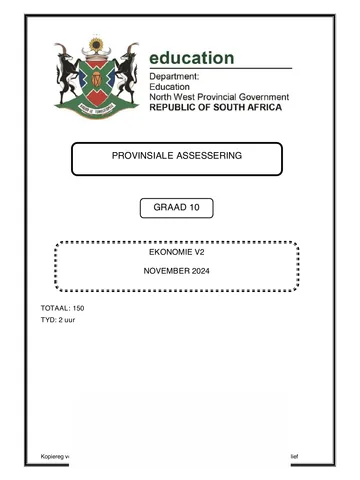
EC-Eco-Gr10-June-2022-QP-_-Memo_hlayiso.com_.pdf
Economics · Grade 10 · Eastern Cape June · 2022. Memorandum, 24 pages. Read online or download the PDF.
- Subject
- Economics
- Grade
- Grade 10
- Document type
- Memorandum
- Year
- 2022
- Exam period
- Eastern Cape June
- Pages
- 24
- File size
- 512.9 KB
Loading document…
Loading document…
1 of 24
Document textSearch extracted text and jump to a page.
Downloaded from hlayiso.com
GRADE 10 ECONOMICS 01 JUNE 2022
INSTRUCTIONS AND INFORMATION
1. Answer THREE questions as follows in the ANSWER BOOK
SECTION A: COMPULSORY
SECTION B: Answer any ONE of the two questions
SECTION C: Answer ONE of the two questions
2. Answer only the required number of questions. Answers in excess of the
required number will NOT be marked.
3. Number the answers correctly according to the numbering system used
in this question paper.
4. Write the question number above each answer.
5. Read the questions carefully.
6. Start EACH question on a NEW page.
7. Leave 2-3 lines between subsections of questions.
8. Answer the questions in full sentences and ensure that the format,
content and context of your responses comply with the cognitive
requirements of the questions.
9. Use only black or blue ink.
10. You may use a non-programmable pocket calculator.
11. Write neatly and legibly
2
Downloaded from hlayiso.com
GRADE 10 ECONOMICS 01 JUNE 2022
SECTION A (COMPULSORY)
QUESTION 1 20 MARKS – 15 MINUTES
1.1 Various options are provided as possible answers to the following questions.
Choose the answer and write only the letter (A–D) next to the question
number (1.1.1–1.1.8) in the ANSWER BOOK, for example 1.1.9 D.
1.1.1 World markets are also known as … markets.
A Collective
B Perfect
C Global
D Local
1.1.2 A complementary product of bread is …
A Flour
B Rice
C Sweets
D Butter
1.1.3 An economy is productively efficient when …
A everyone is wealthy.
B more of one product can only be produced if less of another
product is produced.
C resources are unemployed.
D distribution of income is equal.
1.1.4 As resources are shifted from one industry to another this can be
shown by …
A a movement along the production possibility curve
B an outward shift of the production possibility curve
C a movement of the production possibility curve towards the
origin
D an inward shift of the production possibility curve
1.1.5 Taxes on income and wealth are also known as …
A Indirect
B Spending
C direct
D consumption
(5x2) (10)
3
Downloaded from hlayiso.com
GRADE 10 ECONOMICS 01 JUNE 2022
1.2 Choose a description from COLUMN B that matches an item in COLUMN A.
Write only the letter (A–I) next to the question number (1.2.1–1.2.8) in the
ANSWER BOOK.
COLUMN A COLUMN B
1.2.1 Ceteris paribus A Formulates policies and their
implementation strategies
1.2.2 Oligopoly B Not included in the pricing of goods and
services.
1.2.3 Private cost C Measured in terms of monetary units.
1.2.4 Value D Single supplier producing a unique
product
1.2.5 National government E Few suppliers producing similar or
identical products
1.2.6 Production F All other things remain the same
G A process combining materials to make
something for consumption
(6x 1) (6)
1.3 Give ONE term for each of the following descriptions. Write only the term next
to the question number (1.3.1–1.3.6) in the ANSWER BOOK.
1.3.1 Market where goods and services are bought and sold
1.3.2 Basic economic problem encountered by all economies
1.3.3 Goods provided by the government
1.3.4 A financial grant or gift from the government to encourage the production (4)
of a good or service (4x1)
TOTAL SECTION A: 20
4
Downloaded from hlayiso.com
GRADE 10 ECONOMICS 01 JUNE 2022
SECTION B
Answer any ONE of the two questions from this section in your ANSWER BOOK.
QUESTION 2: MICROECONOMICS 40 MARKS – 30 MINUTES
2.1 Answer the following questions.
2.1.1 Give two factors that determine the existence of a market.(2x1) (2)
2.1.2 What is the effect of scarce resources on producers? (2)
2.2 Study the graph below and answer the questions that follow:
PRICE FORMATION
80
D F
70
60
50
PRICE
40 E
30
20
10 F
D
0
100 200 300 400 500 600 700
QUANTITY
2.2.1 Name the curve labelled F above. (1)
2.2.2 What is the equilibrium price in the diagram above? (1)
2.2.3 Briefly describe the concept demand. (2)
2.2.4 How will the introduction of new and better products in the market affect
the demand curve above? (2)
2.2.5 Calculate the surplus/shortage that will occur when the price is R50.
Show all calculations. (4)
5
Downloaded from hlayiso.com
GRADE 10 ECONOMICS 01 JUNE 2022
2.3 Study the information below and answer the questions that follow.
D
INDIFFERENCE CURVE MAP
2.3.1 Identify the curve labelled B1 above. (1)
2.3.2 How many bananas should one buy to reach maximum
satisfaction? (1)
2.3.3 Briefly describe the concept indifference curve (2)
2.3.4 As a consumer, why would you prefer curve IC2? (2)
2.3.5 How can an indifference curve be used to ensure maximum
satisfaction? (4)
2.4 Discuss unequal distribution of income and externalities as reasons for
market failures. (8)
2.5 Examine the effects of inefficiencies in the economy. (8)
[40]
6
Downloaded from hlayiso.com
GRADE 10 ECONOMICS 01 JUNE 2022
QUESTION 3: MICROECONOMICS40 MARKS – 30 MINUTES
3.1 Answer the following questions.
3.1.1 Name any TWO examples of indirect taxes. (2x1) (2)
3.1.2 What is the purpose of welfare grants? (1x2) (2)
3.2 Study the information below and answer the questions that follow.
POSSIBILITY COMMODITY A COMMODITY B
A 14 0
B 12 10
C 9 18
D 5 25
E 0 30
3.2.1 What is the opportunity cost of increasing production of commodity B
from 10 -18? (1)
3.2.2 If all the factors of production were used to produce commodity B,
how much of it could be produced? (1)
3.2.3 Briefly describe the conceptproduction possibility curve. (2)
3.2.4 What is the effect of an outward shift of the production possibility
curve on the economy? (2)
3.2.5 Use the information from the table above to construct a fully labelled
Production Possibility Curve. (4)
7
Downloaded from hlayiso.com
GRADE 10 ECONOMICS 01 JUNE 2022
3.3 Read the information below and answer the questions that follow.
ILLUSTRATION A
TABLE B
Number of Total utility Marginal utility
burgers
1 38 -
2 48
3 56
4 60
Adapted: Wikipedia
3.3.1 Refer to illustration A and identify the burger that shows marginal
utility. (1)
3.3.2 What do you think is the reason for the difference between the
level of the two thermometers in Illustration A? (1)
3.3.3 Briefly describe the concept utility (2)
3.3.4 Explain the phrase ‘utility is subjective’ (2)
3.3.5 Complete the marginal utility column in table B and explainthe
relationship between total utility and marginal utility. (4)
3.4 Explain theinternal factors which may cause movements of the production
possibility curve (8)
3.5 What are theeffects of an increase in indirect taxes for the economy? (8)
[40]
8
Downloaded from hlayiso.com
GRADE 10 ECONOMICS 01 JUNE 2022
SECTION C
Answer ONE of the two questions from this section in the ANSWER BOOK.
Your answer will be assessed as follows.
STRUCTURE OF ESSAY MARK
ALLOCATION
Introduction
The introduction is a lower-order response.
A good starting point would be to define the main concept related to the
question topic. Max. 2
Do not include any part of the question in your introduction.
Do not repeat any part of the introduction in the body.
Avoid saying in the introduction what you are going to discuss in the body.
Body
Main part: Discuss in detail/In-depth discussion/Examine/Critically discuss/ Max. 26
Analyse/Compare/Evaluate/Distinguish/Differentiate/Explain
Additional part: Give own opinion/Critically discuss/Evaluate/Critically
evaluate/Draw a graph and explain/Use the graph given and explain/
Complete the given graph/Calculate/Deduce/Compare/Explain/Distinguish/
Interpret/Briefly debate/How/Suggest Max. 10
Conclusion
Any higher-order conclusion should include:
A brief summary of what has been discussed without repeating facts
already mentioned
Any opinion or value judgement on the facts discussed Max. 2
Additional support information to strengthen the discussion/analysis
A contradictory viewpoint with motivation, if required
Recommendations
TOTAL 40
QUESTION 4: DYNAMICS OF MARKETS 40 MARKS – 40
MINUTES
Discuss in detail the characteristics of perfect market. (26)
Evaluate the undesirability of a monopolistic market structure with
reference to Eskom.
(10) (10)
[40]
QUESTION 5: PUBLIC SECTOR INTERVENTION 40 MARKS – 40 MINUTES
With the aid of graphs, discuss in detail the following methods of public sector
intervention:
Maximum prices (13)
Minimum prices (13) (26)
Debate arguments in favour of minimum wages (10)
9
0
Downloaded from hlayiso.com
NELSON MANDELA DISTRICT
GRADE 10
ECONOMICS
MARKING GUIDELINE
01 JUNE 2022
MARKS: 100
TIME: 1.5 hrs
This memo consists of 15 pages.
Downloaded from hlayiso.com
SECTION A (COMPULSORY)
QUESTION 1
1.1 20 MARKS – 15 MINUTES
MULTIPLE CHOICE
1.1.1 C - global
1.1.2 D - butter
1.1.3 B - More of one product can only be produced if less of another product is
produced
1.1.4 A – a movement along the production possibility curve
1.1.5 C - direct
1.2 CHOOSE COLUMNS
1.2.1 F All other things remain the same
1.2.2 E Few suppliers producing similar or identical
products
1.2.3 B Not included in the pricing of goods and services
1.2.4 C Measured in terms of monetary units
1.2.5 A Formulates policies and their implementation
strategies
1.2.6 G A process combining material to make something
for consumption
1.3 GIVE CONCEPT
1.3.1 Product /goods market
1.3.2 Scarcity
1.3.3 Public
1.3.4 Subsidy (4x1) (4)
TOTAL SECTION A: 20
Downloaded from hlayiso.com
SECTION B
Answer any ONE of the two questions from this section in your ANSWER BOOK.
QUESTION 2: MICROECONOMICS 40 MARKS – 30 MINUTES
2.1 Answer the following questions.
2.1.1 Give two factors that determine the existence of a market.
• Potential buyer and seller
• A good or service to be sold
• Means to purchase the good or service
• Agreement on prices and quantities/ terms of exchange
(Any 2x1) (2)
2.1.2 What is the effect of scarce resources on producers?
• Scarce resources force producers to choose how to use their
factors of production effectively and efficiently.
• (2)
2.2 DATA RESPONSE
2.2.1 Name the curve labelled F above.
• Supply curve (1)
2.2.2 What is the equilibrium price in the diagram above? (1)
• R40 (1)
2.2.3 Briefly explain the concept demand. (2)
• Demand is the quantity of a good or service that consumers are
willing and able to purchase at a given price with over a specific
period of time.
(Accept any relevant correct response)
2.2.4 How will the introduction of new and better products in the market
affect the demand curve above? (2)
• The demand curve will shift to the left of the original curve.
(Accept any relevant correct response)
Downloaded from hlayiso.com
2.2.5 Calculate the surplus/shortage that will occur when the price is
R50. Show all calculations. (4)
At P = R50, Quantity demanded = 300,
Quantity supplied = 500
Therefore, Surplus = 500 – 300
= 200
(Note: Award one mark for answer only which is positive.)
2.3 DATA RESPONSE
2.3.1 Identify the curve labelled B1 above. (1)
• Budget line.
2.3.2 How many bananas should one buy to reach maximum (1)
satisfaction?
10.
2.3.3 Describe the concept indifference curve. (2)
• It is a curve that shows all the combinations of two products
that will provide the consumer with equal levels of satisfaction
or utility..
2.3.4 As a consumer, why would you prefer curve IC2? (2)
k
Higher indifference curves(IC2) are preferred to lower ones as they
represent larger quantities of the same goods indicating higher levels
of satisfaction.
(Accept any correct relevant response)
Downloaded from hlayiso.com
How can an indifference curve be used to ensure maximum
2.3.5
satisfaction?
Since consumers always prefer higher indifference curves,
• Their choice will be affected by the price of the products and
the available disposable income.
• The consumer may not always be able to afford the
combinations on the highest indifference curve.
• To maximize utility, a consumer chooses a combination of two
goods at which an indifference curve is tangent to the
budget line. .
• Other points are either not attainable or will give a lower level
of satisfaction.
(accept any relevant correct response) (2x2) (4)
2.4 Discuss unequal distribution of income and externalities as reasons for market
failures.
Unequal distribution of income
• This is because workers whose services are in high demand in relation to
supply will earn large incomes and those whose services are not in such high
demand relative to supply will earn far less.
• Some households are excluded from markets due to low of income.
(Accept any other correct relevant response) (Any 2x2)
Externalities
• These are third – party effects such as pollution.
• Businesses that cause the externalities do not bear the cost and it falls to
society at large.
• The price mechanism does not take into account the effects of negative
externalities.
(Accept any other correct relevant response) (Any 2x2)
Downloaded from hlayiso.com
2.5 Examine the effects of inefficiencies in the economy.
Due to inefficiencies resulting from misallocation of resources:
• The economy is producing less than the maximum possible output of
goods and services, from its resources.
• The economy cannot produce the quantity, quality and variety of goods
and services that consumers prefer.
• Consumers are offered fewer goods at higher prices.
• There is lack of innovation, which leads to higher production costs,
inferior products, and less choice for consumers.
• This eventually results in consumer’s standard dropping and the
government has to intervene. (8)
(Accept any correct relevant answer)
QUESTION 3: MICROECONOMICS 40 MARKS – 30 MINUTES
3.1 Answer the following questions.
3.1.1 Name any TWO examples of indirect taxes. )
• Value added tax
• Sin tax
• Excise duty
(2)
(Accept any correct relevant example) (Any 2x1)
3.1.2 What is the purpose of welfare grants?
• The purpose is to supplement the incomes of the poor. (2)
(Accept any correct relevant answer) (1x2)
3.2 DATA RESPONSE
3.2.1 What is the opportunity cost of increasing production of
commodity B from 10 -18?
• It is a decrease of 3 units of commodity A (12-9). (1)
3.2.2 If all the factors of production were used to produce commodity
B, how much of it could be produced?
• 30 (1)
3.2.3 Describe the concept production possibility curve.
Downloaded from hlayiso.com
• Production possibility curve is a graph that shows the
combination of two different goods that could be produced when
using all available scarce resources to the full and efficiently.
(2)
(Accept any relevant correct response)
3.2.4 What is the effect of an outward shift of the production possibility
curve on the economy? –
• it indicates increased production and possibly higher profits..
(accept any correct relevant response) (2)
Downloaded from hlayiso.com
3.2.5 Use the information from the table above to construct a fully
labelled Production Possibility Curve.
PRODUCTION POSSIBILTY CURVE
35
30 PPC
25
COMMODITY B
20
15
10
5
0
0 2 4 6 8 10 12 14 16
COMMODITY A
Mark allocation
Correct shape of PPC = 2 marks
Labelling of axis = 1 mark Max
Labelling on axis = 1 mark 4
Heading = 1 mark
3.3 DATA RESPONSE
3.3.1 Refer to illustration A and identify the burger that shows marginal
utility.
• Burger 2. (1)
3.3.2 What type of consumer goods are burgers?
• Non- durable (1)
3.3.3 Describe the concept utility
• Utility is the ability of a product or service to satisfy a need or
want.
(accept any correct relevant response) (2)
Downloaded from hlayiso.com
3.3.4 Briefly explain the phrase ‘utility is subjective’
• It differs from person to person.
(Accept any correct relevant answer) (2)
3.3.5 Complete the marginal utility column in table B and explain the
relationship between total utility and marginal utility.
Number of Total utility Marginal utility
burgers
1 38 -
10
2 48
8
3 56
Max 2
4
4 60
• As long as total utility is increasing, marginal utility is
decreasing.
• When total utility is maximum, marginal utility is zero.
• When total utility is decreasing, marginal utility is negative.
(max 2) (4)
3.4 Explain the internal factors which may cause movements of the
production possibility curve
These are factors within the business that may cause an increase in the
quantity of a good or service produced. They include:
• Implementing better production techniques such as mechanical
processes in place of manual processes or use of production lines
to improve production lines.
• Implementing new technological advances such as improved
machines that work faster and more accurately.
• Implementing methods to improve use of resources such as
methods to reduce raw material wastage and regular maintenance
of machines.
• Increasing worker productivity and motivation such as intensive
training and payment of incentives.
(Any 4x2) (8)
Downloaded from hlayiso.com
(Accept any other correct relevant answer)
3.5 What are the effects of an increase in indirect taxes for the
economy?
An increase in indirect taxes may have the following positive effects for
the economy:
• An increase in government revenue since indirect taxes(VAT)are
charged to all.
• Reduction in consumption of harmful goods and services such as
when “sin tax” is increased.
• Limiting the impact of imported goods by raising their prices and
therefore encouraging buying of locally produced goods.(import
duties)
An increase in indirect taxes may have the following negative effects for
the economy:
• An increase in the price of goods and service. (VAT)
• Consumers pay more as price increases.
• Firms are selling products at higher prices, but may find that the
profits of the company decrease due to the implementation of the
tax.
• There are fewer products being bought and sold in the economy.
• Employees may lose their jobs since supply has fallen and profits
have dropped.
• (accept any other correct relevant answer)
• (Responses may either be positive or negative) (Any 4x2)
[40]
Downloaded from hlayiso.com
SECTION C
Answer ONE of the two questions from this section in the ANSWER BOOK.
QUESTION 4: DYNAMICS OF MARKETS 40 MARKS – 40 MINUTES
• Discuss in detail the characteristics of perfect markets. (26)
• Evaluate the undesirability of a monopolistic market structure with
[40]
reference to Eskom. (10)
INTRODUCTION
• A market exists wherever buyers and sellers meet to exchange goods
and services at a price.
• A market is any place where buyers and sellers meet in order to
determine the price and quantity of goods or services that will be
exchanged.
(Accept any other relevant introduction)
MAIN PART
Number of buyers and sellers
• There are a large number of buyers and sellers.
• No individual participant can affect the price through their own supply
or demand of goods.
Nature of product
• The goods or services supplied are homogeneous products.
• The products on offer are all more or less the same (identical).
• The goods all serve the same purpose and are often easy to produce.
This results in a large number of suppliers that compete for sales,
which keeps prices low.
Barriers of entry
• Sellers have unrestricted and easy entry and exit into the market.
• Sellers can enter the market at will and they are able to sell their
products just as easily as any other seller will, they can also leave the
market whenever they want to.
Downloaded from hlayiso.com
Information availability
• These markets have perfect or complete information. Buyers know
exactly what each seller’s price is.
• There is also full and complete information available to producers and
consumers about market conditions.
Ability of suppliers to change prices
• The seller has no control over the prices, they are price takers.
• Sellers have to accept the prevailing market price.
• If they increase prices above prevailing market prices, they will not sell
anything.
• No supplier can influence the price in the market. (Max 26)
ADDITIONAL PART
A monopoly like Eskom, is seen as undesirable for several reasons:
• monopoly sets a price higher than in a competitive market, leading to a fall
in consumer surplus.
• the firm is allocatively inefficient because at the quantity it sells, price is
greater than marginal cost.
• secondly, this monopoly is productively inefficient because it is not the
lowest point on the average cost curve.
• a monopoly may lack the incentives to develop new products and offer a
good quality service.
• monopolies make supernormal profit and this can be said to be an
inequitable and unfair distribution of resources in society.
• tend to exploit the consumers because they rely only on the firm for the
product/ service since there are no close substitutes for the product.
• Less employment in the economy, as higher prices lead to lower output and
less need to employ labour.
(Accept any correct relevant answer)
Downloaded from hlayiso.com
QUESTION 5: PUBLIC SECTOR INTERVENTION 40 MARKS – 40 MINUTES
• With the aid of graphs, discuss in detail the following methods of public
sector intervention:
− Maximum prices (13)
− Minimum prices (13) (26)
• Debate arguments in favour of minimum wages.
[40]
INTRODUCTION
Government intervenes in the market to optimise production and the allocation of
resources.
The public sector or government includes all aspects of local, regional and national
government. (2)
(Accept any other suitable introduction)
MAIN PART
Maximum prices
Mark allocation
Correct position and indication of maximum price – 2 marks
Correct indication and labelling of shortage – 2
Labelling of and on axis – 1 mark
Indication of equilibrium point – 1 mark
• A maximum price is set on goods such as basic foods, housing and
transport.
• In South Africa the price of petrol, diesel fuel and paraffin are controlled at
their maximum prices.
• Initially the market equilibrium price is P and equilibrium quantity is Q.
• The government intervenes and passes a law that a certain product such as
milk cannot be sold for more than P1.
• The effect of this maximum price is that quantity supplied decreases to Q1
and quantity demanded increases to Q2.
Downloaded from hlayiso.com
• There is a shortage of the product (milk) equal to the difference between Q1
and Q2.
• A shortage creates a problem of how to allocate the product (milk) to
consumers.
• Black markets often develop where people can obtain the product (milk). (A
black market is an illegal market in which either illegal goods are bought and
sold or illegal prices are charged.)
• Maximum prices may cause a shortage of goods but they do improve the
welfare of some consumers since goods can be purchased at lower prices.
(Sub – max 8)
Minimum prices
Max 5
Mark allocation
Correct position and indication of minimum price – 2 marks
Correct indication and labelling of surplus – 2
Labelling of and on axis – 1 mark
Indication of equilibrium point – 1 mark
• The government sets a minimum price at some point above the market price.
• This is done to enable producers to make a comfortable profit
and thus encourages them to supply important essential goods.
• The market equilibrium price is P and the equilibrium quantity is Q.
• If the government sets a minimum price at P1, suppliers will be earn greater
profits and supply more of the product.
• Quantity supplied will therefore increase to Q2.
• However, quantity demanded will decrease to Q1.
• There would be a surplus of the product equal to the difference between Q2
and Q1.
• A surplus means the government will have to buy the extra wheat and dump
it locally or abroad.
Downloaded from hlayiso.com
• Although minimum prices may cause a surplus they do encourage the supply
of important food stuffs.
(Accept any other correct relevant answer) (Sub max 8)
ADDITIONAL PART
• Increases the standard of living for the poorest and most vulnerable class in
society and raises average income.
• Motivates and encourages employee to work harder.
• Does not have budget consequence on government. "Neither taxes nor
public sector borrowing requirements rise."
• Minimum wage is administratively simple; workers only need to report
violations of wages less than minimum, minimizing a need for a large
enforcement agency.
• Stimulates consumption, by putting more money in the hands of low-income
people who spend their entire income.
• Increases the work ethic of those who earn very little, as employers demand
more return from the higher cost of hiring these employees.
• Decreases the cost of government social welfare programs by increasing
incomes for the lowest-paid.
• Does not have a substantial effect on unemployment compared to most other
economic factors, and so does not put any extra pressure on welfare
systems.
(Accept any other correct relevant answer)
TOTAL SECTION C: 40
GRAND TOTAL: 100
Recommended for this subject
Published documents with matching subject and grade metadata.
Memorandum
Gr 10 Economics P1 (Afrikaans) June 2024 Possible Answers_hlayiso.com_.pdf
Memorandum
Gr 10 Economics P1 (English) June 2024 Possible Answers_hlayiso.com_.pdf
Memorandum
Gr 10 Economics P2 (Afrikaans) June 2024 Possible Answers_hlayiso.com_.pdf
Memorandum
Gr 10 ECO P2 (Afrikaans) June 2023 Possible Answers_hlayiso.com_.pdf
Memorandum
Gr 10 ECO P2 (English) June 2023 Possible Answers_hlayiso.com_.pdf
Memorandum
Gr 10 Economics P1 (Afrikaans) 2023 Possible Answers_hlayiso.com_.pdf
Related documents
Matched using subject, grade, language, document type and exam metadata.
Memorandum
Gr10 EC P1 (ENG) June 2022 Possible Answers_hlayiso.com_.pdf
Memorandum
Gr10 EC P2 (AFR) June 2022 Possible Answers_hlayiso.com_.pdf
Memorandum
Gr10 EC P2 (ENG) June 2022 Possible Answers_hlayiso.com_.pdf
Memorandum
Gr 10 Economics P1 (Afrikaans) November 2022 Possible Answers_hlayiso.com_.pdf
Memorandum
Gr 10 Economics P2 (Afrikaans) November 2022 Possible Answers_hlayiso.com_.pdf
Memorandum
Gr 10 Economics P2 (English) November 2022 Possible Answers_hlayiso.com_.pdf
More from Grade 10 Economics
Explore more published documents in this catalogue.
Annual teaching plan
Gr 10 Eco ATP 2023-24.pdf
Question paper and memo
LP-SS-Economics-Grade-10-September2025-QP-and-Memo.pdf
Question paper
Gr 10 Economics P2 (Afrikaans) June 2024 Question Paper_hlayiso.com_.pdf
Question paper
Gr 10 Economics P2 (English) June 2024 Question Paper_hlayiso.com_.pdf
Question paper and memo
KZN-Economics-Grade-10-March-2024-QP-and-Memo_hlayiso.com_.pdf
Question paper