
Downloaded from hlayiso.com
PREPARATORY EXAMINATION
2024
MARKING GUIDELINES
GEOGRAPHY (PAPER 2) (10782)
24 pages
Skip to contentAll 2024 papers 
View all
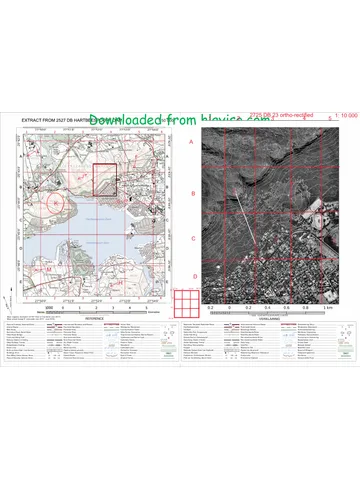

Geography Grade 12 P2 Gauteng Prelim 2024 Memo (English)
Grade 12 Geography Paper 2 memorandum from the Gauteng Prelim Exam 2024 (English), 29 pages. Read online or download the free PDF.
Geography · Grade 12 · Gauteng Prelim Exam · 2024 · English. Memorandum, 29 pages. Read online or download the PDF.
- Subject
- Geography
- Grade
- Grade 12
- Language
- English
- Document type
- Memorandum
- Year
- 2024
- Exam period
- Gauteng Prelim Exam
- Paper
- 2
- Curriculum
- CAPS
- Pages
- 29
- File size
- 1.8 MB
Free to read online, no sign-up needed
Loading document…
Loading document…
1 of 29
This exam
Gauteng Prelim Exam 2024
Questions in this paper
- Question 1.1Rural and urban settlements8 marks
- Question 1.2Rural and urban settlements7 marks
- Question 1.3Rural and urban settlements15 marks
- Question 1.4Rural and urban settlements15 marks
- Question 1.5Rural and urban settlements15 marks
- Question 2.1Economic geography of South Africa7 marks
Show all 13 questions
Document textSearch extracted text and jump to a page.
Downloaded from hlayiso.com
10782/24
PRINCIPLES FOR MARKING GEOGRAPHY – 2024
The following marking principles are developed to standardise marking processes.
MARKING
• ALL questions MUST be marked, irrespective of whether it is correct or incorrect.
• Where the maximum marks have been allocated for a particular question, place an M
over the remainder of the text to indicate the maximum marks have been achieved.
• A clear, neat tick must be used:
o If ONE mark is allocated, ONE tick must be used.
o If TWO marks are allocated, TWO ticks must be used.
o The tick must be placed at the FACT that a mark is being allocated for.
o Ticks must be kept SMALL, as various layers of moderation may take place.
• Incorrect answers must be marked with a clear, neat cross: X.
o Use MORE than one cross across a paragraph/discussion style questions to indicate
that all facts have been considered.
o Do NOT draw a line through an incorrect answer.
o Do NOT underline the incorrect facts.
NOTE THE FOLLOWING
• If the numbering is incorrect or left out, as long as the sequence of answers to questions
is followed candidates can be credited.
• Spelling errors if the word is recognisable, award the marks provided the meaning is
correct.
• Be sensitive to the sense of an answer, which may be stated in a different way
• In questions where a letter is the accepted response, but the learner writes the actual
answer- award marks.
TOTALLING AND TRANSFERRING OF MARKS
• Each sub-question must be totalled
o Questions in Section A has five subsections, therefore five subtotals per question
is required. Section B has three subsections and three subtotals.
o Subsection totals to be written in the right-hand margin at the end of the
subsection.
o Subtotals must be written legibly.
o Leave space to write in the moderated marks on different levels.
• Total subtotals and transfer totals to top left-hand margin next to the question number
• Transfer the total to cover of answer book.
2
Downloaded from hlayiso.com
10782/24
MODERATION
Marking on each level of moderation is done in the same way as the initial marking. All
guidelines for marking must be adhered to.
If a mark for a subquestion is changed after moderation, the moderator must strike through
the marker's mark and write down the new mark. 12 16
The total for the question must be recalculated, and similarly be struck off and the new total
must be written down. 26 36
QUESTION 1 22
1.1 1.1.1 A (South Atlantic High)
1.1.2 B (Kalahari High)
1.1.3 B (South Indian) X 2
1.2 1.2.1 Melting snow
1.2.2 Mouth X
1.2.3 Third order 2
1.3 1.3.1 Katabatic X
1.3.2 1 occurs during the day while 2 occurs at night
1.3.3 Cold air rolls down into the valley and forms an inversion
Air flows downslope
6
1.4 1.4.1 Shape of front concave
Steep gradient of front
1.4.2 Warm air undercuts the cold air
1.4.3 Air behind the cold front is colder than the air in front. Cold air moves
faster than warm air ahead of it. Cold front catches up with the warm front. 5
3
Downloaded from hlayiso.com
10782/24
1.5 1.5.1 (a) A river that only flows all year-round X
(b) The river channel is wide X
(c) Regularity of rainfall and the soil type over which the streams
flow.
1.5.2 Gauteng and the Eastern Cape X
1.5.3 The cost of food production will increase at it is costly to buy purified water.
Farmers will have to buy more chemicals to purify water. Chemicals cost
a lot, and this will increase production costs M . It will be costly to purify
water for use in electricity generation. These costs will be in electricity
prices. Costs will increase the price of electricity during production. There
will be less clean water to generate hydro-electricity. 7
SECTION A: RURAL AND URBAN SETTLEMENTS AND ECONOMIC GEOGRAPHY
OF SOUTH AFRICA
QUESTION 1: RURAL AND URBAN SETTLEMENTS
1.1 1.1.1 B (1)/dispersed
1.1.2 B (1)/crossroad
1.1.3 D (1)/road
1.1.4 C (1)
1.1.5 B (1)
1.1.6 A (1)/aspect
1.1.7 B (1)/the increasing percentage of the total population living in
urban areas.
1.1.8 C (1)/rural areas
(8 x 1) (8)
1.2 1.2.1 Y (1) / Specialised town
1.2.2 Z (1) / Break of bulk town
1.2.3 Y (1) / Gap town
1.2.4 Z (1) / Central place town
1.2.5 Y (1) / Junction town
1.2.6 Z (1) / Specialised town
1.2.7 Z (1) / Trade and transport (7 x 1) (7)
4
Downloaded from hlayiso.com
10782/24
1.3 Refer to the infographic below on land reform in South Africa.
LAND REDISTRIBUTION CAN CREATE NEW JOBS IN AGRICULTURE IN SOUTH
AFRICA
Land reform is necessary in post-apartheid South Africa to help address inherited
historical injustices, especially those resulting from the land dispossession of the black
majority. It involves the restitution of land to individuals and communities who lost their
homes and land due to forced removals. It also creates secure rights to land held by the
black majority. In addition, the process aims to create a more equitable pattern of land
ownership.
[Source: https://mg.co.za/news/2020-06-08-study-shows-land-redistribution-can-create-new-jobs-
in-agriculture-in-south-africa/]
[Source: https://www.landreformfutures.org/
1.3.1 Define the term land redistribution. (1 x 2) (2)
Land redistribution seeks to provide the disadvantaged and the poor
with access to land for residential and productive purposes. (2)
[CONCEPT]
1.3.2 Quote from the passage above why land reform is necessary in post-
apartheid South Africa. (1 x 1) (1)
“to help address inherited historical injustices, especially those
resulting from the land dispossession of the black majority.” (1)
1.3.3 State an advantage of land reform, evident in the image. (1 x 2) (2)
It creates job opportunities (2)
Land is used productively/for farming (2)
Improves quality of life (proper housing) (2)
[ANY ONE]
5
Downloaded from hlayiso.com
10782/24
1.3.4 Suggest challenges experienced in the implementation of land reform in
South Africa. (2 x 2) (4)
Bureaucratic delays, e.g political interference (2)
Patronage can cause delays (2)
Political influence can cause delays (2)
Opportunism among beneficiaries and landowners (2)
Lack of education of the prospective farmers (2)
Lack of farming knowledge for prospective farmers (2)
The process of land reform takes time (2)
Willing buyer and unwilling seller causing a delay (2)
Disputes over the land value (2)
Corruption in terms of the processes to be followed (2)
Lack of funds from government (2)
Disagreement between the government and traditional (community)
leaders (2)
No proper records at the land registry (2)
Gaps in the land reform policies (2)
[ANY TWO]
1.3.5 Explain the positive impact of land reform on rural communities in South
Africa. (3 x 2) (6)
Reduces poverty in rural areas as people can plant seeds for
food (2)
Opportunities to create commercially based farming in the rural
areas (2)
Job creation in rural areas (2)
Access to water and food (2)
Income for rural communities to improve their standard of living (2)
Ownership of land – sense of pride/ownership
Encourages infrastructure development (accept examples)
Reduces rural-urban migration (2)
[ANY THREE]
6
Downloaded from hlayiso.com
10782/24
1.4 Refer to the Diagram below on land-use zones.
PARKERVILLE CITY
Shopping mall Heavy industry
Powerstation
road
railway line
road
Middle income
residential
High income
residential TRANSITION ZONE
river
Golf course
road
Light Low income housing
road
railway line
Airport
[Source: Examiner's own sketch]
1.4.1 Identify the land-use zone indicated by A in the diagram. (1 x 1) (1)
CBD/Central business district (1)
1.4.2 Provide evidence from the sketch to support your answer to
QUESTION 1.4.1. (1 x 2) (2)
The CBD is centrally located/located in the middle of the urban area
(2)
All roads lead to the CBD as it is the most accessible area (2)
It is located next to the transition zone (2)
[ANY ONE]
1.4.3 Identify a commercial activity in Parkerville City that has been
decentralised. (1 x 2) (2)
The shopping mall (2)
7
Downloaded from hlayiso.com
10782/24
1.4.4 Explain why the activity mentioned in QUESTION 1.4.3 has been
decentralised. (1 x 2) (2)
It is located next to a road for easy access (2)
Less traffic congestion which saves more time (2)
Close to the customer therefore they save time (2)
Cheaper land values/rental as it is a large building (2)
More space for parking because it attracts more customers / pleasant
experience (2)
Less crime in the suburban areas as crime is higher in the CBD (2)
Less pollution in the suburban areas which will attract more
customers (2)
[ANY ONE]
1.4.5 The land-use model depicted in the sketch above closely resembles the
(Multiple nuclei/Third World City). (1 x 2) (2)
Multiple Nuclei (2)
1.4.6 Give a reason for your answer to QUESTION 1.4.5. (1 x 2) (2)
Different nodes/centres exists (accept examples) (2)
Some clustering exists because some sectors tend to stay away from
other sectors (2)/industry not next to high income housing.
Evidence of decentralisation (2)
[ANY ONE]
1.4.7 Discuss TWO factors, evident on the diagram, that influenced the location
of the high-income residential zone. (2 x 2) (4)
Close to the river for aesthetical reasons (2)
Close to a shopping mall (2)
Close access to roads (2)
Located away from the CBD due to traffic congestion (2)
Located away from the heavy industries/pollution (2)
Located next to the golf course (2)
[ANY TWO]
8
Downloaded from hlayiso.com
10782/24
1.5 Refer to the article on service delivery in urban areas.
BASIC WATER SERVICES IN SOUTH AFRICA ARE IN DECAY AFTER YEARS
OF PROGRESS
The water situation in South Africa has deteriorated. The reliability of water
services and infrastructure as shown by frequent water supply interruptions, has
been on a downward trend.
The deterioration of the country’s water infrastructure and the actual delivery of a
reliable and safe water supply can be attributed to under-investment in
infrastructure maintenance and delays in the renewal of old infrastructure. Other
contributing factors include poor management, limited budgets, poor revenue
management by local municipalities, misappropriation of funds, and a lack of
capacity or necessary technical skills related to water services and sanitation
operation and maintenance.
[Source: https://theconversation.com/basic-water-services-in-south-africa-are-in-decay-after-
years-of-progress-185616]
1.5.1 Why is water supply in urban areas seen as an injustice? (1 x 2) (2)
Not all people have access to water supply (2)
1.5.2 Identify a reason, from the passage for the deterioration of the country’s
water infrastructure and actual delivery of reliable and safe water. (1 x 1) (1)
Under-investment in infrastructure maintenance (1)
Delays in the renewal of old infrastructure (1)
Poor management (1)
Limited budgets (1)
Poor revenue management by local municipalities (1)
Misappropriation of funds (1)
Lack of capacity or necessary technical skills (1)
[ANY ONE]
1.5.3 Explain how urbanisation contributes to the poor water supply in urban
areas. (1 x 2) (2)
The provision of infrastructure for water supply is slower than the
rate at which population numbers increase (2)
1.5.4 Describe the social impact of poor water supply in urban areas. (1 x 2) (2)
Overcrowded communal water taps (2)
Community conflict (2)
Dangerous borehole installations (2)
Desperate acceptance of contaminated groundwater sources (2)
Loss of lives of people (2)
Spread of water borne illnesses (2)
Dehydration of people (2)
Negative impact on domestic activities (accept examples) (2)
[ANY ONE]
9
Downloaded from hlayiso.com
10782/24
10
Downloaded from hlayiso.com
10782/24
1.5.5 In a paragraph of approximately EIGHT lines, suggest how local
municipalities can avoid a major water crisis and improve water security.
(4 x 2) (8)
Safe/Clean water campaigns (education of local communities) (2)
Address inefficient water use and wastage (2)
Fines for inefficient water use and wastage (2)
Conduct more research regarding the impact of extreme weather
events and climate change on the country’s water resources (2)
Invest in infrastructure development (accept examples-link to water
supply) (2)
Regular maintenance of existing water infrastructure (2)
Address deficient management systems and record-keeping (2)
Develop and implement an institutional and regulatory framework
and ensure compliance with existing regulatory frameworks (2)
The capacity of key national government departments and
municipalities needs to be evaluated in an objective manner (2)
Allocate more funds in the budget to improve access to water (2)
Employ skilled officials (competent personel) to ensure better service
delivery/maintain water infrastructure (2)
Promote accountability amongs officials (2)
Provide Jo-Jo tanks / water tankers (2)
Implementation of water restrictions (2)
[ANY FOUR]
[60]
QUESTION 2: ECONOMIC GEOGRAPHY
2.1 Match each type of industry in the diagram below with the descriptions that follow.
Write only the letter (A – G) next to the question number (2.1.1 to 2.1.7) in the ANSWER
BOOK, e.g. 2.1.8 H.
2.1.1 G / (Storage of oil) (1)
2.1.2 C / (Internet) (1)
2.1.3 B / (Microchip industry) (1)
2.1.4 D / E / (Frozen foods) / (Milk factory) (1)
2.1.5 A / E / (Paper mill) / (Milk factory)(1)
2.1.6 A / F / (Paper mill) / Power station (1)
2.1.7 D / E (Frozen foods) / (Milk factory) (1)
(7 x 1) (7)
11
Downloaded from hlayiso.com
10782/24
2.2 Refer to the infographic below on coal mining in South Africa.
Various options are provided as possible answers to the following questions.
Choose the answer and write only the letter (A – D) next to the question numbers
(2.2.1 to 2.2.8) in the ANSWER BOOK, e.g., 2.2.9 A.
2.2.1 C/Limpopo (1)
2.2.2 A/(i) and (iii) (1)
2.2.3 A/primary (1)
2.2.4 B/25 (1)
2.2.5 B/Higher prices lead to increased GDP, while lower prices reduces
the GDP (1)
2.2.6 B/coal reserves are near the surface (1)
2.2.7 A/Electricity (1)
2.2.8 A/Stimulates economic growth in surrounding areas (1)
(8 x 1) (8)
12
Downloaded from hlayiso.com
10782/24
2.3 Refer to the infographic below showing information about Karan Beef and
answer the questions that follow.
KARAN BEEF IN SOUTH AFRICA
Our cattle feedlots are located at BEEF SHIPMENTS
the Heidelberg, Nigel, and Albert Karan Beef exports in a year
Falls cattle farms. The
Heidelberg farm is the largest
Kilograms
feedlot in the world at 2 330
hectares.
Jordan Egypt
Countries
Heidelberg and Nigel
Albert falls
[Source: https://www.karanbeef.com/]
2.3.1 (a) Name TWO provinces in which Karan Beef is located.
Gauteng (1)
KwaZulu-Natal (1) (2 x 1) (2)
13
Downloaded from hlayiso.com
10782/24
(b) Identify ONE climatological factor that favours beef farming in the
provinces identified in QUESTION 2.3.1 (a) (1 x 2) (2)
Warmer temperatures. (2)
Sufficient rainfall. (2)
The temperate climate of South Africa is generally conducive to
cattle well-being. (2)
[ANY ONE]
2.3.2 According to the graph, how many kilograms of beef does Karan Beef
export to China? (1 x 1) (1)
4 000 000 (million) (1) kg
2.3.3 Explain how drought conditions will negatively impact beef exports.
(2 x 2 (4)
Drought can lead to farmers slaughtering/culling livestock, therefore
decreasing the quantity and quality of goods available for export. (2)
Export markets often demand high-quality products, and if drought
reduces the quality of goods available for export, it can lead to
decreased demand and lower prices on the international market. (2)
Drought can increase production costs for farmer's prices may need to
be raised to cover the additional expenses. (2)
In response to domestic food shortages caused by drought,
governments may impose trade restrictions on exports to ensure an
adequate domestic supply. (2)
[ANY TWO]
14
Downloaded from hlayiso.com
10782/24
2.3.4 Discuss the social and economic impact of beef production in South Africa.
(3 x 2) (6)
SOCIAL FACTORS:
Beef production provides employment opportunities for a diverse
range of people.
Cattle are often regarded as symbols of wealth, status, and
heritage. (2)
Beef production can foster social cohesion and community solidarity
by bringing people together for shared activities and mutual
support. (2)
Beef production plays a role in enhancing food security by providing
a domestic source of meat for consumption, particularly in rural areas
where access to alternative protein sources may be limited. (2)
ECONOMIC FACTORS:
Beef production increases the availability of locally produced meat,
adding to the domestic meat supply. (2)
A stable and diversified domestic meat supply reduces the risk of
shortages caused by external factors like global market fluctuations
or supply chain disruptions. (2)
By producing high-quality beef domestically, South Africa can
decrease its dependence on meat imports. (2)
Reliance on imports exposes the country to potential price
fluctuations and supply chain vulnerabilities in the international
market. (2)
Relying on imports can sometimes lead to fluctuating meat prices due
to global market dynamics and transportation costs. (2)
Domestic production, (such as Karan beef), contributes to price
stability
Domestic production, (such as Karan beef), contributes to
affordability for consumers. (2)
When local production is strong, it can help regulate prices, making
meat more accessible to a broader segment of the population. (2)
Reducing meat imports through increased domestic production can
contribute to narrowing trade imbalances. (2)
Importing less meat means fewer financial resources leaving the
country and can potentially result in a more favourable trade
balance. (2)
Strengthening domestic meat production, (including Karan beef),
supports local farmers, producers, and the broader agricultural
sector. (2)
Leads to increased employment, rural development, and improved
livelihoods for those involved in the beef value chain. (2)
Contribute to the GDP (2)
Earning foreign exchange (2)
Add value to the land (2)
POSSIBLE NEGATIVE IMPACTS:
Spread of diseases will reduce production (2)
15
Downloaded from hlayiso.com
10782/24
More and more land is used for commercial farmers pushing out
subsistence farmers – no food for subsistence farmer – more poverty
(2)
(Learners must have at least ONE social and ONE economic factor)
[ANY THREE]
16
Downloaded from hlayiso.com
10782/24
2.4 Study the image and article below on Saldanha Bay’s IDZ and answer the questions
that follow.
SALDANHA BAY’S IDZ HAS ATTRACTED MORE THAN R3 BILLION IN
INVESTMENTS.
Investment agreements in the Saldanha Bay Industrial Development Zone (IDZ) totals
over R3bn. The economy of the Saldanha Bay IDZ is based on the manufacturing
industry, agricultural/fishing industry, tourism industry, and harbour industries. Land-based
and some marine infrastructures are established, and collaboration with Transnet for
additional port facilities is underway. The investments are seen as fostering industrial
value chains and promoting local economic growth.
[Source: Adapted from https://www.businesslive.co.za/bd/national/2019-02-19-saldanha-bays-idz--has-
attracted-more-than-r3bn-in-investments/#google_vignette]
2.4.1 Define the term Industrial Development Zone. (1 x 2) (2)
IDZs are purpose-built industrial estates to support exports. They
provide transport, logistics and business services tailored for export-
oriented industries. (2)
[CONCEPT]
17
Downloaded from hlayiso.com
10782/24
2.4.2 With reference to the image, identify the infrastructure that has developed
due to the economic activities in Saldanha Bay IDZ. (1 x 2) (2)
Roads (2)
Harbours (2)
Houses/buildings (2)
Powerline (2)
[ANY ONE]
2.4.3 According to the source identify ONE industrial activity in the Saldanha
Bay IDZ. (1 x 1) (1)
Manufacturing industry (1)
Agricultural/fishing industry (1)
Tourism industry (1)
Harbour industries (1)
[ANY ONE]
2.4.4 Discuss factors favouring the development of the Saldanha Bay IDZ.
(2 x 2) (4)
Saldanha Bay is located on the west coast of South Africa, providing
easy access to international shipping routes and markets. (2)
The deep-water port facilitates the import and export of bulk
commodities such as iron ore, coal, and agricultural products,
making it attractive for industries reliant on maritime
transportation. (2)
The region surrounding Saldanha Bay has abundant mineral
resources, particularly iron ore. (2)
The establishment of the Saldanha Bay IDZ is supported by existing
industrial infrastructure, including port facilities, transportation
networks, and utilities such as electricity (alternative sources) and
water supply. (2)
Fast and availability of flat land (2)
Availability of labour supply (skilled and unskilled) (2)
[ANY TWO]
2.4.5 Explain how the Saldanha Bay IDZ impacts local communities.
(3 x 2) (6)
The development of industrial activities within the IDZ can generate
jobs across various sectors. (2)
The Saldanha Bay IDZ can reduce unemployment rates and increase
household incomes. (2)
Improving the quality of life for residents. (2)
The establishment of industrial facilities and the influx of businesses
into the Saldanha Bay IDZ can create demand for skilled labour. (2)
Provide basic services/improve access to basic services. (2)
18
Downloaded from hlayiso.com
10782/24
Improve/Develop infrastructure. (2)
Skills development/training / bursaries. (2)
NEGATIVE IMPACTS
Pollution (land/air/water) due to influx of people (2)
Overcrowding due to influx of people / traffic congestion (2)
Exploitation of resources (2)
Land degradation (2)
[ANY THREE]
2.5 Refer to the infographic below on the informal sector in an industrial area.
In the PWV region, 52,6% of the economically
active population is employed, with 77% in
the formal sector. The financial sector leads at
26,1%, followed by trade and retail at 22%.
Community services employ 17%, while
agriculture represents only 0,6%. Additionally,
3,8% work in the growing informal sector,
notably in trade and self-employment.
[Source: https://www.statssa.gov.za/publications/P0211/P02112ndQuarter2022.pdf,
https://www.cfr.org/blog/south-africas-unemployment-grows and
https://link.springer.com/article/10.1007/s11356-019-07104-8]
2.5.1 Identify the industrial region shown in the infographic. (1 x 1) (1)
The PWV/Pretoria Witwatersrand Vereeniging (1)
2.5.2 According to the infographic, how many people are currently employed
in the informal sector? (1 x 1) (1)
19
Downloaded from hlayiso.com
10782/24
3,8% (1)
2.5.3 Which employment sector of the industrial region mentioned in
QUESTION 2.5.1, employs the most people? (1 x 1) (1)
Finance (1)
20
Downloaded from hlayiso.com
10782/24
2.5.4 Give TWO examples of jobs, in the informal sector that are displayed in
the infographic. (2 x 1) (2)
Builder (1) Electrician (1)
Painter (1) Plumber (1)
Welder (1) Plaster (1)
Tiler (1)
[ANY TWO]
2.5.5 How can the informal sector help to reduce the unemployment rate in
the industrial region mentioned in QUESTION 2.5.1? (1 x 2) (2)
The informal sector is easier to enter compared to the formal
sector, allowing individuals to start businesses with minimal
capital (2)
The informal sector is easier to enter compared to the formal
sector, allowing individuals to start businesses with formal
qualifications. (2)
The informal sector encourages entrepreneurship and self-
employment by empowering individuals to start their businesses
and become economically self-reliant. (2)
People who start their own businesses reduce their dependency
on formal employment opportunities (2)
Provides alternative avenues for income generation. (2)
The informal sector is known for its flexibility and adaptability to
changing economic conditions and market demands. (2)
Informal businesses may also offer flexible working arrangements
and informal training opportunities, enhancing the employability of
workers in the PWV region. (2)
[ANY ONE]
2.5.6 In a paragraph of approximately EIGHT lines, discuss factors favouring
the economic development of the industrial region mentioned in the
infographic. (4 x 2) (8)
Great variety and large amount of raw materials. (2)
A good transport network (road, rail and air) in PWV. (2)
Well linked to other regions of South Africa. (2)
Well linked to harbours. (2)
Markets across the country (Well linked to other parts of South
Africa). (2)
Closest core industrial region to markets in the rest of Africa. (2)
International markets are the largest in South Africa. (2)
Has skilled and unskilled labour available. (2)
It has the largest population (of all the core industrial regions). (2)
Sufficient and relatively cheaper electricity supply. (2)
Large power stations are located in PWV, and coal mines are close
by (large coal mines in Mpumalanga) (2)
Sufficient water supply. (Water supply supplemented by water
projects e.g. TUGELA project) (2)
Has many tertiary education institutions (skills development) (2)
Relatively flat land (easier construction of industries) (2)
[ANY FOUR]
[60]
21
Downloaded from hlayiso.com
10782/24
TOTAL SECTION A: 120
22
Downloaded from hlayiso.com
10782/24
SECTION B
QUESTION 3: GEOGRAPHICAL SKILLS AND TECHNIQUES
GENERAL INFORMATION ON VANRHYNSDORP (VREDENDAL)
Vanrhynsdorp
Vredendal
Coordinates: 31° 39' 3.6" S; 18° 29' 9.6" E
Vredendal is a town in the northern Olifants River Valley in the Western Cape province of South Africa. It
lies 250 kilometres north of Cape Town and 205 km from the nearest harbour at Saldanha Bay.
Vredendal is connected to the N7 national road by the R362 and R363 roads. Additionaly, Vredendal is
served by the West Coast railway line which runs from Cape Town to Bitterfontein. Vredendal with its
developed infrastructure, is home to the largest wine cellar in South Africa, as well as a number of
boutique wineries and a dried fruit depot. Furthermore Vredendal is known for the following agricultural
products such as grapes, potatoes, tomatoes, onions, pumpkins, watermelons, and sweet melons.
[Source: Adapted from https://en.wikipedia.org/wiki/Vredendal]
The following English terms and their Afrikaans translations are shown on the topographic
map:
ENGLISH AFRIKAANS
Thorn swamp Doringvlei
Middel farm Middelplaas
River Rivier
23
Downloaded from hlayiso.com
10782/24
3.1 MAP SKILLS AND CALCULATIONS
Refer to the topographic map and the orthophoto map.
3.1.1 What is the name of the closest harbour to Vredendal? (1 x 1) (1)
Saldanha Bay (1)
3.1.2 Of which Spatial Development Initiative (SDI) does the town Vredendal form
part?
A West Coast
B Maputo corridor
C Wild Coast
D Fish river (1 x 1) (1)
A (1)/West Coast
3.1.3 Vredendal is connected to the National Road (N7) by the …
A R361 and R362 roads.
B R362 and R363 roads.
C railway and R361.
D National road 1 and R361. (1 x 1) (1)
B (1) R362 and R363 roads
3.1.4 Refer to the topographical map.
Identify the land-use located at 31° 38’ 24’’S 18° 31’ 19’’E. (2)
Cemetery (2)/Graveyard (2)
[ANY ONE]
3.1.5 (a) Calculate the average gradient between spot ∆167 in block A1 and ∆
217 in block A4 on the topographical map.
Use the following information:
Vertical interval: 110,8 m – 95,9 M
= 14,9 m
Formula: Vertical Interval (VI)
Horisontal equivalent (HE) (3 x 1) (3)
HE = 9,1 cm x 500 = 4 550 m (1) (range 4 500 m – 4 600 m) (range 9 cm –
9,2 cm)
= 14,9 m (1) for substitution
4 550 m
1:305,37 (1)
(range 1 : 302,01 – 1 : 308,72)
24
Downloaded from hlayiso.com
10782/24
(b) How does your answer in QUESTION 3.1.5 (a) favour the location of the
landing strip in block A3, on the topographical map? (1 x 2) (2)
The gradient is gentle (2)
3.2 MAP INTERPRETATION
Refer to the topographical map
3.2.1 (a) Name the street pattern at X in Block A2, on the topographical map
(1 x 1) (1)
Planned irregular (1)
(b) Provide evidence from the topographic map that supports the
construction of the street pattern mentioned in QUESTION 3.2.1 (a).
(1 x 2) (2)
All the roads do not look the same (no discernable (specific)
pattern). (2)
Makes the area look attractive (for aesthetic reasons). (2)
Fewer intersections. (2)
Safer to travel as there are fewer intersections and cul de sac. (2)
Gentle gradient. (2)
Different sizes of the plots (2)
[ANY ONE]
3.2.2 Refer to the Sewage Works, 1, in Block B4, on the orthophoto map and in block
B3, on the topographic map.
(a) Why does this land-use appear larger on the orthophoto than the
topographical map? (1 x 2) (2)
The scale of the orthophoto map is (5 times) larger than the
topographic map. (2)
The scale of the topographic map is (5 times) smaller than the
orthophoto map. (2)
[ANY ONE]
(b) In which land-use zone is the sewage works located? (1 x 1) (1)
Rural-Urban fringe. (1)
(c) Provide evidence from the topographical map to support the statement
that the sewage works is ideally located. (1 x 2) (2)
Located far from built-up area (2)
Bad odours will not affect the local residents (2)
Enough space for expansion (2)
Land is cheaper (2)
Flat area (2)
[ANY ONE]
25
Downloaded from hlayiso.com
10782/24
26
Downloaded from hlayiso.com
10782/24
Refer to the photograph below showing the Vredendal Solar Power Park in block A1 on
the topographical map.
Vredendal Solar
Power Park
[Source: Google Earth]
3.2.3 (a) What are the factors making solar power production possible in this
area? (1 x 2) (2)
Large space for the solar panels (2)
Flat land for expansion (2)
Cheaper construction (2)
Enough sunshine in the area (2)
[ANY ONE]
(b) Suggest an economic advantage of the Solar Power Park
to the businesses in Vredendal. (1 x 2) (2)
Cheaper supply of electricity (2)
Minimum loadshedding/reduces the impact of loadshedding (2)
Increase in profit margin (2)
No dependence on the national power grid (ESKOM) (2)
Increased production (2)
[ANY ONE]
27
Downloaded from hlayiso.com
10782/24
3.3 GEOGRAPHIC INFORMATION SYSTEMS (GIS)
Refer to the landing strip in block A3 on the topographic map.
3.3.1 The landing strip is an example of a (human-made/natural) line feature.
(1 x 1) (1)
Human-made (1)
3.3.2 Which GIS process describes the demarcation of the landing strip?
A Buffering
B Manipulation
C Security
D Querying (1 x 1) (1)
A (1)/Buffering (1)
Refer to the picture below of open cast mines in blocks C4 and C5 on the
topographical map.
[Source: Google Earth]
3.3.3 Is the above picture an example of a (high or low) oblique photograph?
(1 x 1) (1)
Low (1)
3.3.4 With reference to block C4 and C5 on the topographical map, identify ONE
infrastructural data layer that was considered by GIS specialists when
developing the mines. (1 x 1) (1)
Roads (1)
Buildings (1)
Fences (1)
[ANY ONE]
28
Downloaded from hlayiso.com
10782/24
3.3.5 Why was it important for GIS specialists to consider the data layer
identified in QUESTION 3.3.4? (1 x 2) (2)
Roads for easy transport (2)
Buildings for mining administration/processes (2)
Fences for safety/buffer (2)
[ANY ONE]
3.3.6 The image above is an example of remote sensing. How can remote
sensing be used to monitor the impact of the mine on the environment?
(1 x 2) (2)
Monitor the environment without accessing the area (2)
Monitor the environmental effects quickly (2)
Monitor trends/impact on the environment over time (2)
Safer to monitor with remote sensing (2)
Cheaper to monitor through remote sensing (2)
Monitor large areas (2)
[ANY ONE]
TOTAL SECTION B: 30
TOTAL: 150
29
Study this subject
Recommended for this subject
Memorandum
Geography Grade 12 P2 Eastern Cape Mock 2022 Memo (English)
Memorandum
Geography Grade 12 P2 Eastern Cape Mock 2020 Memo (English)
Memorandum
Geography Grade 12 P2 Eastern Cape Mock 2018 Memo (English)
Question paper
Geography Grade 12 P2 Gauteng June 2025 Question Paper (Eng)
Question paper
Geography Grade 12 P2 Eastern Cape Mock 2018 QP (Eng)
Memorandum
Geography Grade 12 P1 Eastern Cape Mock 2018 Memo (English)
More from Grade 12 Geography
Question paper
Geography Grade 12 Paper 1 KZN Mock 2025 Question Paper
Question paper
Geography Grade 12 Paper 2 KZN Mock 2025 Question Paper
Question paper
Geography Grade 12 P1 NSC June 2025 Question Paper (English)
Question paper
Geography Grade 12 Eastern Cape June 2023 Question Paper
Question paper
Geography Grade 12 GAU June 2023 Question Paper
Question paper