
Downloaded from hlayiso.com
Basic Education
KwaZulu-Natal Department of Basic Education
REPUBLIC OF SOUTH AFRICA
GREENBURY SECONDARY SCHOOL
c DEPARTMENT OF MATHS & SCIENCES:
LIFE SCIENCES & HO.D. MR L PILLAY
Grade 11 (feb bem
PAPER 3 - PRACTICAL TEST - 2018 ;
MARKS: 60 TIME: 60 minutes
INSTRUCTIONS:
1. This paper consists of 6 pages.
2. Answer ALL questions in the spaces provided.
3. Write neatly.
4. Drawings must be done in pencil and labelled in ink.
Question 1: HANDLING EQUIPMENT, FOLLOWING INSTRUCTIONS, OBSERVING,
DRAWING
al PLANT STUDY
Observe the FOUR plants (A, B, C and D) in front of you, and answer the questions
below.
1.1.1 Write ONLY the LETTER representing the plant in the appropriate
space.
a) The plant that bears naked seeds
b) The plant with a rhizome
c) A gametophyte plant
d) A plant that bears fruit _ (4)
4.2 You are provided with the following equipment/apparatus:
A flower specimen Forceps
Microscope Dissecting needles
Scalpel A slide
Petri dish Cellotape
You are required to: i) view the specimen under the microscope
ii) dissect and remove the male and female reproductive
structures
1.2.1. Handling of equipment: 1.2.2 Clarity of specimen [| (2)
Copyright Reserved Please Turn Over
Skip to contentAll 2018 papers 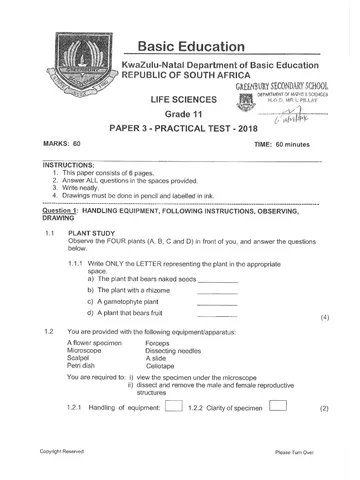


View all



Life Sciences Grade 11 P3 September Test 2018 Paper & Memo
Grade 11 Life Sciences Paper 3 question paper and memo from the September Test 2018, 14 pages. Read online or get the free PDF download.
Life Sciences · Grade 11 · September Test · 2018. Question paper and memorandum, 14 pages. Read online or download the PDF.
- Subject
- Life Sciences
- Grade
- Grade 11
- Document type
- Question paper and memo
- Year
- 2018
- Exam period
- September Test
- Paper
- 3
- Curriculum
- CAPS
- Pages
- 14
- File size
- 3.6 MB
Free to read online, no sign-up needed
Loading document…
Loading document…
1 of 14
This exam
September Test 2018
- Paper 3Paper and memo
- Paper and memo
Document textSearch extracted text and jump to a page.
Downloaded from hlayiso.com
Life Sciences 2 Test: paper 3 - 2018
NSC — Grade 11
1.2.3 Separate the male and female reproductive structures and paste them in the
appropriate spaces below, using the cellotape provided.
| Male Reproductive Structure Female Reproductive Structure
(2)
1.2.4 Draw a neat labelled diagram of the male reproductive structure in the space
below:
(4)
1.2.5 Name the pollinating agent for this flower. (1)
1.2.6 Give TWO reasons for your answer.
_ (2)
(15)
2. Question Two: RECORD OBSERVATIONS, SELECTING APPARATUS,
HYPOTHESISING
2.1 The diagram below represents an investigation, and is exactly like the apparatus set
up in front of you. After a period of 24 hours red hydrogen carbonate indicator was
added to each to each test tube. Hint: Hydrogen carbonate indicator is used to show
changes in carbon dioxide concentration as follows:
e It turns from red to purple when the carbon dioxide level decreases.
e It turns from red to yellow when the carbon dioxide levels increases.
A B
“water
Testitubes A. Band C
in darkness
Copyright Reserved Please Turn Over
Downloaded from hlayiso.com
Life Sciences 3 Test: paper 3 - 2018
NSC - Grade 11
2.1.1 State the AIM for the investigation.
2.1.2 Tabulate the results that will be observed in test tubes A, B and C.
2.1.3 Explain the purpose of test tube A.
2.1.4 List TWO ways in which the process taking place in test tube C is of
biological importance.
2.2 You are given the following equipment and apparatus.
2 test tubes of the same size
2 water plants of the same species and the same size
Water for the test tubes
A beaker to use as a water bath, with some warm water
A thermometer
A lamp
Some foil
Hydrogen carbonate indicator
eoeoeesxseee
Describe the METHOD (in steps) how you will use these to set up an investigation
to demonstrate that light is a factor that affects the rate of photosynthesis.
(4)
(15)
Copyright Reserved Please Turn Over
Downloaded from hlayiso.com
Life Sciences 4 Test: paper 3 - 2018
NSC — Grade 11
3. Question Three: DRAWING GRAPH, MEASURING, CALCULATING
3.1 The MODEL set up in front of you is similar to the one in the diagram below.
y-shaped glass
tube
——-— glass bell jar
plastic sheeting
Bell-jar_ Apparatus
3.1.1 Name the process that this model demonstrate.
3.1.2 What do each of the following parts in the model represent in the human:
a) the Y-shaped tube/straw
b) the plastic sheeting
3.1.3 a) Your teacher will pull downwards on the plastic sheeting.
State the result
b) Name this process.
3.1.4 Explain how the glass bell jar of the model is limited in demonstrating the
actual human system.
3.2 The TABLE below shows the percentage of carbon dioxide (COz) emitted by
different sectors in a certain city in South Africa.
SECTOR CO2 EMISSION
a (%)
__ Transport 25
Residential 27
Industrial | _ 15
Commercial 28.
other 5
3.2.1 Draw a pie chart, on the next page, to represent the data in the table.
Show ALL calculations.
Copyright Reserved Please Turn Over
Downloaded from hlayiso.com
Life Sciences 5 Test: paper 3 - 2018
NSC = Grade 11
3.2.2 Describe how an increase in the CO2 concentration can lead to global
warming.
(3)
— (15)
4. Question Four: MAKE OBSERVATIONS/ ANALYSE/ INTERPRET DATA
41 Observe the dissected specimen of an organ.
Provide the label (A, B, C or D) for each of the following descriptions.
a) Region where Malpighian bodies are situated
b) Collects the urine from pyramids
c) Awide portion leading to the ureters
d) A collection of collecting tubes, forming ducts of Bellini
4.2 The TABLE below shows the following:
“* The amount of each substance filtered daily from the blood into the
Bowman's capsule.
“* The amount of each substance which is present in a day’s urine output.
Substrate | Filtrate Urine
Water 180 litres 1,5 litres
Salts 500 g 15g
Glucose 200 g Og
urea 40g 422
4.2.1 Give ONE reason for 200g glucose in the filtrate and none in the urine.
- (1)
Copyright Reserved Please Turn Over
Downloaded from hlayiso.com
Life Sciences 6
NSC - Grade 11
4.2.2 Calculate the percentage of filtered salt which are reabsorbed. Show
calculations.
4.2.3 Explain why the urea concentration is higher in the urine than in the
filtrate.
4.2.4 Give ONE reason why water is passively reabsorbed at the proximal
convoluted tubule.
4.3 Some people with type | diabetes cannot produce insulin and therefore
need to inject themselves regularly (insulin-dependent).
An investigation was done to determine the action of two types of insulin
(A and B). The glucose uptake rate of cells, when using each type of
insulin, was measured over time.
Test: paper 3 - 2018
Glucose uptake under the influence of Insulin A and
Insulin B in 24 hours
S 8
x 7
B 6
ao 5
£ 4 at j
@ E 3 = Insulin A
£ Eg — Insulin B
5 1 |
g 0 5 10 15 20 26
(a) Time (hours)
[Adapted from www.webmed.com
4.3.1 Name the organ that produces insulin.
4.3.2 Using the information in the graph, state TWO differences in the
functioning of insulin A and B.
Copyright Reserved
Please Turn Over
(1)
(4)
(15)
Downloaded from hlayiso.com
MEMO
Basic Education
KwaZulu-Natal Department of Basic Education
REPUBLIC OF SOUTH AFRICA
GREENBURY SECONDARY SCHOOL
ON MeL PLLA LIFE SCIENCES
sccessvenseenydh hotel epanesiucmicses Grade 11
PAPER 3 -.PRACTICAL TEST - 2018
MARKS: 60 TIME: 60 minutes
INSTRUCTIONS:
1. This paper consists of 6 pages.
2. Answer ALL questions in the spaces provided.
3. Write neatly.
4. Drawings must be done in pencil and labelled in ink.
Question 1: HANDLING EQUIPMEMT, OBSERVING, DRAWING
1.1 PLANT STUDY
Observe the FOUR plants (A, B, C and D).in front of you, and answer the questions
below.
1.1.1 Write ONLY the LETTER representing the plant in the appropriate
space. SY
a) The plant that bears naked seeds dD
b) The plant with a rhizome cv
c) Agametophyte plant BY
d) Aplant that bears fruit A 4 (4)
12 You are provided with the following equipment/apparatus:
A flower specimen Forceps
Microscope Dissecting needles
Scalpel A slide
Petri dish Cellotape
You are required to: i) view the specimen under the microscope
ii) dissect and remove the male and female reproductive
structures
1.2.1 Handling of equipment: 1.2.2 Clarity of specimen (2)
Copyright Reserved . Please Turn Over
Life Sciences
21
Downloaded fram hlayiSO.COM?d pacc:s-2018
NSC -Grade 11
1.2.3 Separate the male and female reproductive structures and paste them in the
appropriate spaces below, using the cellotape provided.
Male Reproductive Structure Female Reproductive Structure
4 “
(2)
1.2.4 Draw a neat labelled diagram of the male reproductive structure in the space
below:
anther % labels
Filament, Y caption .
Y neat, correct
drawing
male luctive. shuctue
lower (4)
1.2.5 Name the pollinating agent for this flower. Wind x sp (1)
1.2.6 Give TWO reasons for your answer. feathery: stiqina Y nok showy,
large. anthers, no sceut , no nectar —o (2)
ee T
(15)
Question Two: SCIENTIFIC INVESTIGATION
The diagram below represents an investigation, and is exactly like the apparatus set
up in front of you. After a period of 24 hours red hydrogen carbonate indicator was
added to each to each test tube. Hint: Hydrogen carbonate indicator is used'to show
changes in carbon dioxide concentration as follows:
e It turns from red to purple when the carbon dioxide level decreases.
e It turns from red to yellow when the carbon dioxide levels increases.
A B c
, pond weed sn
Zh Wh. Wh
' — é
water
Test tubes A, B and C
In darkmess
Please Turn Over
Copyright Reserved
Downloaded fram hlayiso.com, ,.... 5 20
Life Sciences
NSC - Grade 11
2.1.1 State the AIM for the investigation. Te determine whether a
living organisms release CO2 during cellu@ar respiration — (2)
2.1.2 Tabulate the results that will be observed in test tubes A, B and C.
Table sh owing dhe colour obseryed
in each testtube, at 7 end of ex
. Hest Tuas | A | B c |
Test Title “ COLouR oF Red Yelbus Iles
i. Conrect Weadingy Fact | Yells]
Cowreck Results %
ty each TT
VY (5)
2.1.3 Explain the purpose of test tube A. It ach ao a_Contil
te verify that the omanisms preset in B
and C ave neapna ible. dor producing de Ds” avd (2)
else
2.1.4 List WO wae in suhich the process taking place in test tube C is of
biological importance. « COz released used 2d o raw wa'eal
Ler phéte sy thesia —
“Energy wkased during reopiraition is needed der all
life “processes. 7 ~
(2)
2.2 You are given the following equipment and apparatus.
2 test tubes of the same size
2 water plants of the same species and the same size
Water for the test tubes
A beaker to use as a water bath, with some warm water
A thermometer
A lamp
Some foil
Hydrogen carbonate indicator
Describe the METHOD (in steps) how you will use these to set up an investigation
to demonstrate that light is a factor that affects the rate of photosynthesis.
1s Place a leq twig of the same species and. the same size
Bd anact F toed Faved, sane amount dagen
Carbonate eae TT.
2. Theat each "TT as "fellows 4
“TTA: bonoeped tn. in alanaatinea ei) \7 2
tee Both Ores ce dace by BPD Ter lod ” ae
5. Both TT's ave exposed to light fom the. lamp.
Copyright Reserved Please Turn Over
itesienes Downloaded from hlayiso.Com pores 20
NSC — Grade 11
3. Question Three: SCIENTIFIC INVESTIGATION, DRAWING GRAPH
3.1 The MODEL set up in front of you is similar to the one in the diagram below.
y-shaped glass
tube
glass bell jar
plastic sheeting
Bell-jar Apparatus
3.1.1 Name the process that this model demonstrate. Breath ing Mech éanion’)
3.1.2 What do each of the following parts in the model represent in the human:
a) the Y-shaped tube/straw Trachea | bronchus
b) the plastic sheeting diaphragm” muscle (2)
3.1.3 a) Your teacher will pull downwards on the plastic sheeting:
State the result the balloons inf late
b) Name this process. ithalat on ¥
(2)
3.1.4 Explain how the glass bell jar of the model is limited in demonstrating the
actual human system. _ The qlass is Not flexi ble. So
the effect a the exlernal intercostal “muscles 2)
Canndt be ” demonsteted.
3.2 The TABLE below shows the percentage of carbon dioxide (CO2) emitted by
different sectors in a certain city in South Africa.
[| SECTOR | CO2 EMISSION
(%)
Transport 25
Residential 27
Industrial 15
Commercial 28
other 5
3.2.1 Draw a pie chart, on the next page, to represent the data in the table.
Show ALL calculations.
Copyright Reserved Please Turn Over
tie scene DOWnloaded fram hlayiso.com, 43-20:
NSC ~ Grade 11
Carbon dioxide emissions in different sectors of acity ~ Transport = 25/100 x 360° = 90°
Residential = 27/100 x 360° = 97,2”
Industrial = 18/100 x 360°= 54°
Residential a
ee 2% qT Commercial = 28/100 x 360° = 100,8°
Plot: Other = 5/100 x 360° = wy
Industrial
Semyereie 15% W1-3 come “al
& all coved
(5)
3.2.2 Describe how an increase in the COz concentration can lead to global
warming.
~Tnereased CO2 will absorb more “neat
~ beading te enhanceol queen house. eflect ~
~ Thertfre, preven bing ‘the exope of heat om the Earl's ang
Sur ace,
4. Question Four: MAKE OBSERVATIONS/ ANALYSE/ INTERPRET DATA
41 ‘Observe the dissected specimen of an organ.
Provide the label (A, B, C or D) for each of the following descriptions.
a) Region where Malpighian bodies are situated A 4
_ b) Collects the urine from pyramids BY
c) A wide portion leading to the ureters cv
4
d) A collection of collecting tubes, forming ducts of Bellini _>
(4)
4.2 The TABLE below shows the following:
** The amount of each substance filtered daily from the blood into the
Bowman’s capsule.
** The amount of each substance which is present in a day's urine output.
Substrate | Filtrate Urine
Water 180 litres | 1,5 litres
Salts 500 g 15g
Glucose 200 g Og
urea 40g 42g
4.2.1 Give ONE reason for 200g glucose in the filtrate and none in the urine.
all the alucose was re-absorbed into the. (1)
blooal ab dhe proximal C. tube a
Copyright Reserved Please Turn Over
ite sciences DOWnloaded fram hlayiso.COmM, pace-s-20:8
NSC — Grade 11
4.2.2 Calculate the percentage of filtered salt which are reabsorbed. Show
8, U5 % 19
calculations. __7@ Sall re-absorbed = ee oa ev
~)
= 1%
4.2.3 Explain why the urea concentration is higher in the urine than in the
‘filtrate.
Urea is added 4o the filhate from the blood in the
Secoud capillary network “ during tubular excrehon” 2)
4.2.4 Give ONE reason why water is passively reabsorbed at the proximal
convoluted tubule.
fassive re-absorption occurs since the conceutratrou
g, water is hiqher inthe olomerular Fillate than in the
V
blood ~ (mark FIRST one)
43 Some people with type | diabetes cannot produce insulin and therefore
need to inject themselves regularly (insulin-dependent).
An investigation was done to determine the action of two types of insulin
(A and B). The glucose uptake rate of cells, when using each type of
insulin, was measured over time.
Glucose uptake under the influence of Insulin A and
Insulin B in 24 hours
Say
a 2 WS
—& ry
=
: v ;
oF 3 |! . =-= InsulinA
ceo t . a)
a 2 4 ‘ Insulin B
4 4 Te
a 0 LX a
g () 5 10 15 20. BE
oO Time (hours)
a [Adapted from www.webmed.com]
4.3.1 Name the organ that produces insulin. Pancreas (1)
4.3.2 Using the information in the graph, state TWO differences in the
functioning of insulin AandB. | caéelis 8 -
Tr in nsulin
. Glucose ustake peaks ata higher” level/ - Glucose uptake peaks ata lower level/
around TmMg/Ka[ min Y around (mg/kg [min
cA
« AML glucose uptake occurs im a short” +Gluceme uptake is gradual | -
pert of hme] First S hours sustain luring a perc ay hours
THE inkal &ptake tutcee rises othe inital wptake of gluene visto
“rapidly b A apie within dhe slaty to he maximum over (4)
First “Pew Wours “Shears 7 (15)
(Any 2x2)
(mark FiksT Two)
Copyright Reserved Please Turn Over
Downloaded from hlayiso.com
Life Sciences Test: paper 3 - 2018
NSC - Grade 11
For the educator:
THIS PAGE MAY HELP YOU TO SET UP:
1.1 Display PLANTs in a beaker/conical flasks in front of class, in the following
order:
A- Flower plant 7
B- Moss plant | label the
C- Fern plant i beakers- A, B, C and D
D- Pine plant
1.2 Give learners flowers of grass, and equipment (as per test) to help them
dissect the reproductive parts. Look for a grass that you can see parts and that
you can dissect. Try out first.
21 Set up the practical in front on class as per the diagram in question as demo.
Label the test tubes A, B and C.
2.2 Arrange the equipment mentioned in front of class, as per the list in question.
Learners can visualise.
3.1 Set up the bell jar. You will need to demonstrate the inhalation.
3.2 Mention to learners as pre-practical instructions, to bring ALL necessary
stationary, including protractors, compasses, even tweezers, if your school
don’t have, for the dissection, in question one.
4A You will need to dissect all the kidneys. Use tooth picks cut in half. Puta
label on the broken end. Pierce the parts of the kidney using the pointed end,
as follows:
A- Cortex region
B- Calyx
C- Pelvis
D- Pyramid
Thank you. Kogie Govender (Greenbury)
Copyright Reserved Please Turn Over
Downloaded from hlayiso.com
Study this subject
Recommended for this subject
Question paper and memo
Life Sciences Grade 11 Paper 3 NSC Prelim 2018 Paper & Memo
Question paper and memo
Life Sciences Grade 11 P3 September Test 2017 Paper & Memo
Question paper and memo
Life Sciences Grade 11 KwaZulu Natal June 2018 Paper & Memo
Question paper and memo
Life Sciences Grade 11 P1 2018 QP & Memo
Question paper and memo
Life Sciences Grade 11 P2 2018 QP & Memo
Question paper and memo
Life Sciences Grade 11 March Test 2018 Paper & Memo
More from Grade 11 Life Sciences
Annual teaching plan
Gr 11 Life Sci ATP 2023 24
Memorandum
Life Sciences Grade 11 Eastern Cape November 2025 Memo (Afr)
Memorandum
Life Sciences Grade 11 P1 Eastern Cape November 2025 Memo
Question paper
Life Sciences Grade 11 Eastern Cape November 2025 QP (Afr)
Question paper
Life Sciences Grade 11 P2 Eastern Cape November 2025 QP
Memorandum