
Downloaded from hlayiso.com
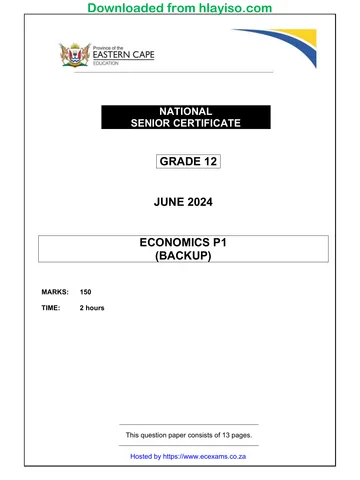
NATIONAL
SENIOR CERTIFICATE
GRADE 12
SEPTEMBER 2014
ECONOMICS P1
MARKS: 150
TIME: 1½ hours
*ECONOE1*
This question paper consists of 12 pages.
Skip to contentAll 2014 papers 
View all
Economics Grade 12 P1 Eastern Cape Mock 2014 QP (Eng)
Grade 12 Economics Paper 1 question paper from the Eastern Cape Mock Exam 2014 (English), 16 pages. Read online or download the free PDF.
Economics · Grade 12 · Eastern Cape Mock Exam · 2014. Question paper, 16 pages. Read online or download the PDF.
- Subject
- Economics
- Grade
- Grade 12
- Document type
- Question paper
- Year
- 2014
- Exam period
- Eastern Cape Mock Exam
- Paper
- 1
- Curriculum
- CAPS
- Pages
- 16
- File size
- 555.6 KB
Free to read online, no sign-up needed
Loading document…
Loading document…
1 of 16
This exam
Eastern Cape Mock Exam 2014
Questions in this paper
- Question 1.1South Africa’s industrial policies and their suitability in terms of international best practice16 marks
- Question 1.2South Africa’s industrial policies and their suitability in terms of international best practice8 marks
- Question 1.3The foreign exchange market and the balance of payments accounts6 marks
- Question 2Protectionism and free trade40 marks
- Question 3South Africa’s industrial policies and their suitability in terms of international best practice36 marks
- Question 4The foreign exchange market and the balance of payments accounts10 marks
Document textSearch extracted text and jump to a page.
Downloaded from hlayiso.com
2 ECONOMICS P1 (SEPTEMBER 2014)
INSTRUCTIONS AND INFORMATION
1. Answer FOUR questions as follows:
SECTION A: COMPULSORY
SECTION B: Answer any TWO of the three questions.
SECTION C: Answer only ONE question.
2. Number the answers correctly according to the numbering system used in
this question paper.
3. Write the question number above each answer.
4. Read the questions carefully and start EACH question on a NEW page.
5. Leave 2–3 lines between subsections of questions.
6. Answer questions in full sentences and ensure that the format, content and
context of your responses comply with the cognitive levels of the questions.
7. Answer only the required number of questions. Answers in excess of the
required number will NOT be marked.
8. Use only black or blue ink.
9. You may use a non-programmable pocket calculator.
10. Write neatly and legibly.
Copyright reserved Please turn over
Downloaded from hlayiso.com
(SEPTEMBER 2014) ECONOMICS P1 3
SECTION A (COMPULSORY)
QUESTION 1 30 MARKS – 15 MINUTES
1.1 Various possible options are provided as answers to the following
questions. Choose the answer and write only the letter (A–C) next to the
question number (1.1.1–1.1.8) in the ANSWER BOOK, for example
1.1.9 C.
1.1.1 South Africa uses the System of National Accounts (SNA)
recommended by the ...
A World Bank.
B United Nations.
C International Monetary Fund.
1.1.2 If the government sells more than 50% of the shares of state
owned enterprises to the private sector, it is known as ...
A nationalisation
B parastatals
C privatisation
1.1.3 Measures that improve market efficiency include ...
A competition.
B tax rates.
C human development.
1.1.4 The level at which a country’s exchange rate is determined is
greatly dependant on the ...
A import of goods and services.
B international movement of exchange rates.
C the number of tourists visiting the country.
1.1.5 Is the removal of trade practices that prevent the free flow of goods
and services between countries:
A Globalisation
B World Trade Organisation
C Trade liberalisation
1.1.6 The first industries that developed in Britain during the Industrial
Revolution were ...
A manufacturing industries.
B agricultural industries.
C mining industries.
Copyright reserved Please turn over
Downloaded from hlayiso.com
4 ECONOMICS P1 (SEPTEMBER 2014)
1.1.7 An index used to compare countries on human aspects of
development:
A Inflation rate
B Repo rate
C HDI
1.1.8 ... is a track of land that forms a passage allowing access from
one area to another.
A Corridors
B IDZ
C Special Economic Zone (8 x 2) (16)
1.2 Choose the correct description from COLUMN B that matches an item in
COLUMN A. Write only the letter (A–I) next to the question number
(1.2.1–1.2.8) in the ANSWER BOOK, for example 1.2.9 J.
COLUMN A COLUMN B
1.2.1 Demographics A relates to goods and physical
processes
1.2.2 Quantitative B based on historical time series data
methods
1.2.3 A fiscal policy C an individual cannot be charged a
price on the basis of use
1.2.4 Non-excludability in D the total of all the money coming into
consumption the country from abroad, less all of
the money going out of the country
during the same period
1.2.5 Beneficiation E deals with the characteristics of the
population, such as size, race, age
etc.
1.2.6 Balance of payment F the process of transforming a
mineral to a higher value product,
which either be consumed locally or
exported
1.2.7 Economic G are used to create the framework and
sanctions the mechanism
1.2.8 Macroeconomic H cutting personal taxation
policies
I penalties imposed on a country such
as refusal to trade and disinvestment
(8 x 1) (8)
Copyright reserved Please turn over
Downloaded from hlayiso.com
(SEPTEMBER 2014) ECONOMICS P1 5
1.3 Fill in the missing word/s in each of the following descriptions. Write only
the term next to the question number (1.3.1–1.3.6) in the ANSWER BOOK.
1.3.1 … is a form of credit that the IMF can use when a country
experiences balance of payment difficulties.
1.3.2 The reward that must be paid to the owners of the fixed capital that
has been used up in the process of producing the final output is
called ...
1.3.3 … is levied on gains earned on the sale of capital goods, such as
properties and shares.
1.3.4 The ... measures prices of goods that are produced domestically
when they leave the factory yard and goods that are imported, when
they enter the country.
1.3.5 The ... involves the discovery of new knowledge.
1.3.6 A ban on trade with a particular country is known as ... (6 x 1) (6)
TOTAL SECTION A: 30
Copyright reserved Please turn over
Downloaded from hlayiso.com
6 ECONOMICS P1 (SEPTEMBER 2014)
SECTION B
Answer any TWO questions from this section in the ANSWER BOOK.
QUESTION 2: MACROECONOMICS 40 MARKS – 20 MINUTES
2.1 Name TWO trade protocols that South Africa is part of. (2 x 2) (4)
2.2 DATA RESPONSE
Study the table below and answer the questions that follow.
Income Tax Tables 1 March 2013 – 28 February 2014
TAXABLE INCOME TAX RATE
R0 – R165 600 18%
R165 601 – R258 750 R29 808 + (25% of the amount above R165 600)
R258 751 – R358 110 R53 096 + (30% of the amount above R258 750)
R358 111 – R500 940 R82 904 + (35% of the amount above R358 110)
R500 941 – R638 600 R132 894 + (38% of the amount above R500 940)
R638 60 and above R185 205 + (40% of the amount above R638 600)
Tax rebates applicable to individuals are:
Primary Rebates R12 080
Secondary Rebates (Persons 65 and older) R6 750
Tertiary Rebates (Person 75 and older ) R2 250
[Source: SARS income tax tables – tax year 2013/2014]
2.2.1 Which scale of taxation is used in the above table? (2)
2.2.2 What is the marginal rate of taxation if a person earns R280 000? (2)
2.2.3 Mr Sokuthu (aged 50) earns R385 000 a year. Calculate the total
tax amount for a year. (4)
2.2.4 Write down Mr Sokuthu’s tax contribution as a percentage of his
taxable income. (2)
Copyright reserved Please turn over
Downloaded from hlayiso.com
(SEPTEMBER 2014) ECONOMICS P1 7
2.3 DATA RESPONSE
Study the cartoon given below and answer the questions that follow.
[Published in Sunday Times in April 2012]
2.3.1 Who is this new boy at the BRIC’s club? (2)
2.3.2 Why do you think the four original BRIC member countries were
keen to welcome this new boy? Give TWO reasons. (4)
2.3.3 Where was the BRICS’s fourth summit held in 2012? (2)
2.3.4 Mention ONE proposal made by the club for the establishment of
the BRICS Development Bank. (2)
2.4 Distinguish between supply-driven and demand-driven as kinds of the
business cycle. (4 x 2) (8)
2.5 Explain why a change in injection has a multiplier effect on the level of
production. (4 x 2) (8)
[40]
Copyright reserved Please turn over
Downloaded from hlayiso.com
8 ECONOMICS P1 (SEPTEMBER 2014)
QUESTION 3: ECONOMIC PURSUIT 40 MARKS – 20 MINUTES
3.1 Mention any TWO kinds of government intervention in industries. (2 x 2) (4)
3.2 DATA RESPONSE
Study the following case study and answer the questions that follow.
Framework for South Africa’s response to the international economic
crisis
The department of Economic Development leads the implementation of the
measures in the framework for South Africa’s response to the international
crisis.
The implemented measure included:
The Industrial Development Corporation (IDC) established a
R6,1 billion fund to assist distressed companies. By February 2012,
the IDC had saved and created 26 309 jobs.
The IDC established a jobs fund, financed through the issue of a
R2 billion development bond, which the Unemployment Insurance
Fund (UIF) purchased. Some R219 million of this R2 billion is included
in the R6,1 billion fund for distressed companies. It was announced in
February 2012, that the UIF would invest another R2 million in job
creation.
The department, together with the Department of Labour, the IDC and
the Commission for Conciliation, Mediation and Arbitration, established
a R2,9 billion training lay-off scheme, to provide for the training of
workers as an alternative to retrenchment. By the end of January
2011, 6 351 workers had benefited. The pace of real output grown in
the South African economy slowed considerably in the second quarter
of 2011. Growth in real gross domestic product (GDP) excluding the
volatile primary sector, also moderated steeply from an annualised rate
of 5,5% in the first quarter of 2011 to 1,6% in the second quarter.
[Source: South Africa National Budget 2013/2014]
3.2.1 What is the role of the Industrial Development (IDC) in the
economy? (2)
3.2.2 According to the extract, explain how the IDC promotes industrial
development. (4)
3.2.3 How will the workers benefit through the action of the IDC and
CCMA? (2)
3.2.4 Explain the meaning of the term “distressed company’’ according to
the extract. (2)
Copyright reserved Please turn over
Downloaded from hlayiso.com
(SEPTEMBER 2014) ECONOMICS P1 9
3.3 DATA RESPONSE
Study the cartoon below and answer the questions that follow.
[Source: South African National Budget 2013/2014]
3.3.1 Identify the economic indicator illustrated in the cartoon. (2)
3.3.2 Explain the action taken by the people in the cartoon. (2)
3.3.3 How can the above-mentioned economic indicator be fixed in
South Africa? Mention any TWO solutions. (2 x 2) (4)
3.3.4 Name the institution that publishes the above-mentioned economic
indicator. (2)
3.4 Briefly explain the Employment Equity Act and Broad Based Black
Empowerment Act used to enforce a preference for black workers and the
businesses of black people. (8)
3.5 Explain the reasons why South Africa supports regional development and
integration in Southern Africa. (8)
[40]
Copyright reserved Please turn over
Downloaded from hlayiso.com
10 ECONOMICS P1 (SEPTEMBER 2014)
QUESTION 4: MACROECONOMICS AND ECONOMIC PURSUIT
40 MARKS – 20 MINUTES
4.1 Name any TWO objectives of the public sector. (2 x 2) (4)
4.2 DATA RESPONSE
Study the graph below and answer the questions that follow.
D S
S1
PRICES OF P
DOLLARS
IN RANDS
P
S
S1 D
Q Q1
AMERICAN DOLLARS
4.2.1 Name the exchange rate system determined by the demand and
supply. (2)
4.2.2 What has happened to the supply of the American dollar? (2)
4.2.3 Give TWO reasons for the occurrence in QUESTION 4.2.2. (2 x 2) (4)
4.2.4 How can the South African Reserve Bank intervene to stabilise the
exchange rate around a particular rate? (2)
[10]
Copyright reserved Please turn over
Downloaded from hlayiso.com
(SEPTEMBER 2014) ECONOMICS P1 11
4.3 DATA RESPONSE
Study the bar graph below and answer the questions that follow.
SA GDP ANNUAL GROWTH RATE (GOVERNMENT ESTIMATES)
[Source: South Africa National Budget 2013/2014]
4.3.1 Define the term GDP. (2)
4.3.2 According to the above bar graph, which year has the lowest
annual growth rate, according to government estimate? (2)
4.3.3 Mention TWO ways how the South African government can
improve growth in South Africa. (2 x 2) (4)
4.3.4 Name the institution that publishes the South African growth rate. (2)
4.4 Explain the reasons for the North South divide. (8)
4.5 Describe TWO characteristics of export processing zones and explain their
aims. (8)
[40]
TOTAL SECTION B: 80
Copyright reserved Please turn over
Downloaded from hlayiso.com
12 ECONOMICS P1 (SEPTEMBER 2014)
SECTION C
Answer ONE of the two questions from this SECTION in the ANSWER BOOK.
MARK ALLOCATION FOR ESSAY RESPONSES
STRUCTURE OF THE ESSAY: MARK
ALLOCATION:
Introduction Max. 2
Body
Max. 26
Main part: Discuss in depth/In-depth discussion/Examine/
Critically discuss/Analyse/Compare/ Evaluate/ Distinguish/
Explain/Assess/Debate
Additional part: Give own opinion/Critically discuss/Evaluate/ Max. 10
Critically evaluate/Draw a graph and explain/Use the graph
given and explain/Complete the given graph/Calculate/
Deduce/Compare/Explain/Distinguish/ interpret/Briefly debate
Conclusion Max. 2
TOTAL 40
QUESTION 5: MACROECONOMICS 40 MARKS – 35 MINUTES
The South African public service faces many challenges in its efforts to become a
truly representative, efficient and democratic instrument and to play its proper role
in the reconciliation, reconstruction and development process.
Discuss the necessity for public sector service. In addition discuss the problems
associated with public sector service delivery. [40]
QUESTION 6: ECONOMIC PURSUIT 40 MARKS – 35 MINUTES
Although much has been done since 1994 to extend public services and
dismantle barriers from the past, there is widespread frustration that poverty
persists, inequality remains high and transformation is sluggish.
Write a report discussing the different economic growth and development
strategies in South Africa since 1994. In addition explain how South Africa’s
fiscal policy since 1994 has aided development. [40]
TOTAL SECTION C: 40
GRAND TOTAL: 150
Copyright reserved Please turn over
Downloaded from hlayiso.com
Downloaded from hlayiso.com
Downloaded from hlayiso.com
Downloaded from hlayiso.com
Study this subject
Recommended for this subject
Question paper
Economics Grade 12 P1 Eastern Cape Mock 2014 QP (Afr)
Question paper
Economics Grade 12 P1 NSC November 2014 Question Paper (Eng)
Question paper
Economics Grade 12 P1 Eastern Cape Mock 2018 QP (Eng)
Question paper
Economics Grade 12 P1 Eastern Cape Mock 2018 QP (Eng)
Question paper
Economics Grade 12 P1 Eastern Cape Mock 2018 QP (Eng)
Question paper
Economics Grade 12 P1 Eastern Cape Mock 2017 QP (Afr)
More from Grade 12 Economics
Memorandum
Economics Grade 12 P2 Eastern Cape June 2025 Memo (Afr)
Memorandum
Economics Grade 12 Paper 2 Gauteng June 2025 Memo (English)
Memorandum
Economics Grade 12 Paper 1 NSC June 2025 Memo (English)
Memorandum
Economics Grade 12 Paper 2 NSC June 2025 Memo (Afrikaans)
Question paper
Economics Grade 12 P2 NW June 2025 Question Paper (English)
Question paper