
Downloaded from hlayiso.com
NATIONAL
SENIOR CERTIFICATE
GRADE 11
NOVEMBER 2023
GEOGRAPHY P2
MARKS: 150
TIME: 3 hours
This question paper consists of 20 pages.
Skip to contentAll 2023 papers 
View all
Geography Grade 11 P2 Eastern Cape November 2023 QP (Eng)
Grade 11 Geography Paper 2 question paper from the Eastern Cape November Exam 2023 (English), 20 pages. Read online or download the free PDF.
Geography · Grade 11 · Eastern Cape November Exam · 2023 · English. Question paper, 20 pages. Read online or download the PDF.
- Subject
- Geography
- Grade
- Grade 11
- Language
- English
- Document type
- Question paper
- Year
- 2023
- Exam period
- Eastern Cape November Exam
- Paper
- 2
- Curriculum
- CAPS
- Pages
- 20
- File size
- 1.2 MB
Free to read online, no sign-up needed
Loading document…
Loading document…
1 of 20
This exam
Eastern Cape November Exam 2023
Questions in this paper
Document textSearch extracted text and jump to a page.
Downloaded from hlayiso.com
2 GEOGRAPHY P2 (EC/NOVEMBER 2023)
INSTRUCTIONS AND INFORMATION
1. This question paper consists of TWO SECTIONS.
SECTION A:
QUESTION 1: DEVELOPMENT GEOGRAPHY (60)
QUESTION 2: RESOURCES AND SUSTAINABILITY (60)
SECTION B:
QUESTION 3: GEOGRAPHICAL SKILLS AND TECHNIQUES (30)
2. Answer all THREE questions.
3. ALL diagrams are included in the QUESTION PAPER.
4. Leave a line between subsections of questions answered.
5. Start EACH question on a NEW page.
6. Number the questions correctly according to the numbering system used in
this question paper.
7. Do NOT write in the margins of the ANSWER BOOK.
8. Draw fully labelled diagrams when instructed to do so.
9. Answer in FULL SENTENCES, except when you have to state, name, identify
or list.
10. Units of measurement MUST be indicated in your final answer, e.g.
1 020 hPa, 14 °C and 45 m.
11. You may use a non-programmable calculator.
12. You may use a magnifying glass.
13. Write neatly and legibly.
SPECIFIC INSTRUCTIONS AND INFORMATION FOR SECTION B
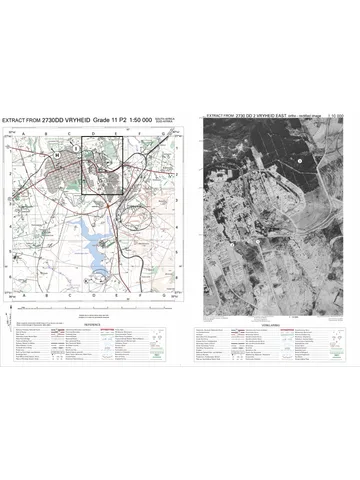
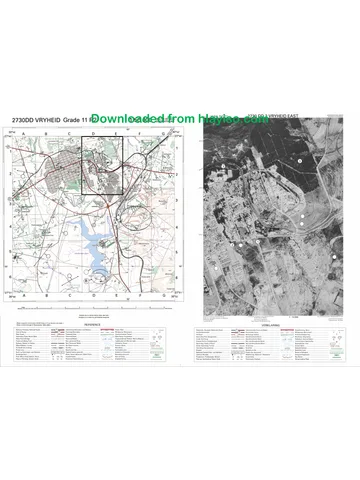
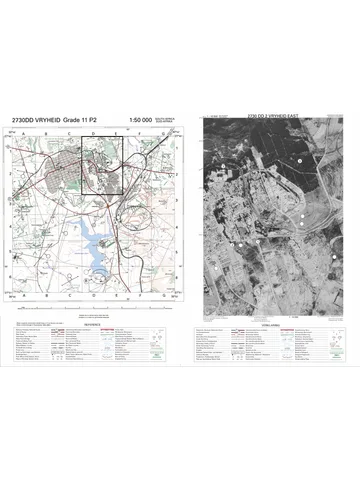
14. A 1 : 50 000 topographical map of 2730DD VRYHEID and the 1 : 10 000
orthophoto map are provided.
15. The area demarcated in BLACK on the topographical map represents the
area covered by the orthophoto map.
16. Marks will be allocated for steps in calculations.
17. You must hand in the topographical and the orthophoto map to the invigilator
at the end of this examination session.
Copyright reserved Please turn over
Downloaded from hlayiso.com
(EC/NOVEMBER 2023) GEOGRAPHY P2 3
SECTION A: DEVELOPMENT GEOGRAPHY AND RESOURCES AND
SUSTAINABILITY
QUESTION 1: DEVELOPMENT GEOGRAPHY
1.1 Various options are provided as possible answers to the following questions.
Choose the answer and write only the letter (A–D) next to the question
numbers (1.1.1 to 1.1.7) in the ANSWER BOOK, for example 1.1.8 D.
1.1.1 Less Economically Developed Countries (LEDC) are characterised
by … and …
(i) high population growth
(ii) high life expectancy
(iii) minimal industrialisation
(iv) technological development
A (i) and (ii)
B (i) and (iii)
C (ii) and (iii)
D (ii) and (iv)
1.1.2 The … indicator shows how wealth is shared in a country.
A quality of life
B human development
C demographic
D Gini co-efficient
1.1.3 Social indicators of human development include … rates.
A maternal mortality
B literacy
C infant mortality
D death
1.1.4 The country depicting the highest level of human development is ...
1.1.5 Australia is a … country located … of the Brandt Line.
A developing; south
B developing; north
C developed; south
D developed; north
Copyright reserved Please turn over
Downloaded from hlayiso.com
4 GEOGRAPHY P2 (EC/NOVEMBER 2023)
1.1.6 Providing a community with access to electricity and schools is
classified as … development.
A basic needs
B sustainable
C equitable
D appropriate
1.1.7 Promoting sustainable development in the Southern African
Development Community (SADC) countries, is development at a …
level.
A community
B national
C regional
D continental
(7 x 1) (7)
Copyright reserved Please turn over
Downloaded from hlayiso.com
(EC/NOVEMBER 2023) GEOGRAPHY P2 5
1.2 Use the table below to complete the statements in COLUMN A with the options
in COLUMN B. Write only X or Y next to question numbers (1.2.1 to 1.2.8) in the
ANSWER BOOK, for example 1.2.9 Y.
SOUTH AFRICAN EXPORTS SOUTH AFRICAN IMPORTS
R88 679 256 980 R101 762 020 372
Trade Balance: R-13 082 763 392
Top 5 countries SA exported to: Top 5 countries SA imported from:
1. China 11,1 1. China 23,1
2. United States 8,1 2. Germany 9,2
3. Germany 6,2 3. United States 5,7
4. Japan 4,8 4. India 4,2
5. Botswana 4,8 5. Saudi Arabia 3,4
[Source: https://prestigecredit.co.za/2019/03/01/south-africa-s-trade-statistics-for-january-2019/]
COLUMN A COLUMN B
1.2.1 The value of South Africa’s … is X exports; imports
greater than the value of its … Y imports; exports
1.2.2 South Africa has a … trade balance X positive
with the USA Y negative
1.2.3 … % of goods are exported from X 6,2
South Africa to Germany Y 9,2
1.2.4 South Africa has trade … with X surplus
Germany Y deficit
1.2.5 The relationship between the value of X balance of trade
a country’s exports and its imports Y balance of payments
1.2.6 China’s economic development can X import-led
be attributed to an … approach to Y export-led
development
1.2.7 Limits set by governments to the X quotas
amount of imported goods Y subsides
1.2.8 Unlimited trade of goods and services X fair trade
between countries without the Y free trade
constraints of tariffs and quotas
(8 x 1) (8)
Copyright reserved Please turn over
Downloaded from hlayiso.com
6 GEOGRAPHY P2 (EC/NOVEMBER 2023)
1.3 Refer to the extract below on the Growing Hope community food gardens.
Community food gardens in Cape Town bring hope to their communities by
activating green spaces,supplementing diets with fresh vegetables and
creating environmental awareness.
Despite facing many challenges, urban gardeners perservere and bring hope
to their communities.
[Adapted from http://vpuu.org.za//projects/towards-a-community-economy]
1.3.1 Classify the food gardens referred to in the extract as rural or urban
community development. (1 x 1) (1)
1.3.2 Account for the food gardens being community-based development.
(1 x 2) (2)
1.3.3 Give TWO examples of human capital that could contribute to the
project’s success. (2 x 1) (2)
1.3.4 What are the social benefits of a well-managed community food
garden? (2 x 2) (4)
1.3.5 What challenges would the community food garden face with limited
access to funding? (3 x 2) (6)
Copyright reserved Please turn over
Downloaded from hlayiso.com
(EC/NOVEMBER 2023) GEOGRAPHY P2 7
1.4 Refer to the image below based on international trade and trade agreement.
[Source: Examiner’s own sketch]
1.4.1 From the sketch, identify ONE commodity that is traded. (1 x 1) (1)
1.4.2 How does the sketch illustrate the successful process of trade? (1 x 1) (1)
1.4.3 Quote evidence from the sketch that depicts trade is on an
international scale. (1 x 1) (1)
1.4.4 How has globalisation contributed to the rapid expansion of
international trade? (2 x 2) (4)
1.4.5 In a paragraph of approximately EIGHT lines, explain how the
principles of fair trade have a positive impact on the economic
development of communities in developing countries. (4 x 2) (8)
Copyright reserved Please turn over
Downloaded from hlayiso.com
8 GEOGRAPHY P2 (EC/NOVEMBER 2023)
1.5 Refer to the extract on development aid for African countries.
AFRICAN COUNTRIES RECEIVE AID AFTER CYCLONE FREDDY
The European Union (EU) provided €2,5 million (R48 600 000) emergency
funding to Mozambique, Malawi and Madagascar when they were struck by
Tropical Cyclone Freddy in February 2023.
Tropical storms and cyclones, floods, droughts and epidemics occur often,
rendering the African region highly vulnerable to these risks.
An air support operation helped humanitarian stakeholders to reach
communities affected by the flooding and strong winds. With this aid,
humanitarian partners on the ground were able to procure essentials such as
food, protection, emergency shelter and non-food items.
Health and emergency services were also assisted because of the cholera
epidemic that broke out in the region. Aid was allocated to partners working
in the water, sanitation and hygiene sector to try and curb the effects of the
water-borne diseases.
[Adapted from https://civil-protection-humanitarian-aid.ec.europa.eu/news-stories/news/southern-
africa-and-indian-ocean-eu-allocates-eu25-million-emergency-aid]
:
1.5.1 What is humanitarian aid? (1 x 2) (2)
1.5.2 Name TWO countries that were affected by Tropical Cyclone Freddy.
(2 x 1) (2)
1.5.3 Identify an example of humanitarian aid mentioned in the extract.
(1 x 1) (1)
1.5.4 Why was humanitarian aid needed in these countries? (2 x 1) (2)
1.5.5 Why do LEDCs face more challenges in their efforts to recover from
natural disasters compared to MEDCs? (2 x 2) (4)
1.5.6 Explain the negative impact of humanitarian aid on developing
countries. (2 x 2) (4)
[60]
Copyright reserved Please turn over
Downloaded from hlayiso.com
(EC/NOVEMBER 2023) GEOGRAPHY P2 9
QUESTION 2: RESOURCES AND SUSTAINABILITY
2.1 Various options are provided as possible answers to the following
questions. Choose the answer and write only the letter (A–D) next to the
question numbers (2.1.1 to 2.1.7) in the ANSWER BOOK, for example
2.1.8 D.
Refer to the map below showing the distribution of South Africa’s energy
sources, to answer QUESTIONS 2.1.1 and 2.1.2.
[Source: https://www.researchgate.net/figure/Map-of-Power-Plants-in-the-Republic-of-
South-Africa]
2.1.1 In which province is South Africa’s only operational nuclear power
plant located?
A Gauteng
B Mpumalanga
C Limpopo
D Western Cape
2.1.2 The majority of South Africa’s coal-fired power stations are in the
Mpumalanga Province due to ...
A rich coal deposits there.
B proximity to other countries.
C concentration of people.
D a high demand for electricity.
Copyright reserved Please turn over
Downloaded from hlayiso.com
10 GEOGRAPHY P2 (EC/NOVEMBER 2023)
2.1.3 Conventional energy sources in South Africa include:
(i) coal
(ii) solar
(iii) hydro
(iv) gas
A (i) and (ii)
B (i) and (iv)
C (i) and (iii)
D (iii) and (iv)
2.1.4 Going green is an important step towards …
A an increased carbon footprint.
B a more sustainable lifestyle.
C increasing greenhouse gases.
D resource depletion.
2.1.5 Natural resources being used in an unsustainable way include …
and …
(i) afforestation.
(ii) extensive use of fossil fuels.
(iii) reforestation.
(iv) heavy use of agrichemicals.
A (i) and (ii)
B (ii) and (iii)
C (iii) and (iv)
D (ii) and (iv)
2.1.6 The country with the most ecological footprint per person is ...
A Botswana
B USA
C Qatar
D Mauritius
Copyright reserved Please turn over
Downloaded from hlayiso.com
(EC/NOVEMBER 2023) GEOGRAPHY P2 11
2.1.7 According to the pie chart below, the main causes of soil erosion
is/are …
A climate change.
B industrialisation.
C agricultural activities.
D urbanisation. (7 x 1) (7)
Copyright reserved Please turn over
Downloaded from hlayiso.com
12 GEOGRAPHY P2 (EC/NOVEMBER 2023)
2.2 The photographs below show different ways how electrical energy is obtained in
South Africa. Match the descriptions below with the appropriate energy source.
Write only the energy source next to the question numbers (2.2.1 to 2.2.8) in the
ANSWER BOOK, for example 2.2.9 Thermal energy.
[Adapted from https://www.sciencedirect.com/topics/engineering/primary-energy-source]
2.2.1 Obtained by splitting uranium atoms
2.2.2 Use of heat of underground rocks and water
2.2.3 Burning vegetation and organic material
2.2.4 Photovoltaic panels converting the sun’s rays
2.2.5 Energy obtained by burning coal in power stations
2.2.6 Energy that is a combination of renewable and a non-renewable
2.2.7 Using the force of running water
2.2.8 Referred to as heat energy
(8 x 1) (8)
Copyright reserved Please turn over
Downloaded from hlayiso.com
(EC/NOVEMBER 2023) GEOGRAPHY P2 13
2.3 Refer to the infographic on soil erosion in the Drakensburg uplands of South
Africa.
Land degradation, in the
form of soil erosion, is a
major threat facing the
sustainability of rangelands.
The mismanagement of
lands (overgrazing and
livestock trampling), related
to the increasing population
densities and demand for
land, have caused soil
erosion.
[Adapted from https://www.intechopen.com/chapters/50695]
2.3.1 How has the increasing population density and demand for land
caused soil erosion? (1 x 2) (2)
2.3.2 (a) Which image (A, B or C) is most vulnerable to soil erosion?
(1 x 1) (1)
(b) Explain your answer to QUESTION 2.3.2(a) by referring to the
impact of the grass cover. (1 x 2) (2)
2.3.3 Why is soil erosion ‘a major threat’ to the livelihood of subsistence
farmers who use the communal land? (2 x 1) (2)
2.3.4 In a paragraph of EIGHT lines, explain sustainable management
strategies that can be used to control and prevent soil erosion. (4 x 2) (8)
Copyright reserved Please turn over
Downloaded from hlayiso.com
14 GEOGRAPHY P2 (EC/NOVEMBER 2023)
2.4 Refer the extract below on Africa’s renewable energy.
• Africa: the world’s only region that exceeds “excellent conditions” for
solar power
• Africa has 60% of the world’s best solar resources but only 1% of the
solar generation capacity is harnessed.
• These solar power resources give Africa a unique opportunity to
provide affordable, reliable, and sustainable electricity for its economic
growth.
[Adapted from https://www.weforum.org/agenda/2022/09/africa-solar-power-potential/]
2.4.1 What is renewable energy? (1 x 2) (2)
2.4.2 Which region is the current leader on the African continent in
renewable energy capacity? (1 x 1) (1)
2.4.3 Which African region, when all their under-construction projects are
complete, will more than double their current capacity? (1 x 2) (2)
2.4.4 What physical factors contribute to Africa being described as exceeding
‘excellent conditions’ for solar power? (2 x 1) (2)
2.4.5 How will the development of solar power plants contribute to Africa’s
economic growth? (2 x 2) (4)
2.4.6 Explain the challenges Africa faces in increasing their capacity to
generate solar energy. (2 x 2) (4)
Copyright reserved Please turn over
Downloaded from hlayiso.com
(EC/NOVEMBER 2023) GEOGRAPHY P2 15
2.5 Refer to the extract on South Africa’s energy management.
COAL STILL HAS AN IMPORTANT ROLE TO PLAY IN SOUTH AFRICA:
TODAY AND TOMORROW
South Africa’s coal-fired power stations are linked with South Africa’s energy
crisis. The government-owned national power utility, Eskom Holdings – which
generates 90% of the electricity used in South Africa and 30% of the electricity
generated on the African continent – has been unable to keep up with the
national demand for electricity.
Eskom’s 14 coal-fired power stations are either old and inadequately maintained
or poorly designed and not operating to capacity. Due to these issues, South
Africa experiences a daily shortfall of around 4 000–6 000 megawatts, roughly
equivalent to 10% of current use. What result are scheduled power outages (or
loadshedding*).
Unstable access to electricity does not only impact negatively on daily lives of
the public, but power outages also cause disruptions to businesses, damaging
the very economic backbone of the nation.
To address this problem, South Africa has been working to shift its energy mix
from coal to renewables like wind and solar. However, from a holistic
perspective, coal has a crucial role to play in stabilising the country’s energy
sector and business environment.
*Loadshedding: when a power station cannot meet demand for electricity, power is
switched off to parts of the grid to protect power generating assets.
[Adapted from https://energycapitalpower.com/like-it-or-not-coal-still-has-an-important-role-to-
play-in-south-africa-today-and-tomorrow/]
2.5.1 According to the extract, what percentage of South Africa’s electricity
does Eskom generate? (1 x 1) (1)
2.5.2 Quote from the extract, why Eskom’s fourteen (14) coal-fired power
stations are unable to meet the national demand for electricity.
(2 x 1) (2)
2.5.3 How does unstable electricity supply (loadshedding) affect small
businesses? (1 x 2) (2)
2.5.4 In what ways do South Africa’s reliance on coal-fired power stations
impact the environment? (2 x 2) (4)
2.5.5 Explain why reducing the country’s dependency on coal as a source of
energy would be detrimental to the economy. (3 x 2) (6)
[60]
Copyright reserved Please turn over
Downloaded from hlayiso.com
16 GEOGRAPHY P2 (EC/NOVEMBER 2023)
SECTION B
QUESTION 3: GEOGRAPHICAL SKILLS AND TECHNIQUES
GENERAL INFORMATION ON VRYHEID
Coordinates: 27° 45' 55'' S; 30° 47' 32'' E
Vryheid is in the Abaqulusi Municipality in KwaZulu-Natal. The town has a relatively large
commercial and service sectors although the economy is dependent on agriculture and coal
mining. Primary activities include livestock farming, irrigated crop production, orchards and
significant forestry plantations. The commercial agriculture is under threat from land
degradation and droughts. The mining sector has traditionally been a key stimulus of the
districts’ economy, however, mining activities in the district decreased in the mid-1990s
mainly due to the closure of mines.
[Adapted from Zululand District Municipality Integrated Development Plan: 2020/2021]
The following English terms and their translations are shown on the topographical map:
ENGLISH AFRIKAANS
Aerodrome Vliegveld
Canal Kanaal
Diggings Uitgrawings
Furrow Voor
Golf course Gholfbaan
Sewerage works Rioolwerke
Show grounds Skougronde
Waterfall Waterval
Weir Studam
Copyright reserved Please turn over
Downloaded from hlayiso.com
(EC/NOVEMBER 2023) GEOGRAPHY P2 17
QUESTION 3
3.1 MAPWORK SKILLS AND CALCULATIONS
Refer to the topographical map and the orthophoto map Various options are
provided as possible answers to the following questions. Choose the answer
and write only the letter (A–D) next to the question numbers (3.1.1 to 3.1.2) in
the ANSWER BOOK, for example 3.1.3 A.
3.1.1 The map index south-east of 2730DD is …
A 2831AA.
B 2731CA.
C 2730DA.
D 2730BA. (1 x 1) (1)
3.1.2 On the orthophoto map,1 cm represents … in reality.
A 1 000 cm
B 1 km
C 100 m
D 0,1 m (1 x 1) (1)
3.1.3 The updated mean magnetic declination (MD) for 2023 is 22°14' west
of True North.
Determine the magnetic bearing (MB) of the hiking trail, from
H (block B1) to the dam I (block C1) on the topographical map.
(2 x 1) (2)
3.1.4 Why it is important for a hiker to use the magnetic bearing instead of
the true bearing to determine direction on the topographical map?
(1 x 1) (1)
3.1.5 Refer to 1 and 2 on the orthophoto map.
(a) The straight-line distance on the map, from 1 to 2, is 3,8 cm.
Calculate the actual distance in meters. (2 x 1) (2)
(b) Calculate the average gradient between 1 and 2.
Vertical interval (VI)
Formula: Average gradient =
Horizontal equivalent (HE)
(3 x 1) (3)
Copyright reserved Please turn over
Downloaded from hlayiso.com
18 GEOGRAPHY P2 (EC/NOVEMBER 2023)
3.2 MAP INTERPRETATION
Refer to the topographical map.
3.2.1 The man-made feature J in block D4 is a(n) …
A railway station.
B excavation.
C embankment.
D mine dump. (1 x 1) (1)
3.2.2 The Besterspruit River in block E4 is … and flows …
(i) non-perennial.
(ii) perennial.
(iii) northwards.
(iv) southwards.
A (i) and (ii)
B (ii) and (iii)
C (i) and (iv)
D (ii) and (iv) (1 x 1) (1)
3.2.3 Refer to the topographical map and the photograph below which
depicts K in D6.
[Adapted from Google Maps]
(a) Use both the topographical map and photographical evidence
above to explain why the Klipfontein Dam is not a good
location for the construction of a hydro-electric power station.
(1 x 2) (2)
(b) Suggest TWO economic activities that could benefit from the
Klipfontein Dam. (2 x 1) (2)
Copyright reserved Please turn over
Downloaded from hlayiso.com
(EC/NOVEMBER 2023) GEOGRAPHY P2 19
3.2.4 Refer to the area demarcated by L in block E3/F3 and E4/F4 on the
topographical map, which shows extensive soil erosion.
(a) Describe the process of soil erosion. (1 x 2) (2)
(b) Explain the negative effects of soil erosion on the physical
environment. (2 x 2) (4)
3.3 GEOGRAPHICAL INFORMATION SYSTEMS (GIS)
3.3.1 Refer to the diagram showing the process of data layering.
[Source: https://www.esri.com/arcgis]
(a) Classify layers X and Y as raster or vector data. (2 x 1) (2)
(b) Explain your answer for layer Y. (1 x 2) (2)
3.3.2 Locate the VRYHEID NATURE RESERVE in blocks B1 / C1, which
makes use of GIS to help manage the reserve sustainably.
Name TWO physical (natural) layers the reserve management
would use to make informed decisions about resource
management. (2 x 1) (2)
Copyright reserved Please turn over
Downloaded from hlayiso.com
20 GEOGRAPHY P2 (EC/NOVEMBER 2023)
3.3.3 Consider the woodland (3) on the orthophoto map.
How would continuous collection of satellite imagery data of the
area assist in monitoring deforestation? (1 x 2) (2)
[30]
TOTAL: 150
Copyright reserved Please turn over
Study this subject
Recommended for this subject
Memorandum
Geography Grade 11 P1 Eastern Cape November 2023 Memo (Eng)
Memorandum
Geography Grade 11 P2 Eastern Cape November 2025 Memo (Eng)
Question paper
Geography Grade 11 P2 Eastern Cape November 2022 QP (Eng)
Question paper
Geography Grade 11 P2 Eastern Cape November 2018 QP (Eng)
Question paper
Geography Grade 11 Paper 2 MAPS 2023 Question Paper
Question paper
Geography Grade 11 Paper 2 MAPS 2023 Question Paper
More from Grade 11 Geography
Memorandum
Geography Grade 11 P1 Eastern Cape November 2025 Memo (Eng)
Question paper and memo
Geography Grade 11 Free State March Test 2025 Paper & Memo
Memorandum
Geography Grade 11 P1 Eastern Cape November 2024 Memo (Afr)
Question paper
Geography Grade 11 Paper 2 MAPS 2023 Question Paper
Memorandum
Geography Grade 11 P1 Eastern Cape November 2022 Memo (Eng)
Memorandum