
Mock
hlayiso mock exams
Practice Series:
Grade 11 Exam Preparation
WWW.HLAYISO.COM
NATIONAL
SENIOR CERTIFICATE
GRADE 11
GEOGRAPHY P1
NOVEMBER EXAMINATION 2026 (MOCK)
MARKS: 150
TIME: 3 hours
This question paper consists of 15 pages.
Copyright reserved Please turn over
Skip to contentAll 2026 papers 


View all


Geography Grade 11 P1 November Mock Exam 2 2026 QP (Eng)
Grade 11 Geography Paper 1 question paper from the November Mock Exam 2 2026 (English), 15 pages. Read online or download the free PDF.
Geography · Grade 11 · November Mock Exam 2 · 2026 · English. Question paper, 15 pages. Read online or download the PDF.
- Subject
- Geography
- Grade
- Grade 11
- Language
- English
- Document type
- Question paper
- Year
- 2026
- Exam period
- November Mock Exam 2
- Paper
- 1
- Publisher
- Hlayiso
- Curriculum
- CAPS
- Pages
- 15
- File size
- 172.4 KB
Free to read online, no sign-up needed
Loading document…
Loading document…
1 of 15
This exam
November Mock Exam 2 2026
- Paper 1Question paperAddendumMemo
- Paper 2Question paperAddendumMemo
Document textSearch extracted text and jump to a page.
Geography/P1 2 Hlayiso/Mock 2026
NSC Mock
INSTRUCTIONS AND INFORMATION
1. This question paper consists of TWO sections.
SECTION A
QUESTION 1: THE ATMOSPHERE (60)
QUESTION 2: GEOMORPHOLOGY (60)
SECTION B
QUESTION 3: GEOGRAPHICAL SKILLS AND TECHNIQUES (30)
2. Answer ALL THREE questions.
3. ALL diagrams are included in the QUESTION PAPER.
4. Leave a line between the subsections of questions answered.
5. Start EACH question at the top of a NEW page.
6. Number the answers correctly according to the numbering system used in this question
paper.
7. Do NOT write in the margins of the ANSWER BOOK.
8. Draw fully labelled diagrams when instructed to do so.
9. Answer in FULL SENTENCES, except when you have to state, name, identify or list.
10. Units of measurement MUST be indicated in your final answer, e.g. 1 020 hPa, 14 ◦ C
and 45 m.
11. You may use a non-programmable calculator.
12. You may use a magnifying glass.
13. Write neatly and legibly.
SPECIFIC INSTRUCTIONS AND INFORMATION FOR SECTION B
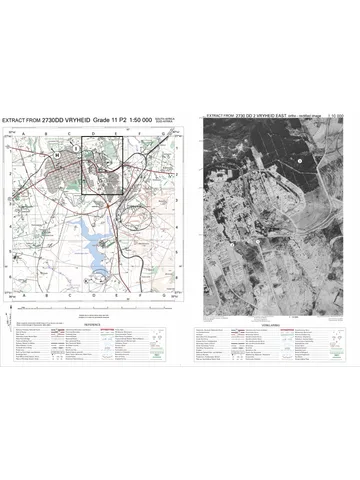
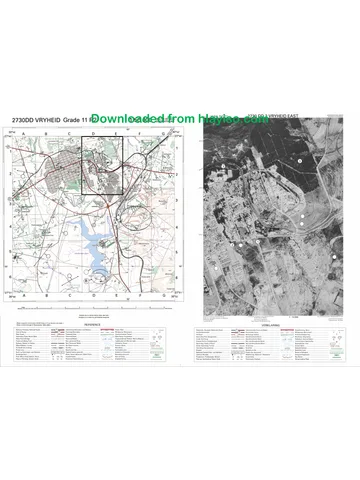
14. A 1 : 50 000 topographical map extract of 2930AC and AD HOWICK and a 1 : 10 000
orthophoto map extract (2930AC 25 HOWICK) of a part of the mapped area are
provided on one A3 sheet, supplied with this mock as Geography Gr11 P1 Mock
2026 Map (2930AC Howick). Map extracts: Chief Directorate: National Geo-spatial
Information. Print it on A3 paper at 100% (actual size).
15. The area demarcated in RED on the topographical map represents the area covered
by the orthophoto map.
16. Ignore the letters and numbers already printed on the maps (F, G, H, I and 8 to 11).
They are NOT used in this question paper.
17. Show ALL calculations. Marks will be allocated for steps in calculations.
Copyright reserved Please turn over
Geography/P1 3 Hlayiso/Mock 2026
NSC Mock
SECTION A
QUESTION 1: THE ATMOSPHERE
1.1 Complete the statements in COLUMN A with the options in COLUMN
B. Write only Y or Z next to the question numbers (1.1.1 to 1.1.8) in the
ANSWER BOOK, e.g. 1.1.9 Y.
COLUMN A COLUMN B
1.1.1 The movement of the earth around Y rotation
the sun, which takes about 365 14 Z revolution
days, is called …
1.1.2 On 21 June the midday sun is Y Tropic of Cancer
directly overhead at the … Z Tropic of
Capricorn
1.1.3 The day in the year with the longest Y summer solstice
period of daylight in the southern Z equinox
hemisphere is the …
1.1.4 When the sun’s rays strike the Y higher
earth’s surface at a low (oblique) Z lower
angle, the insolation per unit area
is …
1.1.5 Areas between the poles and Y deficit
approximately 38◦ latitude lose Z surplus
more energy than they receive and
have an energy …
1.1.6 The ocean current that flows Y Benguela
southwards along the east coast Z Agulhas
of South Africa is the … Current.
1.1.7 Cold ocean currents … the air Y cool and stabilise
above them, so that little rain falls Z heat and
on the adjacent coast. destabilise
1.1.8 The low-pressure zone near the Y polar front
equator where the trade winds of Z ITCZ
the two hemispheres meet is the …
(8 x 1) (8)
Copyright reserved Please turn over
Geography/P1 4 Hlayiso/Mock 2026
NSC Mock
1.2 Refer to the sketch below showing the global pressure belts and
planetary winds. Various options are provided as possible answers to the
following questions. Choose the answer and write only the letter (A–D)
next to the question numbers (1.2.1 to 1.2.7) in the ANSWER BOOK,
e.g. 1.2.8 D.
L N
60◦ N
4
H
30◦ N
L
1 0◦
2
H
30◦ S
L
3 60◦ S
[Source: Examiner’s own sketch]
1.2.1 The pressure belt at 1 is the …
A subtropical high-pressure belt.
B equatorial low-pressure belt.
C subpolar low-pressure belt.
D polar high-pressure belt.
1.2.2 The planetary winds at 2 are the …
A south-east trade winds.
B north-east trade winds.
C north-westerlies.
D polar easterlies.
1.2.3 The winds at 2 blow from the subtropical high-pressure belt to
the equator because of the …
A Coriolis force.
B pressure gradient force.
C frictional force.
D gravitational force of the moon.
Copyright reserved Please turn over
Geography/P1 5 Hlayiso/Mock 2026
NSC Mock
1.2.4 The planetary winds at 4 are deflected to the right because they
are …
A in the southern hemisphere.
B blowing over the oceans.
C in the northern hemisphere.
D blowing towards a high-pressure belt.
1.2.5 The low-pressure belt at 3 forms where …
A warm, moist westerlies meet cold polar easterlies.
B the north-east and south-east trade winds converge.
C cold, dense air sinks over the poles.
D air from the Hadley cell descends.
1.2.6 The circulation cell between 30◦ S and 60◦ S is the … cell.
A Hadley
B Walker
C polar
D Ferrel
1.2.7 In July the pressure and wind belts shift northwards because
the …
A earth rotates faster in winter.
B overhead sun is at the Tropic of Cancer.
C ocean currents change direction. (7 x 1) (7)
D southern hemisphere has more land than the northern
hemisphere.
Copyright reserved Please turn over
Geography/P1 6 Hlayiso/Mock 2026
NSC Mock
1.3 Refer to the synoptic weather map of South Africa below.
N
R
P 1 024
H
1 024 B
X 1 024
1 028
A H
1 032
H
1 028
Weather station X
Indian Ocean
19
C 1 016
1 012
Atlantic Ocean 11
Q
1 004
[Source: Examiner’s own sketch (simplified)]
1.3.1 Determine the isobaric interval used on the synoptic weather
map. (1 x 1) (1)
1.3.2 Give the air pressure of the isobar at P. (1 x 1) (1)
1.3.3 Name the high-pressure cell at A. (1 x 1) (1)
1.3.4 Give TWO pieces of evidence from the synoptic weather map
that it represents winter conditions. (2 x 1) (2)
1.3.5 Refer to weather station X. State the:
(a) Air temperature
(b) Dew-point temperature
(c) Cloud cover
(d) Wind direction (4 x 1) (4)
1.3.6 Compare the pressure gradient at Q with the pressure gradient
at R, and explain how it will influence the wind speed at each
place. (2 x 2) (4)
1.3.7 Explain why the interior of South Africa under the influence of
high-pressure cell B will experience cold, clear nights. (1 x 2) (2)
Copyright reserved Please turn over
Geography/P1 7 Hlayiso/Mock 2026
NSC Mock
1.4 Refer to the sketch below showing the development of a Föhn wind.
height (m)
Dry adiabatic lapse rate: 10 ◦ C per 1 000 m
summit: 3 000 m Y Wet (saturated) adiabatic lapse rate: 6 ◦ C per 1 000 m
3 000 windward side
leeward side
2 000
condensation level (1 000 m)
1 000
sea level, 22 ◦ C 500 m
Z
W
0 sea
[Source: Examiner’s own sketch]
1.4.1 Define the term Föhn wind. (1 x 2) (2)
1.4.2 What name is given to Föhn-type winds that blow from the
interior plateau towards the coast of South Africa? (1 x 1) (1)
1.4.3 The air at W is 22 ◦ C. Calculate the temperature of the air when
it reaches the summit at Y. Show ALL calculations. (2 x 1) (2)
1.4.4 Calculate the temperature of the air when it reaches Z on the
leeward side. Show ALL calculations. (2 x 1) (2)
1.4.5 In a paragraph of approximately EIGHT lines, explain the
negative impact of hot, dry Föhn-type winds on people and the
natural environment along the coast of South Africa. (4 x 2) (8)
Copyright reserved Please turn over
Geography/P1 8 Hlayiso/Mock 2026
NSC Mock
1.5 Read the extract and study the table below on desertification in a rural
district.
THE SAND IS WINNING
Thirty years ago the grasslands around the village supported large
herds of cattle and goats. Today patches of bare, sandy soil stretch
between the homesteads. Elders say the summer rains have
become less reliable and the dry spells longer. At the same time the
number of animals has grown far beyond what the land can carry,
and trees along the stream have been cut down for firewood and
fencing. During the hot, windy months before the rains, the topsoil
blows away in dust clouds and the few remaining dams fill with silt.
Many young people have left for the cities to look for work.
Year 2005 2015 2025
Livestock units per km2 14 22 31
Recommended carrying capacity (livestock units per km2 ) 15 15 15
Area of bare (degraded) land (%) 9 21 38
[Source: Examiner’s own extract and table (fictional data)]
1.5.1 Define the term desertification. (1 x 2) (2)
1.5.2 Quote TWO human activities from the extract that contribute to
desertification in the district. (2 x 1) (2)
1.5.3 State ONE natural (climatic) cause of desertification mentioned
in the extract. (1 x 1) (1)
1.5.4 Use the table to explain how overgrazing has contributed to
desertification in the district. (1 x 2) (2)
1.5.5 Explain the negative social impact of desertification on the
people of the village. (2 x 2) (4)
1.5.6 Suggest sustainable strategies that the community can use to
reverse desertification in the district. (2 x 2) (4)
[60]
Copyright reserved Please turn over
Geography/P1 9 Hlayiso/Mock 2026
NSC Mock
QUESTION 2: GEOMORPHOLOGY
2.1 Complete the statements in COLUMN A with the options in COLUMN
B. Write only Y or Z next to the question numbers (2.1.1 to 2.1.8) in the
ANSWER BOOK, e.g. 2.1.9 Y.
COLUMN A COLUMN B
2.1.1 A vertical, wall-like igneous Y sill
intrusion that cuts across the rock Z dyke
layers is a …
2.1.2 A saucer-shaped igneous intrusion Y lopolith
that sags downwards in the middle Z laccolith
is a …
2.1.3 Rock that forms when existing rock Y sedimentary
is changed by great heat and Z metamorphic
pressure is … rock.
2.1.4 Sandstone and shale are Y igneous
examples of … rocks. Z sedimentary
2.1.5 A ridge of inclined strata with a dip Y homoclinal ridge
slope of between 25◦ and 45◦ is a Z cuesta
…
2.1.6 A flat, dome-shaped exposure of Y butte
granite that is almost level with the Z ruware
surrounding land is a …
2.1.7 The slow downslope flow of Y solifluction
waterlogged soil over frozen Z slumping
ground is …
2.1.8 A rapid mass movement in which Y soil creep
a large amount of water-saturated Z mudflow
soil and mud flows downslope is a
…
(8 x 1) (8)
Copyright reserved Please turn over
Geography/P1 10 Hlayiso/Mock 2026
NSC Mock
2.2 Refer to the sketch below showing landforms and slope elements
associated with horizontally layered rocks. Various options are provided
as possible answers to the following questions. Choose the answer and
write only the letter (A–D) next to the question numbers (2.2.1 to 2.2.7)
in the ANSWER BOOK, e.g. 2.2.8 D.
1 resistant cap rock 3
4
plateau
2
5
6
[Source: Examiner’s own sketch]
2.2.1 The deep, steep-sided valley at 1 that has been cut into the
plateau by a river is a …
A canyon.
B pediment.
C hogsback.
D dip slope.
2.2.2 Landform 2 is a …
A mesa.
B tor.
C conical hill (koppie).
D cuesta.
2.2.3 The slope element at 3 is the …
A talus slope.
B crest (waxing slope).
C pediment.
D free face.
2.2.4 The steep, bare rock face at 4 is the … and it retreats mainly
by …
A free face (cliff); weathering and rockfalls
B pediment; deposition
C talus slope; soil creep
D crest; exfoliation
Copyright reserved Please turn over
Geography/P1 11 Hlayiso/Mock 2026
NSC Mock
2.2.5 The slope element at 5, where weathered rock fragments from
above collect, is the …
A crest.
B talus (debris) slope.
C free face.
D dip slope.
2.2.6 The gentle, concave slope at 6 is the … and it is the most
suitable slope element for …
A free face; rock climbing
B talus slope; quarrying
C crest; communication towers
D pediment; farming and settlement
2.2.7 The process in which the free face at 4 retreats while keeping
the same steep angle is …
A slope replacement.
B parallel (scarp) retreat.
(7 x 1) (7)
C upwelling.
D solifluction.
2.3 Refer to the cross-section below of a basin of inclined rock layers.
A
C D
B
approximately 30 km
resistant rock softer rock layers
[Source: Examiner’s own sketch (not to scale)]
2.3.1 Name the landscape (structure) as a whole that is shown in the
cross-section. (1 x 1) (1)
2.3.2 Identify the ridge at A, which has a gentle dip slope of
approximately 10◦ . (1 x 1) (1)
2.3.3 Do the scarp slopes of the ridges in the sketch face towards or
away from the centre (D) of the landscape? (1 x 1) (1)
2.3.4 Name the slopes labelled B and C. (2 x 1) (2)
2.3.5 Explain how the landscape in the sketch developed. (2 x 2) (4)
Copyright reserved Please turn over
Geography/P1 12 Hlayiso/Mock 2026
NSC Mock
2.3.6 Explain how the inclined rock layers of this landscape can
benefit the people who live in the centre (D) of the landscape. (3 x 2) (6)
2.4 Refer to the sketch below showing the stages in the development of a
tor.
soil and regolith
X
Y
STAGE 1 STAGE 2 STAGE 3
Massive igneous rock (shaded) with vertical and horizontal joints
[Source: Examiner’s own sketch]
2.4.1 What is a tor? (1 x 2) (2)
2.4.2 Name the type of rock in which tors usually develop and the
type of large igneous intrusion in which this rock forms. (2 x 1) (2)
2.4.3 Identify the loose, weathered material at X in STAGE 2. (1 x 1) (1)
2.4.4 Explain why the blocks of rock in STAGE 2 have become
rounded. (1 x 2) (2)
2.4.5 In a paragraph of approximately EIGHT lines, explain how the
tor at Y developed from the rock in STAGE 1. (4 x 2) (8)
Copyright reserved Please turn over
Geography/P1 13 Hlayiso/Mock 2026
NSC Mock
2.5 Refer to the extract below on mass movement.
MUD BURIES HOMES ON HILLSIDE
Twelve homes in an informal hillside settlement in KwaZulu-Natal
were buried when a mass of mud and soil flowed down a steep
slope early on Sunday morning. More than 200 mm of rain fell in
three days, and the ground was already soaked after a wet summer.
Residents explained that most of the trees on the slope had been
cut down for firewood and building material over the past ten years.
Many houses had been built on terraces cut into the slope, and
water from leaking pipes and blocked drains flowed onto the slope.
Disaster management officials have moved 40 families to a
community hall and warned that more of the slope could give way.
[Source: Examiner’s own extract (fictional)]
2.5.1 Identify the type of mass movement described in the extract. (1 x 1) (1)
2.5.2 Is the mass movement identified in QUESTION 2.5.1 a slow or
a rapid mass movement? (1 x 1) (1)
2.5.3 Quote THREE human activities from the extract that increased
the risk of mass movement on the slope. (3 x 1) (3)
2.5.4 Explain why the removal of trees on the slope (as mentioned in
the extract) increased the likelihood of a mudflow. (2 x 2) (4)
2.5.5 Why are people in informal hillside settlements more at risk of
mass movement than people in formal suburbs? (1 x 2) (2)
2.5.6 Suggest measures that the municipality can take to reduce the
risk of future mass movements in the settlement. (2 x 2) (4)
[60]
TOTAL SECTION A: 120
Copyright reserved Please turn over
Geography/P1 14 Hlayiso/Mock 2026
NSC Mock
SECTION B
QUESTION 3: GEOGRAPHICAL SKILLS AND TECHNIQUES
GENERAL INFORMATION ON HOWICK
Co-ordinates: 29◦ 29′ S; 30◦ 14′ E
Howick is a town in the uMngeni Local Municipality in the KwaZulu-Natal Midlands, about
25 km north-west of Pietermaritzburg. On the edge of the town the Mgeni River plunges
about 95 m over the Howick Falls into a deep, steep-sided gorge. The area receives
summer rainfall, with warm, wet summers and cool, dry winters in which frost is common.
Forestry, dairy farming and tourism are important economic activities.
[Adapted from various sources]
The following Afrikaans terms appear on the maps:
AFRIKAANS ENGLISH
Kontoertussenruimte Contour interval
Gemiddelde magnetiese deklinasie Mean magnetic declination
Gemiddelde jaarlikse verandering Mean annual change
Wes van Ware Noord West of True North
Verklaring Reference (key)
3.1 MAP SKILLS AND CALCULATIONS
3.1.1 The scale of the orthophoto map is … than the scale of the
topographical map.
A five times smaller
B ten times smaller
(1 x 1) (1)
C five times larger
D ten times larger
3.1.2 Calculate the straight-line distance in kilometres (km) between
trigonometrical station 47 (Lookout Tower) in block B1 and
trigonometrical station 166 in block C3 on the topographical
map. (2 x 1) (2)
3.1.3 Give the co-ordinates (degrees, minutes and seconds) of
trigonometrical station 166 in block C3 on the topographical
map. (2 x 1) (2)
3.1.4 Calculate the average gradient from trigonometrical station 166
(block C3) to spot height 738 in block D5 on the topographical
map.
Vertical Interval (VI)
Use the formula: Gradient = (4 x 1) (4)
Horizontal Equivalent (HE)
Copyright reserved Please turn over
Geography/P1 15 Hlayiso/Mock 2026
NSC Mock
3.1.5 Use the information below the topographical map to calculate
the magnetic declination of Howick for 2026. Show ALL
calculations.
Difference in years:
Mean annual change: 2′ westwards
(3 x 1) (3)
Total change:
Magnetic declination for 2026:
3.2 MAP INTERPRETATION
3.2.1 The green shading in block B1 on the topographical map shows
…
A cultivated land.
B woodland (forestry plantations).
(1 x 1) (1)
C orchards and vineyards.
D recreation grounds.
3.2.2 Give TWO reasons why the slopes in block B1 are used for
forestry rather than for growing crops. (2 x 2) (4)
3.2.3 Refer to the Mgeni River in blocks E2 and E3 on the
topographical map. Give ONE piece of map evidence that the
river flows in a deep, steep-sided valley. (1 x 1) (1)
3.2.4 Name ONE type of rapid mass movement that is likely to occur
on the valley sides of the Mgeni River in block E3 after heavy
summer rain. (1 x 1) (1)
3.2.5 Explain why the type of mass movement named in QUESTION
3.2.4 is likely on these valley sides. (1 x 2) (2)
3.2.6 The Howick Falls (block E2) formed where the Mgeni River
flows over resistant rock lying on top of softer rock. Explain how
this led to the formation of the waterfall. (1 x 2) (2)
3.2.7 Give ONE piece of evidence from the topographical map that
Howick receives high (summer) rainfall. (1 x 1) (1)
3.3 GEOGRAPHICAL INFORMATION SYSTEMS (GIS)
3.3.1 Will the following features be shown as point, line or polygon
features in a GIS? (a) Trigonometrical station 47 (block B1)
(b) The golf course (block E2) (2 x 1) (2)
3.3.2 Define the term data layer. (1 x 2) (2)
3.3.3 Name ONE attribute (non-spatial data) of trigonometrical
station 47 in block B1 that could be stored in a GIS. (1 x 1) (1)
3.3.4 Is the orthophoto map an example of raster or vector data? (1 x 1) (1)
[30]
TOTAL SECTION B: 30
GRAND TOTAL: 150
Copyright reserved
Study this subject
Recommended for this subject
Question paper
Geography Grade 11 P1 Eastern Cape November 2022 QP (Eng)
Question paper
Geography Grade 11 P1 Eastern Cape November 2020 QP (Eng)
Question paper
Geography Grade 11 P1 Eastern Cape November 2017 QP (Eng)
Memorandum
Geography Grade 11 P1 Eastern Cape November 2023 Memo (Eng)
Memorandum
Geography Grade 11 P1 Eastern Cape November 2022 Memo (Eng)
Addendum
Geography Grade 11 P1 Eastern Cape November 2020 Addendum
More from Grade 11 Geography
Memorandum
Geography Grade 11 P1 Eastern Cape November 2025 Memo (Eng)
Memorandum
Geography Grade 11 P2 Eastern Cape November 2025 Memo (Eng)
Question paper and memo
Geography Grade 11 Free State March Test 2025 Paper & Memo
Memorandum
Geography Grade 11 P1 Eastern Cape November 2024 Memo (Afr)
Question paper
Geography Grade 11 Paper 2 MAPS 2023 Question Paper
Question paper