
Mock
hlayiso mock exams
Practice Series:
Grade 11 Exam Preparation
WWW.HLAYISO.COM
NATIONAL
SENIOR CERTIFICATE
GRADE 11
GEOGRAPHY P2
NOVEMBER EXAMINATION 2026 (MOCK)
MARKS: 150
TIME: 3 hours
This question paper consists of 15 pages.
Copyright reserved Please turn over
Skip to contentAll 2026 papers 
View all
Geography Grade 11 P2 November Mock Exam 2 2026 QP (Eng)
Grade 11 Geography Paper 2 question paper from the November Mock Exam 2 2026 (English), 15 pages. Read online or download the free PDF.
Geography · Grade 11 · November Mock Exam 2 · 2026 · English. Question paper, 15 pages. Read online or download the PDF.
- Subject
- Geography
- Grade
- Grade 11
- Language
- English
- Document type
- Question paper
- Year
- 2026
- Exam period
- November Mock Exam 2
- Paper
- 2
- Publisher
- Hlayiso
- Curriculum
- CAPS
- Pages
- 15
- File size
- 166.2 KB
Free to read online, no sign-up needed
Loading document…
Loading document…
1 of 15
This exam
November Mock Exam 2 2026
- Paper 1Question paperAddendumMemo
- Paper 2Question paperAddendumMemo
Document textSearch extracted text and jump to a page.
Geography/P2 2 Hlayiso/Mock 2026
NSC Mock
INSTRUCTIONS AND INFORMATION
1. This question paper consists of TWO sections.
SECTION A
QUESTION 1: DEVELOPMENT GEOGRAPHY (60)
QUESTION 2: RESOURCES AND SUSTAINABILITY (60)
SECTION B
QUESTION 3: GEOGRAPHICAL SKILLS AND TECHNIQUES (30)
2. Answer ALL THREE questions.
3. ALL diagrams are included in the QUESTION PAPER.
4. Leave a line between the subsections of questions answered.
5. Start EACH question at the top of a NEW page.
6. Number the answers correctly according to the numbering system used in this question
paper.
7. Do NOT write in the margins of the ANSWER BOOK.
8. Draw fully labelled diagrams when instructed to do so.
9. Answer in FULL SENTENCES, except when you have to state, name, identify or list.
10. Units of measurement MUST be indicated in your final answer, e.g. 1 020 hPa, 14 ◦ C
and 45 m.
11. You may use a non-programmable calculator.
12. You may use a magnifying glass.
13. Write neatly and legibly.
SPECIFIC INSTRUCTIONS AND INFORMATION FOR SECTION B
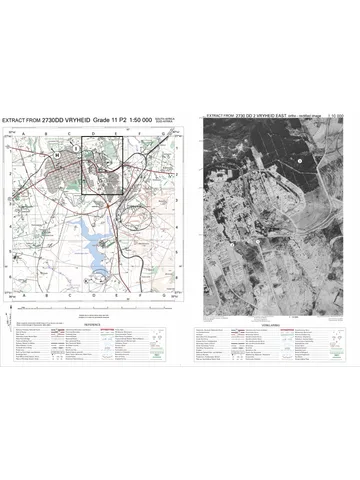
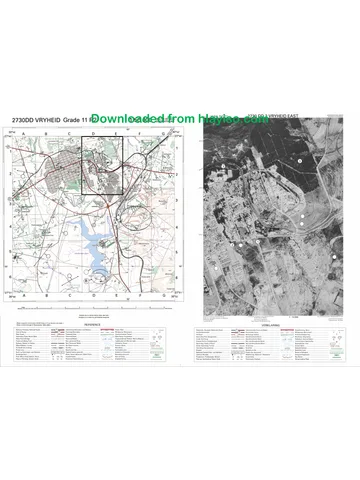
14. A topographical map extract of 2730DD VRYHEID and an orthophoto map extract
(2730DD 2 VRYHEID EAST) of a part of the mapped area are provided on one A3 sheet,
supplied with this mock as Geography Gr11 P2 Mock 2026 Map (2730DD Vryheid). The
map sheet was first used in the 2023 Eastern Cape Grade 11 November examination.
Print it on A3 paper at 100%. Map extracts reproduced from the Chief Directorate:
National Geo-spatial Information (NGI).
15. The extracts on the A3 sheet are REDUCED: they are smaller than 1 : 50 000 and 1
: 10 000. Do NOT measure distances on the sheet. Where a calculation needs a map
distance, the distance as it would be measured on a true 1 : 50 000 map is GIVEN in
the question.
16. The area demarcated in BLACK on the topographical map represents the area covered
by the orthophoto map.
17. Only the labels P, T and U are used in this question paper. Ignore the other letters and
numbers printed on the maps (H, I, J, K, L and 1 to 3).
18. Show ALL calculations. Marks will be allocated for steps in calculations.
Copyright reserved Please turn over
Geography/P2 3 Hlayiso/Mock 2026
NSC Mock
SECTION A
QUESTION 1: DEVELOPMENT GEOGRAPHY
1.1 Choose the correct word(s) from those given in brackets. Write only the
word(s) next to the question numbers (1.1.1 to 1.1.8) in the ANSWER
BOOK, e.g. 1.1.9 developing.
1.1.1 A country with a high Human Development Index (HDI), a
long life expectancy and a large tertiary sector is a (more/less)
economically developed country.
1.1.2 (Life expectancy/Gross National Income per capita) is an
economic indicator of development.
1.1.3 A Gini coefficient of 0,63 indicates (high/low) income inequality
in a country.
1.1.4 Countries such as Brazil, India and China, whose economies
have changed rapidly from mainly agricultural to industrial, are
(newly industrialised/least developed) countries.
1.1.5 In the core–periphery model, the wealthy, highly developed
region of a country is the (core/periphery).
1.1.6 Development aid given directly by the government of
one country to the government of another country is
(multilateral/bilateral) aid.
1.1.7 A (trade surplus/trade deficit) occurs when the value of a
country’s imports is greater than the value of its exports.
1.1.8 (Free/Fair) trade ensures that producers in developing
countries receive a reasonable price for their products and work
in decent conditions. (8 x 1) (8)
Copyright reserved Please turn over
Geography/P2 4 Hlayiso/Mock 2026
NSC Mock
1.2 Refer to the graph below showing the value of exports and imports of
four countries, W, X, Y and Z, and their main exports. Various options
are provided as possible answers to the following questions. Choose
the answer and write only the letter (A–D) next to the question numbers
(1.2.1 to 1.2.7) in the ANSWER BOOK, e.g. 1.2.8 D.
Value
(US$ billion)
Exports Imports
420
400
310
300
200
95 95
100
52
35 19
12
0
W X Y Z
Main exports: Main exports: Main exports: Main exports:
Machinery and cars Crude oil Coffee and cotton Gold and coal
[Source: Examiner’s own data (fictional countries)]
1.2.1 The country with the largest trade surplus is …
A W.
B X.
C Y.
D Z.
1.2.2 Country X has a … balance of trade of … US$ billion.
A positive; 17
B negative; 17
C positive; 87
D negative; 87
1.2.3 The main exports of country Y are … products.
A primary
B secondary
C tertiary
D quaternary
1.2.4 Trade between only two countries, such as country X selling
crude oil to country W and buying machinery from it, is … trade.
A bilateral
B multilateral
C internal
D barter
Copyright reserved Please turn over
Geography/P2 5 Hlayiso/Mock 2026
NSC Mock
1.2.5 A limit that a government places on the quantity of a product
that may be imported is a/an …
A tariff.
B quota.
C subsidy.
D embargo.
1.2.6 Advantages for countries that belong to a trade bloc include …
and …
(i) access to a larger market (ii) higher tariffs between members
(iii) easier movement of goods between members (iv) less
competition for local businesses
A (ii) and (iv)
B (i) and (ii)
C (iii) and (iv)
D (i) and (iii)
1.2.7 South Africa is a member of the … trade bloc.
A European Union (EU)
B Southern African Development Community (SADC)
(7 x 1) (7)
C North American Free Trade Agreement (NAFTA)
D Association of Southeast Asian Nations (ASEAN)
Copyright reserved Please turn over
Geography/P2 6 Hlayiso/Mock 2026
NSC Mock
1.3 Refer to the extract below on globalisation.
ONE CAR, MANY COUNTRIES
A multinational car company assembles 120 000 vehicles a year at
its factory in the Eastern Cape and exports most of them to more
than 40 countries. The engines come from Germany, the electronic
parts from Japan and China, and the seats and tyres from local
suppliers in Gqeberha and East London. About 4 000 people work
at the factory, and thousands more work for the local suppliers.
Decisions about which models are built, and how many, are taken at
the company’s head office overseas. When demand for cars fell in
Europe, the factory cut one shift and the suppliers lost orders.
[Source: Examiner’s own extract (fictional company)]
1.3.1 Define the term globalisation. (1 x 2) (2)
1.3.2 According to the extract, to how many countries are the vehicles
exported? (1 x 1) (1)
1.3.3 Give TWO benefits of the factory for the Eastern Cape
mentioned in the extract. (2 x 1) (2)
1.3.4 Explain how depending on multinational companies can make
developing countries such as South Africa economically
vulnerable. (2 x 2) (4)
1.3.5 Suggest ways in which small local businesses in South Africa
can benefit from globalisation. (3 x 2) (6)
1.4 Refer to the extract below on humanitarian aid.
CYCLONE LEAVES THOUSANDS HOMELESS
A tropical cyclone struck the coast of a low-income country in
southern Africa, flooding towns and destroying 30 000 homes, roads
and bridges. Within days, United Nations agencies,
non-governmental organisations (NGOs) and neighbouring SADC
countries sent food parcels, tents, water-purification tablets and
medical teams. Aid convoys were delayed because bridges had
been washed away, and some supplies were stolen before they
reached the people. Six months later most of the aid workers had
left, and many families were still living in tents because there was
no money to rebuild.
[Source: Examiner’s own extract (fictional event)]
1.4.1 What is humanitarian aid? (1 x 2) (2)
1.4.2 Name ONE type of organisation that provided aid, according to
the extract. (1 x 1) (1)
1.4.3 Give TWO examples of humanitarian aid mentioned in the
extract. (2 x 1) (2)
1.4.4 Explain why humanitarian aid is regarded as short-term aid. (1 x 2) (2)
Copyright reserved Please turn over
Geography/P2 7 Hlayiso/Mock 2026
NSC Mock
1.4.5 In a paragraph of approximately EIGHT lines, explain how
long-term development aid (including technical aid) could
reduce the impact of future cyclones on this country. (4 x 2) (8)
1.5 Refer to the extract below on a community project.
VILLAGE TURNS WASTE INTO WORK
Young people in a village in the Eastern Cape were tired of plastic
and glass lying in the streams and on the grazing land. At a
community meeting the residents decided to start a recycling
project. The municipality gave them land for a sorting yard, and an
NGO trained 25 members, most of them young women, to sort
waste, keep records and make paving bricks from crushed glass
and plastic. The members now earn an income and the streams are
cleaner. However, the NGO’s funding ends next year, the project’s
only truck often breaks down and the price paid for recycled plastic
changes from month to month.
[Source: Examiner’s own extract (fictional project)]
1.5.1 Define the term community-based development. (1 x 2) (2)
1.5.2 Who gave the land for the sorting yard, according to the extract? (1 x 1) (1)
1.5.3 Give TWO ways in which the project benefits the environment
of the village. (2 x 1) (2)
1.5.4 Explain how the support from the municipality and the NGO
contributed to the success of the project. (2 x 2) (4)
1.5.5 Suggest how the project could remain sustainable after the
NGO’s funding ends. (3 x 2) (6)
[60]
Copyright reserved Please turn over
Geography/P2 8 Hlayiso/Mock 2026
NSC Mock
QUESTION 2: RESOURCES AND SUSTAINABILITY
2.1 Complete the statements in COLUMN A with the options in COLUMN
B. Write only Y or Z next to the question numbers (2.1.1 to 2.1.8) in the
ANSWER BOOK, e.g. 2.1.9 Y.
COLUMN A COLUMN B
2.1.1 Water, soil, minerals and forests Y natural
that occur in nature and are used Z human-made
by people are … resources.
2.1.2 The upper layer of the soil profile Y subsoil
that contains most of the humus is Z topsoil
the …
2.1.3 The washing of nutrients Y leaching
downwards out of the topsoil Z salinisation
by water is …
2.1.4 The build-up of salts in the soil as Y leaching
a result of poor irrigation methods Z salinisation
is …
2.1.5 Leaving a field uncultivated for a Y monoculture
season so that it can recover its Z fallowing
fertility is …
2.1.6 Energy obtained from the heat Y geothermal
inside the earth is … energy. Z biomass
2.1.7 The total amount of greenhouse Y carbon sink
gases produced by the activities of Z carbon footprint
a person is the …
2.1.8 Planned interruptions of the Y load shedding
electricity supply to prevent the Z a power surge
national grid from collapsing are
known as …
(8 x 1) (8)
Copyright reserved Please turn over
Geography/P2 9 Hlayiso/Mock 2026
NSC Mock
2.2 Refer to the sketch map below showing the location of selected
electricity-generating facilities, 1 to 5, in South Africa. Various options
are provided as possible answers to the following questions. Choose
the answer and write only the letter (A–D) next to the question numbers
(2.2.1 to 2.2.7) in the ANSWER BOOK, e.g. 2.2.8 D.
KEY
1 Power station near Cape Town
2 Facilities near Upington
3 Facilities near Jeffreys Bay
4 Gariep Dam
5 Power stations on the
Mpumalanga Highveld
5
2
N
Lesotho
4
SOUTH AFRICA
Atlantic
Ocean
1 3
Indian Ocean
[Source: Examiner’s own sketch (not to scale; positions approximate)]
2.2.1 The facility at 1 produces electricity from …
A coal.
B uranium.
C natural gas.
D falling water.
2.2.2 The facility located closest to South Africa’s main coalfields is
facility …
A 1.
B 2.
C 4.
D 5.
2.2.3 At 4, electricity is generated by …
A burning biomass.
B heat from inside the earth.
C falling water turning turbines.
D sunlight falling on photovoltaic panels.
Copyright reserved Please turn over
Geography/P2 10 Hlayiso/Mock 2026
NSC Mock
2.2.4 The energy sources used at 2 and 3 are …
A conventional and non-renewable.
B non-conventional and renewable.
C conventional and renewable.
D non-conventional and non-renewable.
2.2.5 Disadvantages of the type of power station at 1 are … and …
(i) radioactive waste (ii) very high building costs (iii) large
carbon dioxide emissions (iv) dependence on wind
A (ii) and (iii)
B (iii) and (iv)
C (i) and (ii)
D (i) and (iv)
2.2.6 The facility whose electricity production would be reduced most
by a long drought is facility …
A 1.
B 2.
C 3.
D 4.
2.2.7 The facility that can produce electricity day and night and does
NOT depend on the weather or on rainfall is facility …
A 1.
B 2.
(7 x 1) (7)
C 3.
D 4.
Copyright reserved Please turn over
Geography/P2 11 Hlayiso/Mock 2026
NSC Mock
2.3 Refer to the graph below showing the results of a soil-loss experiment
on four plots on the same slope in KwaZulu-Natal.
Soil loss
(tonnes per hectare per year)
25
25
20 18
15
10
5 3
0,5
0
PLOT 1 PLOT 2 PLOT 3 PLOT 4
Natural grassland Overgrazed communal Maize ploughed up Maize ploughed
grazing land and down the slope along the
contours; crop residue
left on the field
[Source: Examiner’s own data (fictional experiment)]
2.3.1 Which plot had the highest soil loss? (1 x 1) (1)
2.3.2 Calculate how many times more soil was lost on Plot 3 than on
Plot 4. Show your calculation. (2 x 1) (2)
2.3.3 Explain why Plot 4 lost much less soil than Plot 3. (1 x 2) (2)
2.3.4 State TWO negative effects of the soil loss on Plot 3 for the
farmer. (2 x 1) (2)
2.3.5 In a paragraph of approximately EIGHT lines, suggest
sustainable strategies that the community could use to reduce
soil erosion on the communal grazing land (Plot 2) and to
restore the land. (4 x 2) (8)
Copyright reserved Please turn over
Geography/P2 12 Hlayiso/Mock 2026
NSC Mock
2.4 Refer to the extract below on coal-fired electricity in South Africa.
OLD POWER STATIONS, NEW PROBLEMS
More than 80% of South Africa’s electricity still comes from
coal-fired power stations, most of them more than 30 years old.
Frequent breakdowns at these ageing stations were the main cause
of the severe load shedding of 2022 and 2023. Shops, farms and
factories lost production, food went off in fridges and many small
businesses had to buy diesel generators. The government plans to
close several of the oldest power stations over the next 20 years
and replace them with renewable energy. Coal-mining towns are
worried about what will happen to their jobs. The plan to move to
cleaner energy in a fair way that protects workers and communities
is called the Just Energy Transition.
[Source: Examiner’s own summary based on news reports]
2.4.1 Define the term energy crisis. (1 x 2) (2)
2.4.2 According to the extract, what was the main cause of the load
shedding of 2022 and 2023? (1 x 1) (1)
2.4.3 Give TWO effects of load shedding on businesses mentioned
in the extract. (2 x 1) (2)
2.4.4 Explain why South Africa still relies on coal to generate most of
its electricity, despite the environmental problems it causes. (2 x 2) (4)
2.4.5 Explain the social and economic challenges that coal-mining
communities could face when coal-fired power stations close. (3 x 2) (6)
Copyright reserved Please turn over
Geography/P2 13 Hlayiso/Mock 2026
NSC Mock
2.5 Refer to the extract below on solar energy.
THE ROOFTOP SOLAR BOOM
During the years of load shedding, thousands of households,
schools and businesses installed photovoltaic (PV) panels and
batteries on their properties. Many owners say they wanted
electricity during power cuts and lower monthly electricity bills. A
complete system with batteries can cost more than R100 000, which
poor households cannot afford. The panels produce little electricity
on cloudy days and none at night, and old batteries contain
chemicals that must be disposed of safely. In some municipalities,
owners may sell the extra electricity that they produce back to the
grid.
[Source: Examiner’s own extract based on news reports]
2.5.1 Define the term renewable energy. (1 x 2) (2)
2.5.2 According to the extract, give ONE reason why owners installed
PV panels. (1 x 1) (1)
2.5.3 Give TWO disadvantages of rooftop solar systems mentioned
in the extract. (2 x 1) (2)
2.5.4 Explain how the increased use of rooftop solar panels benefits
the national electricity grid and the environment. (2 x 2) (4)
2.5.5 Suggest how the government could make solar energy more
affordable for low-income households. (3 x 2) (6)
[60]
TOTAL SECTION A: 120
Copyright reserved Please turn over
Geography/P2 14 Hlayiso/Mock 2026
NSC Mock
SECTION B
QUESTION 3: GEOGRAPHICAL SKILLS AND TECHNIQUES
GENERAL INFORMATION ON VRYHEID
Co-ordinates: 27◦ 46′ S; 30◦ 48′ E
Vryheid is a town in northern KwaZulu-Natal and the main service centre of the Abaqulusi
Local Municipality. The surrounding farms produce cattle, maize and timber, and coal has
been mined in the district for more than a century. Railway lines through the town carry
coal and timber towards the port of Richards Bay, and the R33, R34 and R69 routes meet
in the town. The area receives most of its rain in summer, often as thunderstorms, and
winters are cool and dry.
[Examiner’s own summary]
3.1 MAP SKILLS AND CALCULATIONS
Various options are provided as possible answers to QUESTIONS 3.1.1
and 3.1.2. Choose the answer and write only the letter (A–D) next to the
question numbers in the ANSWER BOOK.
3.1.1 The index of the 1 : 50 000 map sheet directly NORTH of
2730DD is …
A 2730DB B 2730DC C 2730BD D 2731CA (1 x 1) (1)
3.1.2 The contour interval of the orthophoto map is …
A 10 m B 20 m C 5m D 100 m (1 x 1) (1)
3.1.3 Calculate the average gradient from trigonometrical station 60
(Besterkop) in block G3 to spot height 1209 in block F4 on the
topographical map. The distance between the two points on a
1 : 50 000 map is 3,0 cm.
Vertical Interval (VI)
Use the formula: Gradient = (4 x 1) (4)
Horizontal Equivalent (HE)
3.1.4 Use the information below the topographical map to calculate
the magnetic declination of Vryheid for July 2026. Show ALL
calculations.
Difference in years:
Mean annual change: 4′ westwards
(3 x 1) (3)
Total change:
Magnetic declination for 2026:
3.1.5 The area covered by the orthophoto map is demarcated in
BLACK on the topographical map. On a 1 : 50 000 map this
rectangle is 8,3 cm long and 5,8 cm wide. Calculate the area
(in km2 ) covered by the orthophoto map.
Use the formula: Area = Length (L) × Breadth (B) (3 x 1) (3)
Copyright reserved Please turn over
Geography/P2 15 Hlayiso/Mock 2026
NSC Mock
3.2 MAP INTERPRETATION
3.2.1 Choose the correct answer and write only the letter (A–D).
The feature labelled T in block A5 on the topographical map is
a…
A railway line.
B power line.
(1 x 1) (1)
C fence.
D hiking trail.
3.2.2 A company wants to build a solar farm in blocks B5 and B6 on
the topographical map. Give TWO pieces of evidence from the
map that this area is suitable for a solar farm. (2 x 1) (2)
3.2.3 Refer to U in block F5 on the topographical map. Name the type
of soil erosion represented by the erosion symbol at U. (1 x 1) (1)
3.2.4 Explain how the slope of the hill eNtendekwana (block F5)
contributes to the soil erosion at U. (1 x 2) (2)
3.2.5 Identify the soil conservation method used on the cultivated
fields at P on the orthophoto map. (1 x 1) (1)
3.2.6 Explain ONE negative impact that the soil erosion at U could
have on the farming activities at Beaufort (block F5). (1 x 2) (2)
3.2.7 Refer to the Vryheid Nature Reserve on Lancaster Hill (block
B1) on the topographical map. Explain how protecting the
natural vegetation on these slopes conserves the soil. (1 x 2) (2)
3.2.8 Vryheid has a well-developed tertiary sector. Name ONE
tertiary (service) feature in block C2 on the topographical map. (1 x 1) (1)
3.3 GEOGRAPHICAL INFORMATION SYSTEMS (GIS)
3.3.1 Choose the correct answer and write only the letter (A–D).
In a GIS, the feature labelled T in block A5 on the topographical
map will be represented as a … feature.
A point B line C polygon D raster (1 x 1) (1)
3.3.2 Define the term remote sensing. (1 x 2) (2)
3.3.3 Explain how satellite images taken over a number of years
could help the municipality to manage the soil erosion at U. (1 x 2) (2)
3.3.4 The name Besterkop and the height 1 430,9 m of
trigonometrical station 60 in block G3 are examples of
(spatial/attribute) data. Write only the correct word. (1 x 1) (1)
[30]
TOTAL SECTION B: 30
GRAND TOTAL: 150
Copyright reserved
Study this subject
Recommended for this subject
Question paper
Geography Grade 11 P2 Eastern Cape November 2022 QP (Eng)
Question paper
Geography Grade 11 P2 Eastern Cape November 2018 QP (Eng)
Memorandum
Geography Grade 11 P2 Eastern Cape November 2025 Memo (Eng)
Memorandum
Geography Grade 11 P2 Eastern Cape November 2022 Memo (Eng)
Addendum
Geography Grade 11 P2 Eastern Cape November 2020 Addendum
Memorandum
Geography Grade 11 P2 Eastern Cape November 2020 Memo (Eng)
More from Grade 11 Geography
Memorandum
Geography Grade 11 P1 Eastern Cape November 2025 Memo (Eng)
Question paper and memo
Geography Grade 11 Free State March Test 2025 Paper & Memo
Memorandum
Geography Grade 11 P1 Eastern Cape November 2024 Memo (Afr)
Memorandum
Geography Grade 11 P1 Eastern Cape November 2023 Memo (Eng)
Question paper
Geography Grade 11 Paper 2 MAPS 2023 Question Paper
Question paper