
C
).
Downloaded from hlayiso.com
EXAMINER
MODERATOR
INSTRUCTIONS :
Page 1 of 6
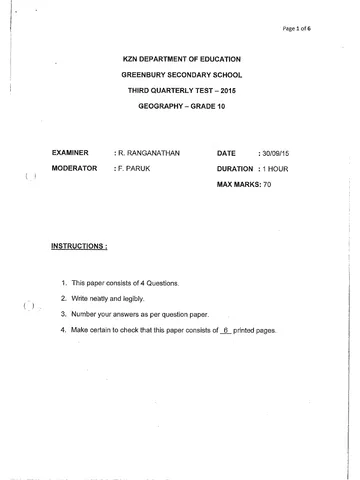
KZN DEPARTMENT OF EDUCATION
GREENBURY SECONDARY SCHOOL
THIRD QUARTERLY TEST — 2015
GEOGRAPHY - GRADE 10
: R. RANGANATHAN DATE 2 30/09/15
: F. PARUK DURATION :1HOUR
MAX MARKS: 70
1. This paper consists of 4 Questions.
2. Write neatly and legibly.
3. Number your answers as per question paper.
4, Make certain to check that this paper consists of _6_ printed pages.
Skip to content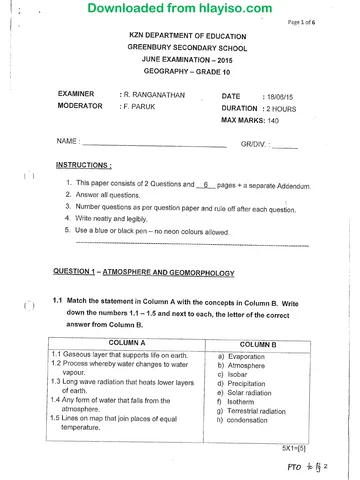
View all
Geography Grade 10 September Test 2015 Paper & Memo
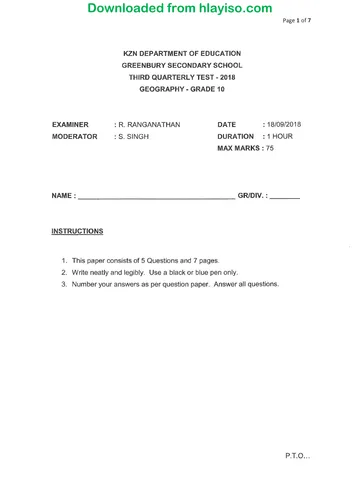
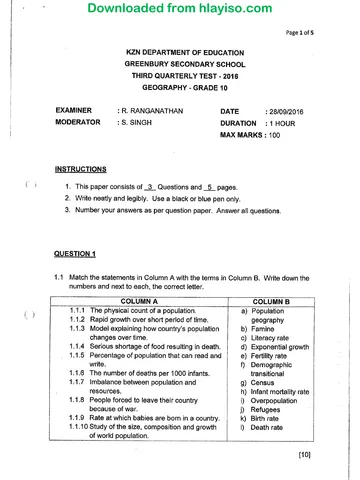
Grade 10 Geography question paper and memo from the September Test 2015, 10 pages. Read online or get the free PDF download.
Geography · Grade 10 · September Test · 2015. Question paper and memorandum, 10 pages. Read online or download the PDF.
- Subject
- Geography
- Grade
- Grade 10
- Document type
- Question paper and memo
- Year
- 2015
- Exam period
- September Test
- Curriculum
- CAPS
- Pages
- 10
- File size
- 890.4 KB
Free to read online, no sign-up needed
Loading document…
Loading document…
1 of 10
Document textSearch extracted text and jump to a page.
Downloaded from hlayiso.com
QUESTION 1
Page 2 of 6
Match the statement in Column A with the terms in Column B. Write down the
numbers and only the letter of the correct alphabet from column B
COLUMN A COLUMN B
1.1 The way a population is spread. a) Immigration
41.2 Average number of people per square b) Emigration
kilometre. . c) Xenophobia
1.3 The movement of people away from their d) Birth rate
home country. e) Population distribution
1.4 The average no. of births in a country. f) Refugees
1.5 People who are forced to flee their horne g) Population density
country. h) Fertility rate
1.6 A strong dislike of people from other i) Birth rate
countries. j) Population pyramid
1.7 Graphical representation of a country’s age- k) Population indicators
sex structure.
1.8 Facts and figures about the structure of a
population.
1.9 The extent to which an adult group supports
the young.
1.10 The average nurnber of children a woman
will have.
Dependency ratio
40X1 = [10]
Downloaded from hlayiso.com
QUESTION 2
Page 3 of 6
2.1 Refer to the satellite image and the map of the USA in sources 1A and 1B and
answer the questions that follow.
Source JA
Source |B
| Suit of Mexico
on
oe
25 —~ 50 50—100 100-250 25067 000]
Ls
No of pepe per kim®
From the information above, how would you describe the distribution
of the population of the USA?
Is the population density higher on the east or west side of the USA?
Suggest 2 possible reasons for your answer.
Name the GIS instrument that was used to capture the satellite image
of the United States.
14+2X2>|
[2]
[5]
[2]
[9]
Downloaded from hlayiso.com
2.2 Refer to the Case Study (Source 2A) —
Africa and answer the questions that follow.
Sources 2A
Page 4 of 6
Effects of voluntary migration from South
Case study: Effects of voluntary migration from South Africa
Fleeing from South Africa: why are the best and brightest leaving
Africa’s most successful state?
14 Febfuary 2009
The South African government ©
doesn’t keep ¥ reliable emigration
statistics. But a number of tecent
independent Studies. show that
mass departures from, South Afriéa °
are ongoing and are sapping the
nation 6f its skilled and best- °
educated young citizens, The most
dramatic figures can be found -
among South African ' Whites,
Some: 800000 out ofa total white
population of 4 million have
_ deft-since 1995, by one count.’
But Black South Afticans are also’
expressing the desiré to leave. In
the last.12 years, the huphber of ©
2.2.4
2.2.2
2.2.3
“tegistered accountants, ‘a quarter:
now live overséas, Engineers, 0°:
blacks graduating in South Africa
with advanced degrees has grown
fromi 361 000 to 1,4 million a year.
. But in that time the number of
those expiessing high Hopes to
emigrate has doubled. As growing
ntimbers of these graduates express:
a desire ‘to emigrate, the prospects
for coritinued black economic:
empowerment are dimming,
Of the country’s 25.000
doctors, nurses and accountants
-. areal ini increasingly short
supply. South Africa’s doctors are
Explain your understanding of “Voluntary Migration’.
Which race group of people are mostly leaving South Africa?
Why do you think it is mostly that particular race group (answer 2.2.3)
that is leaving South Africa?
2.2.4
South Africa.
2.2.5
2.2.6
2.2.7
economy.
2.2.8
Name 2 countries that they are moving to.
What are the main reasons for this movement?
Discuss the effects that this movement can have on the South African
are being poached”?
“constantly being poached” by
“places like Canada, Australia and.
the United States (Minister Hogan,
: 2009), Banks and investment ;
contipaiiies are forced to look for
talent, overseas, and Eskom has.
recently begun scrambling to
attract electrical, enginecrs back.
~- home, but with little success.”
» The primary driver for.’
[2]
[1]
[2]
Describe the type of professions of people that are generally leaving
[2]
[2]
2X2=[4]
2X2=[4]
What did former minister Hogan mean when she said that “our doctors
[2]
[19]
=) emigration among all groups i ise
“) fear of ctime and pressing national
“concerns like energy," ' ee
“(adapted from: s. Johnsén, "Fleeing.
“from South Africa”, Newsweek, 14
a February 2008).
(3
Downloaded from hlayiso.com
QUESTION 3
Page 5 of 6
Refer to the table below (Source 3A) comparing South Africa’s and Japan’s
population indicators and answer the questions that follow.
Source 3A
The following table shows some population indicators for South Africa and
Japan in 2010:
Population indicator”. “| South Afelea. Japan ee
% population under 15 years 28,48 13,12
% population over 65 years 5,69 22,88
Average life expectancy 49,33 82,25
Fertility rate 2,30 1,24 |
between South Africa and Japan.
Use the information from the case study on Japan to explain these differences
3.1. Explain your understanding of the term “average life expectancy”.
3.2 What is the term used to describe the population under 15 yrs and over
65 yrs?
3.3 State which country has
a) Higher fertility rate
b) Higher % of the population over 65 yrs.
3.4 The average life expectancy of Japan is considerably higher than that of
South Africa. Provide 2 reasons for Japan’s high life expectancy.
3.5 South Africa has a higher percentage of population under 15 yrs.
Suggest 2 negative consequences / effects of this high percentage on
the economy of the country.
[2]
[2]
[2]
[2]
2X2=[4]
2X2=[4]
[16]
Downloaded from hlayiso.com
Page 6 of 6
QUESTION 4
Refer to the Population pyramids below (Source 4A) and answer the questions that
follow.
Source 4A
.) Kenya — . Age group Agegroup.
i : ss, Be
ob 79.
joc pont 7
65-69 ic
: 60~64
$os9 S89
50-54 “5054
45-49 45-49
40-44 40-44
35039: 35-39
30-34 30-34
25-29 25-29
20-24 20-24
1Se19 | 15-19
10—14, 10-14
52.9 5-9
: : 0-4 On4 :
4°20:2 46 81012141618 ~ ° 18161412108 6 42024 6 8 1012141618
J femiles (%) > males (%) females (%) .
4.1 Name the country with the :
a) Higher birth rate [1]
b) Lower birth rates [1]
c) Higher dependency ration [1]
d) Higher life expectancy [1]
4,2 Which of the 2 countries is a LEDC? [2]
Provide 2 reasons for your answer. 2X2=[4]
4.3 Suggest 2 ways in which the country in question, (answer 4.3) can
improve its economy. 3X2=(6]
[16]
TOTAL = [70]
Downloaded from hlayiso.com
Code, Io ~ Gesgua pol .
eS ee
ate. Hale onthe fase sick
1 (0) fel Houde on te, Wal ath» Shep otf. « eu A
(y. Bolter “whasheclue on eat well clevelopesh
Eat cook hare fume mdm oP bral lly moot et.
218 Rewete Soe Zo
Pak Mgreten treyh war cw ebvie. Ow ¢ uel Peed ty 7
—tnpate- op Sicause of folteal stably /umeet /ucleice ek.
—_aas~ Cavode /huobla FUME
yh wiped —» Poeseuoh leave. —> ram trem ~
surety cnomtenhintec rene nenmidhan nish ane mrontceenenn ana inane nent em ma aneaN nematic 2 en
Downloaded from hlayiso.com
7 928. Car chetore ae bg ‘pared a Meany . lay aie.
_oppeacled fp vert. oierceag — Toy are. peti |
aed ‘wconves — Hace. feng atch.
Belew ‘edneat abort health, Tuudl ig ek.
Downloaded from hlayiso.com
Qhvotiws 4.
= be inated =e
& " et cen nbaceplives . - oe
Downloaded from hlayiso.com
Study this subject
Recommended for this subject
Question paper and memo
Geography Grade 10 Paper 1 KZN June 2015 Paper & Memo
Question paper and memo
Geography Grade 10 Paper 2 KZN June 2015 Paper & Memo
Question paper and memo
Geography Grade 10 March Test 2015 Paper & Memo
Question paper and memo
Geography Grade 10 NSC Prelim 2015 Paper & Memo
Question paper and memo
Geography Grade 10 September Test 2018 Paper & Memo
Question paper and memo
Geography Grade 10 September Test 2016 Paper & Memo
More from Grade 10 Geography
Study guide
Gr10 Geografie OG studyguide LR
Annual teaching plan
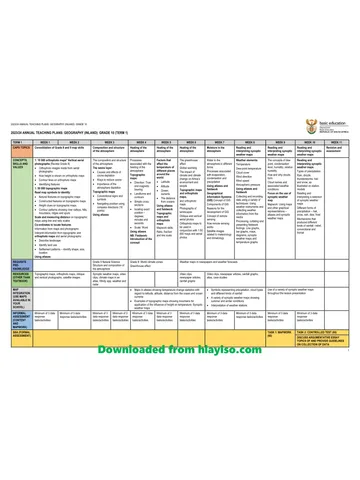
Gr 10 Geo ATP 2023 24
Question paper
Geography Grade 10 P1 North West November 2024 QP (Eng)
Question paper
Geography Grade 10 P2 North West November 2024 QP (Eng)
Question paper
Geography Grade 10 Gauteng March Test 2023 QP (Afr)
Question paper