
Mock
hlayiso mock exams
Practice Series:
Grade 10 Exam Preparation
WWW.HLAYISO.COM
NATIONAL
SENIOR CERTIFICATE
GRADE 10
GEOGRAPHY P2
NOVEMBER EXAMINATION 2026 (MOCK)
MARKS: 150
TIME: 3 hours
This question paper consists of 16 pages.
Copyright reserved Please turn over
Skip to contentAll 2026 papers 
View all
Geography Grade 10 P2 November Mock 2026 QP (Eng)
Grade 10 Geography Paper 2 question paper from the November Mock Exam 2026 (English), 16 pages. Read online or download the free PDF.
Geography · Grade 10 · November Mock Exam · 2026 · English. Question paper, 16 pages. Read online or download the PDF.
- Subject
- Geography
- Grade
- Grade 10
- Language
- English
- Document type
- Question paper
- Year
- 2026
- Exam period
- November Mock Exam
- Paper
- 2
- Publisher
- Hlayiso
- Curriculum
- CAPS
- Pages
- 16
- File size
- 167.7 KB
Free to read online, no sign-up needed
Loading document…
Loading document…
1 of 16
This exam
November Mock Exam 2026
- Paper 1Question paperAddendumMemo
- Paper 2Question paperAddendumMemo
Document textSearch extracted text and jump to a page.
Geography/P2 2 Hlayiso/Mock 2026
NSC Mock
INSTRUCTIONS AND INFORMATION
1. This question paper consists of TWO sections.
SECTION A
QUESTION 1: POPULATION (60)
QUESTION 2: WATER RESOURCES (60)
SECTION B
QUESTION 3: GEOGRAPHICAL SKILLS AND TECHNIQUES (30)
2. Answer ALL THREE questions.
3. ALL diagrams are included in the QUESTION PAPER.
4. Leave a line between the subsections of questions answered.
5. Start EACH question at the top of a NEW page.
6. Number the answers correctly according to the numbering system used in this question
paper.
7. Do NOT write in the margins of the ANSWER BOOK.
8. Draw fully labelled diagrams when instructed to do so.
9. Answer in FULL SENTENCES, except when you have to state, name, identify or list.
10. Units of measurement MUST be indicated in your final answer, e.g. 1 020 hPa, 14 ◦ C
and 45 m.
11. You may use a non-programmable calculator.
12. You may use a magnifying glass.
13. Write neatly and legibly.
SPECIFIC INSTRUCTIONS AND INFORMATION FOR SECTION B
14. An extract from the 1 : 50 000 topographical map 2530BD MBOMBELA and an extract
from the 1 : 10 000 orthophoto map 2530BD 25 MBOMBELA are provided on one
A3 sheet, supplied with this mock as Geography Gr10 P2 Mock 2026 Map (2530BD
Mbombela). The map sheet was first used in the 2022 Eastern Cape Grade 12
preparatory examination. Print it on A3 paper at 100% (actual size).
15. The area demarcated in RED on the topographical map represents the area covered
by the orthophoto map.
16. Ignore the letters and numbers already printed on the maps (e.g. F, G, J, K and 2),
unless a question refers to them.
17. Show ALL calculations. Marks will be allocated for steps in calculations.
Copyright reserved Please turn over
Geography/P2 3 Hlayiso/Mock 2026
NSC Mock
SECTION A: POPULATION AND WATER RESOURCES
QUESTION 1: POPULATION
1.1 Choose ONE term from the list below that matches each of the
descriptions that follow. Write only the term next to the question numbers
(1.1.1 to 1.1.8) in the ANSWER BOOK, e.g. 1.1.9 emigration.
fertility rate; census; life expectancy; immigration; natural
increase; refugee; brain drain; population distribution; population
density; emigration
1.1.1 The average number of children that a woman is expected to
have during her lifetime
1.1.2 An official count of all the people living in a country at a specific
time
1.1.3 The average number of years that a person born in a country
is expected to live
1.1.4 The movement of people into a country to live there
permanently
1.1.5 The difference between the birth rate and the death rate
1.1.6 A person who is forced to flee his or her country because of war
or persecution
1.1.7 The loss of skilled and highly educated people from a country
1.1.8 The way in which people are spread out over an area (8 x 1) (8)
Copyright reserved Please turn over
Geography/P2 4 Hlayiso/Mock 2026
NSC Mock
1.2 Refer to the graph below showing the demographic transition model
(DTM). Various options are provided as possible answers to the following
questions. Choose the answer and write only the letter (A–D) next to the
question numbers (1.2.1 to 1.2.7) in the ANSWER BOOK, e.g. 1.2.8 D.
50
STAGE 1 STAGE 2 STAGE 3 STAGE 4
Birth rate and death rate
40 birth rate
total population
30 natural
increase
(per 1 000 per year)
20
death rate
10
0
[Source: Examiner’s own sketch (simplified)]
1.2.1 In stage 1 the birth rate and the death rate are both …
A low.
B high.
C falling quickly.
D rising quickly.
1.2.2 The death rate falls sharply in stage 2 mainly because of …
A better health care, clean water and improved food supply.
B an increase in the number of wars.
C more women going to work.
D an ageing population.
1.2.3 The population grows fastest in stage …
A 1.
B 2.
C 3.
D 4.
1.2.4 The birth rate falls in stage 3 because …
A more children die before the age of five.
B families need many children to work on farms.
C family planning is used more and more women are
educated and employed.
D medical care is not available.
1.2.5 In stage 4 the natural increase is …
A very high.
B high.
C increasing quickly.
D very low.
Copyright reserved Please turn over
Geography/P2 5 Hlayiso/Mock 2026
NSC Mock
1.2.6 South Africa is presently in stage … of the DTM.
A 1
B 2
C 3
D 4
1.2.7 Countries in stage 4, such as Japan, have … population.
A a young
B an ageing
(7 x 1) (7)
C a rapidly growing
D a mainly male
Copyright reserved Please turn over
Geography/P2 6 Hlayiso/Mock 2026
NSC Mock
1.3 Refer to the population pyramid of Country X below.
MALES Age (years) FEMALES
1.0 65+ 1.4
0.8 60–64 0.9
1.0 55–59 1.2
1.3 50–54 1.5
1.7 45–49 1.8
2.2 40–44 2.3
2.7 35–39 2.8
3.3 30–34 3.5
4.1 25–29 4.2
4.9 20–24 4.9
5.6 15–19 5.5
6.4 10–14 6.3
7.0 5–9 6.8
7.6 0–4 7.3
8 6 4 2 0 0 2 4 6 8
Percentage of total population Percentage of total population
[Source: Examiner’s own data (fictional country)]
1.3.1 What is a population pyramid? (1 x 2) (2)
1.3.2 Is the population pyramid of Country X progressive or
regressive? (1 x 1) (1)
1.3.3 Which age group has the largest percentage of the population? (1 x 1) (1)
1.3.4 Calculate the total percentage of the population of Country X
that is younger than 15 years. Show your calculation. (2 x 1) (2)
1.3.5 In which stage of the demographic transition model is Country
X most likely to be? (1 x 1) (1)
1.3.6 Give evidence from the pyramid that females live longer than
males in Country X. (1 x 2) (2)
1.3.7 Explain why the base of the population pyramid of Country X is
wide. (3 x 2) (6)
Copyright reserved Please turn over
Geography/P2 7 Hlayiso/Mock 2026
NSC Mock
1.4 Refer to the extract below on population movement.
LEAVING THE VILLAGE FOR THE CITY
Lindiwe (19) grew up in a small village in the Eastern Cape. After
finishing Grade 12 she could not find work. The nearest clinic is 25
km away, the local school has no science laboratory and the family’s
maize field has produced very little in the past three dry years. Last
month she moved to Johannesburg, where her cousin promised to
help her find a job in a shop. She also hopes to study part-time at a
college. Lindiwe now shares a small backyard room with three other
people. “Life in the city is expensive and crowded,” she says, “but
here I have a chance.” Every month thousands of young people
make the same move from rural areas to the cities of Gauteng.
[Source: Examiner’s own extract (fictional person)]
1.4.1 Define the term rural–urban migration. (1 x 2) (2)
1.4.2 Give TWO push factors from the extract that caused Lindiwe to
leave her village. (2 x 1) (2)
1.4.3 Give TWO pull factors from the extract that attracted Lindiwe to
Johannesburg. (2 x 1) (2)
1.4.4 Is Lindiwe’s move an example of voluntary or forced migration? (1 x 1) (1)
1.4.5 In a paragraph of approximately EIGHT lines, discuss the
negative impact of rural–urban migration on the rural areas that
people leave behind. (4 x 2) (8)
Copyright reserved Please turn over
Geography/P2 8 Hlayiso/Mock 2026
NSC Mock
1.5 Refer to the table below showing the population and area of four South
African provinces.
Province Population (2022) Area (km2 ) Population density
(people per km2 )
Gauteng 15 100 000 18 178 831
KwaZulu-Natal 12 400 000 94 361 131
Mpumalanga 5 100 000 76 495 67
Northern Cape 1 360 000 372 889 ?
[Source: Adapted from Statistics South Africa, Census 2022 (rounded figures)]
1.5.1 Define the term population density. (1 x 2) (2)
1.5.2 Which province in the table is the most densely populated? (1 x 1) (1)
1.5.3 Calculate the population density of the Northern Cape. Show
your calculation.
Total population
Formula: Population density = (2 x 1) (2)
Area (km2 )
1.5.4 Explain how physical (natural) factors cause the low population
density of the Northern Cape. (2 x 2) (4)
1.5.5 Explain how human factors cause the high population density
of Gauteng. (2 x 2) (4)
1.5.6 Explain ONE problem caused by the high population density in
Gauteng. (1 x 2) (2)
[60]
Copyright reserved Please turn over
Geography/P2 9 Hlayiso/Mock 2026
NSC Mock
QUESTION 2: WATER RESOURCES
2.1 Complete the statements in COLUMN A with the options in COLUMN
B. Write only Y or Z next to the question numbers (2.1.1 to 2.1.8) in the
ANSWER BOOK, e.g. 2.1.9 Y.
COLUMN A COLUMN B
2.1.1 Most of the earth’s water is found Y rivers and lakes
in the … Z oceans
2.1.2 Water stored underground in the Y groundwater
pores and cracks of rocks is … Z runoff
2.1.3 A large body of water stored Y estuary
behind a dam wall is a/an … Z reservoir
2.1.4 Water that is safe to drink is … Y potable
water. Z grey
2.1.5 The process of removing salt from Y desalination
sea water is … Z irrigation
2.1.6 The mean annual rainfall of South Y higher
Africa is … than the world average. Z lower
2.1.7 The economic sector that uses the Y mining
most water in South Africa is … Z agriculture
(irrigation)
2.1.8 Used water from baths, basins Y grey
and washing machines that can be Z potable
re-used for gardens is … water.
(8 x 1) (8)
Copyright reserved Please turn over
Geography/P2 10 Hlayiso/Mock 2026
NSC Mock
2.2 Refer to the sketch map below showing ocean currents around South
Africa. Various options are provided as possible answers to the following
questions. Choose the answer and write only the letter (A–D) next to the
question numbers (2.2.1 to 2.2.7) in the ANSWER BOOK, e.g. 2.2.8 D.
N
cold current
warm current
A
B
Atlantic Ocean
Indian Ocean
[Source: Examiner’s own sketch map]
2.2.1 Ocean current A is the … Current.
A Agulhas
B Mozambique
C Benguela
D Gulf Stream
2.2.2 Ocean current B is the … Current.
A Agulhas
B Benguela
C Humboldt
D Canary
2.2.3 Ocean current A is a … current that flows …
A warm; southwards
B cold; northwards
C warm; northwards
D cold; southwards
2.2.4 The west coast of South Africa is dry because the cold current
…
A warms the air above it so that it rises.
B cools the air above it so that it does not rise to form rain
clouds.
C brings moist air onto the land.
D causes thunderstorms over the coast.
Copyright reserved Please turn over
Geography/P2 11 Hlayiso/Mock 2026
NSC Mock
2.2.5 Coastal fog forms along the west coast when …
A warm, moist air moves over the cold ocean current and
cools.
B cold air moves over a warm ocean current.
C air rises over mountains.
D hot, dry air from the interior reaches the coast.
2.2.6 The upwelling of cold, nutrient-rich water along the west coast
results in …
A coral reefs.
B rich fishing grounds.
C high rainfall.
D warm beaches for tourism.
2.2.7 The warm current B causes the east coast of South Africa to be
…
A dry and cool.
B foggy and cold.
(7 x 1) (7)
C warm and humid with higher rainfall.
D a desert.
Copyright reserved Please turn over
Geography/P2 12 Hlayiso/Mock 2026
NSC Mock
2.3 Refer to the sketch map and the extract below on the Lesotho Highlands
Water Project (LHWP).
N
GAUTENG
Vaal Dam
SOUTH AFRICA rivers that flow into
the Vaal Dam
transfer tunnel
Katse Dam
Mohale Dam
LESOTHO
[Source: Examiner’s own sketch map (simplified, not to scale)]
WATER FROM THE MOUNTAINS
Gauteng is South Africa’s economic heartland, but it lies far from
large rivers and receives too little rain to supply its millions of people
and its industries. Through the LHWP, water from dams high in the
mountains of Lesotho is transferred through tunnels into rivers that
flow into the Vaal Dam, which supplies Gauteng. South Africa pays
Lesotho royalties for the water, and the project also generates
hydro-electricity for Lesotho. However, the building of the dams
flooded farmland and forced some villages to move.
[Source: Examiner’s own extract]
2.3.1 Define the term inter-basin water transfer. (1 x 2) (2)
2.3.2 Name the dam in South Africa that receives the water from
Lesotho. (1 x 1) (1)
2.3.3 Explain why Gauteng has to obtain water from other areas. (2 x 2) (4)
2.3.4 Explain how the LHWP benefits Lesotho. (2 x 2) (4)
2.3.5 Explain the negative impact of large dams on people and the
natural environment. (2 x 2) (4)
Copyright reserved Please turn over
Geography/P2 13 Hlayiso/Mock 2026
NSC Mock
2.4 Refer to the extract below on water pollution.
RIVER TURNS GREEN
Residents living along a river in a fictional town, Riverside, have
complained that the water has turned green and smells bad. Tests
show high levels of bacteria (E. coli) downstream of the town’s
sewage treatment works, where pumps and pipes often break down
and untreated sewage overflows into the river. Fertiliser washes into
the river from nearby farms, and plastic and other litter are dumped
on the riverbanks. Thick mats of algae now cover parts of the river
and several fish have died. Villagers downstream who use the river
water for drinking and washing have been warned to boil all water
before use.
[Source: Examiner’s own extract (fictional town)]
2.4.1 Define the term water pollution. (1 x 2) (2)
2.4.2 Give TWO sources of water pollution mentioned in the extract. (2 x 1) (2)
2.4.3 Name ONE waterborne disease that people who drink the
polluted water could get. (1 x 1) (1)
2.4.4 Explain how fertiliser and sewage cause the growth of algae in
the river. (1 x 2) (2)
2.4.5 In a paragraph of approximately EIGHT lines, suggest
measures that the municipality and the community can take to
improve the quality of water in the river. (4 x 2) (8)
Copyright reserved Please turn over
Geography/P2 14 Hlayiso/Mock 2026
NSC Mock
2.5 Refer to the extract below on floods.
FLASH FLOOD SWEEPS THROUGH SETTLEMENT
More than 300 families lost their homes when a small stream burst
its banks after 110 mm of rain fell in four hours. Most of the shacks
had been built on the floodplain, very close to the stream. Residents
said that the stormwater drains were blocked with rubbish and that
the paved roads and roofs of a new shopping centre upstream sent
large amounts of water into the stream. Disaster management
teams provided food, blankets and temporary shelter.
[Source: Examiner’s own extract (fictional event)]
2.5.1 Define the term flood. (1 x 2) (2)
2.5.2 Name the physical (natural) cause of the flood, according to the
extract. (1 x 1) (1)
2.5.3 Give TWO human factors from the extract that made the flood
worse. (2 x 1) (2)
2.5.4 Explain why towns and cities flood more quickly than rural areas
after heavy rain. (2 x 2) (4)
2.5.5 Explain why people living in informal settlements are more at
risk of floods. (1 x 2) (2)
2.5.6 Suggest ways in which the municipality can reduce the impact
of future floods in the settlement. (2 x 2) (4)
[60]
TOTAL SECTION A: 120
Copyright reserved Please turn over
Geography/P2 15 Hlayiso/Mock 2026
NSC Mock
SECTION B
QUESTION 3: GEOGRAPHICAL SKILLS AND TECHNIQUES
GENERAL INFORMATION ON MBOMBELA
Co-ordinates: 25◦ 28′ S; 30◦ 58′ E
Mbombela (formerly Nelspruit) is the capital of Mpumalanga. It lies in the Lowveld on the
banks of the Crocodile River (Umgwenya), about 330 km east of Johannesburg on the
N4 national road. The city has a subtropical climate with hot, wet summers and mild, dry
winters. Citrus, macadamia nuts and subtropical fruit are grown on the surrounding farms.
The city’s population has grown quickly as people move to the area for work, education
and services. Mbombela Stadium was built for the 2010 FIFA World Cup.
[Adapted from various sources]
The following Afrikaans terms appear on the maps:
AFRIKAANS ENGLISH
Gebied van ortofoto kaart Area of orthophoto map
Kontoertussenruimte Contour interval
Verklaring Reference (key)
Spruit Stream
3.1 MAP SKILLS AND CALCULATIONS
3.1.1 Trigonometrical station 141 in block E5 lies … of trigonometrical
station 100 in block D3 on the topographical map.
A north-east
B south-east
(1 x 1) (1)
C south-west
D north-west
3.1.2 On the topographical map, 1 cm represents … on the ground.
A 50 m
B 100 m
(1 x 1) (1)
C 500 m
D 5 km
3.1.3 The contour interval on the orthophoto map is …
A 5 m.
B 10 m.
(1 x 1) (1)
C 20 m.
D 50 m.
3.1.4 Calculate the difference in height between trigonometrical
station 100 in block D3 and trigonometrical station 141 in block
E5 on the topographical map. (2 x 1) (2)
3.1.5 Calculate the straight-line distance in kilometres (km) from
trigonometrical station 100 (block D3) to trigonometrical station
141 (block E5) on the topographical map.
Formula: Actual distance = Map distance × Map scale (2 x 1) (2)
Copyright reserved Please turn over
Geography/P2 16 Hlayiso/Mock 2026
NSC Mock
3.1.6 Calculate the area of block A1 on the topographical map in km2 .
Measure the length (west to east) and the breadth (north to
south) of the block. Show ALL calculations.
Formula: Area = Length (L) × Breadth (B) (4 x 1) (4)
3.1.7 Use the information below the topographical map to calculate
the magnetic declination of Mbombela for 2026. Show ALL
calculations.
Difference in years:
Mean annual change:
(4 x 1) (4)
Total change:
Magnetic declination for 2026:
3.2 MAP INTERPRETATION
3.2.1 Identify the feature labelled H in block B4 on the topographical
map. (1 x 1) (1)
3.2.2 Name the river on which feature H is found. (1 x 1) (1)
3.2.3 In which general direction does this river flow in block C5? (1 x 1) (1)
3.2.4 Name the crop that is grown on the farms in block A3. (1 x 1) (1)
3.2.5 Give ONE piece of evidence from the topographical map that
river water is used for irrigation. (1 x 1) (1)
3.2.6 Explain how the sewerage works in block C4 could pollute the
river next to it. (1 x 2) (2)
3.2.7 Identify the land-use zone labelled 1 on the orthophoto map. (1 x 1) (1)
3.2.8 Name TWO features (services or facilities) on the topographical
map that attract people to migrate to Mbombela. (2 x 1) (2)
3.3 GEOGRAPHICAL INFORMATION SYSTEMS (GIS)
3.3.1 Define the term Geographical Information System (GIS). (1 x 2) (2)
3.3.2 The Crocodile River (Umgwenya) will be shown as a … feature
in GIS.
A point
B line
(1 x 1) (1)
C polygon
D raster
3.3.3 Name TWO data layers that the municipality could use in a GIS
to identify areas along the river that are at risk of flooding. (2 x 1) (2)
[30]
TOTAL SECTION B: 30
GRAND TOTAL: 150
Copyright reserved
Study this subject
Recommended for this subject
Question paper
Geography Grade 10 P2 National November 2018 QP (Eng)
Question paper
Geography Grade 10 P2 National November 2017 QP (Eng)
Addendum
Geography Grade 10 P2 Eastern Cape November 2020 Addendum
Memorandum
Geography Grade 10 P2 Eastern Cape November 2020 Memo (Eng)
Memorandum
Geography Grade 10 P2 Eastern Cape November 2019 Memo (Eng)
Memorandum
Geography Grade 10 P2 National November 2019 Memo (English)
More from Grade 10 Geography
Study guide
Gr10 Geografie OG studyguide LR
Annual teaching plan
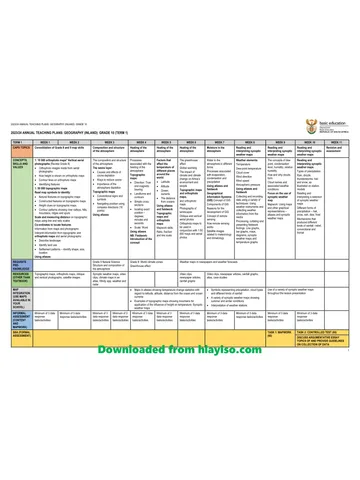
Gr 10 Geo ATP 2023 24
Question paper and memo
Geography Grade 10 Free State March Test 2025 Paper & Memo
Question paper and memo
Geography Grade 10 Paper 1 Limpopo June 2025 Paper & Memo
Question paper and memo
Geography Grade 10 Eastern Cape June 2024 Paper & Memo
Addendum