
Downloaded from hlayiso.com
NATIONAL
SENIOR CERTIFICATE
GRADE 11
NOVEMBER 2017
GEOGRAPHY P1
MARKS: 225
TIME: 3 hours
This question paper consists of 16 pages and a 12 page annexure.
Skip to contentAll 2017 papers 
View all
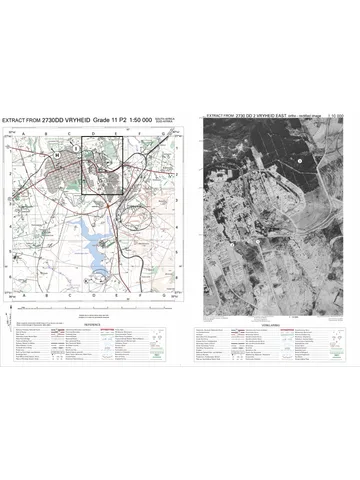
Geography Grade 11 P1 Eastern Cape November 2017 QP (Eng)
Grade 11 Geography Paper 1 question paper from the Eastern Cape November 2017 (English), 16 pages. Read online or download the free PDF.
Geography · Grade 11 · Eastern Cape November · 2017 · English. Question paper, 16 pages. Read online or download the PDF.
- Subject
- Geography
- Grade
- Grade 11
- Language
- English
- Document type
- Question paper
- Year
- 2017
- Exam period
- Eastern Cape November
- Paper
- 1
- Curriculum
- CAPS
- Pages
- 16
- File size
- 909.7 KB
Free to read online, no sign-up needed
Loading document…
Loading document…
1 of 16
This exam
Questions in this paper
- Question 1.1The Atmosphere7 marks
- Question 1.2Geomorphology8 marks
- Question 1.3The Atmosphere15 marks
- Question 1.4The Atmosphere15 marks
- Question 1.5Geomorphology14 marks
- Question 1.6Geomorphology16 marks
Show all 24 questions
- Question 2.1The Atmosphere8 marks
- Question 2.2Geomorphology7 marks
- Question 2.3The Atmosphere15 marks
- Question 2.4The Atmosphere15 marks
- Question 2.5Geomorphology14 marks
- Question 2.6Geomorphology16 marks
- Question 3.1Development geography8 marks
- Question 3.2Resources and sustainability7 marks
- Question 3.3Development geography14 marks
- Question 3.4Development geography17 marks
- Question 3.5Resources and sustainability16 marks
- Question 3.6Development geography14 marks
- Question 4.1Development geography7 marks
- Question 4.2Resources and sustainability8 marks
- Question 4.3Development geography15 marks
- Question 4.4Development geography15 marks
- Question 4.5Resources and sustainability15 marks
- Question 4.6Resources and sustainability15 marks
Document textSearch extracted text and jump to a page.
Downloaded from hlayiso.com
2 GEOGRAPHY P1 (EC/NOVEMBER 2017)
INSTRUCTIONS AND INFORMATION
1. This question paper consists of four questions.
2. Answer any THREE questions of 75 marks each.
3. All diagrams are included in the ANNEXURE.
4. Number the questions correctly according to the numbering system used in this
question paper. Number all your questions in the CENTRE of the line.
5. Leave a line between subsections of questions answered.
6. Start EACH question on a NEW page.
7. Do NOT write in the margins of the ANSWER BOOK.
8. Illustrate your answers with labelled diagrams, where possible.
9. Mark allocation is as follows: 2 x 1 = 2 means that TWO facts are required
for ONE mark each
2 x 2 = 4 means that TWO facts are required
for TWO marks each
10. If words/action verbs like Name, Identify, Provide, Classify, are used in a
question, ONE word answers are acceptable.
If words/action verbs like Discuss, Define, Explain, Comment, Evaluate,
Justify, Suggest and Substantiate are used in a question, FULL sentences
or phrases are required.
All paragraph questions must be answered in FULL sentences.
When answering paragraph questions, LISTING and BULLETS are not
allowed.
11. Write neatly and legibly.
Copyright reserved Please turn over
Downloaded from hlayiso.com
(EC/NOVEMBER 2017) GEOGRAPHY P1 3
SECTION A: PHYSICAL GEOGRAPHY – THE ATMOSPHERE AND
GEOMORPHOLOGY
QUESTION 1
1.1 Refer to FIGURE 1.1, which represents the development of El Niño conditions.
Choose a letter from the figure that best describes the statements below. Each
letter/description refers to the processes in the development of the El Niño
event.
1.1.1 Rising air and rainfall occurs over the central Pacific Ocean
1.1.2 The continent where the fishing industry is negatively affected by
these conditions
1.1.3 During El Niño years the tropical easterlies become weaker
1.1.4 The Walker circulation is disturbed during El Niño years
1.1.5 Descending, dry air occurs on the eastern parts of Australia
1.1.6 Upwelling in the eastern Pacific Ocean decreases
1.1.7 Warm air that usually converges over the Western Pacific Ocean now
converges over the Central and Eastern Pacific Ocean during El Niño
years (7 x 1) (7)
1.2 FIGURE 1.2 illustrates slope elements. Choose the correct slope element for
the descriptions below. A slope element can be used more than once.
1.2.1 The slope element with the least soil coverage
1.2.2 The slope element with a constant gradient
1.2.3 The slope element where the construction of buildings and
infrastructure is possible
1.2.4 The feature that indicates the transition from one slope element to
another
1.2.5 The slope element where the exposed rocks are usually unequal as
weathering enlarged the joints and cracks in the rocks
1.2.6 Rockfalls are the main mass wasting process on this slope element
1.2.7 The slope element with a convex shape
1.2.8 The slope element where the accumulation of weathered material is
not possible (8 x 1) (8)
Copyright reserved Please turn over
Downloaded from hlayiso.com
4 GEOGRAPHY P1 (EC/NOVEMBER 2017)
1.3 Study FIGURE 1.3, showing global air circulation.
1.3.1 Name the atmospheric cells A and B respectively. (2 x 1) (2)
1.3.2 Provide ONE characteristic of cell A. (1 x 1) (1)
1.3.3 Suggest ONE reason why the southern hemisphere would be
experiencing winter on the sketch. (1 x 2) (2)
1.3.4 Refer to wind belts C and D.
(a) Name the wind belt that the arrows C and D indicate. (1 x 1) (1)
(b) Explain why there is a difference in direction between the winds
at C and D. (1 x 2) (2)
1.3.5 Comment on the reason why the winds at E change direction. (1 x 2) (2)
1.3.6 Refer to zone F.
(a) Identify the zone at F. (1 x 1) (1)
(b) Describe how this zone at F causes the heavy clouds in the
atmosphere above it. (2 x 2) (4)
1.4 Refer to the synoptic weather map in FIGURE 1.4.
1.4.1 Name the lines that join places of equal pressure on synoptic weather
maps. (1 x 1) (1)
1.4.2 What is the atmospheric pressure of the line marked B? (1 x 1) (1)
1.4.3 Name the atmospheric feature at C and the atmospheric pressure
system at D. (2 x 1) (2)
1.4.4 Give TWO reasons why the synoptic weather map is representative of
summer in South Africa. (2 x 1) (2)
1.4.5 Refer to weather station E:
(a) What is the wind direction of weather stations E? (1 x 1) (1)
(b) In a paragraph of approximately EIGHT lines, explain how Coriolis
and pressure gradient forces influenced the wind direction at
these weather stations at E. (4 x 2) (8)
Copyright reserved Please turn over
Downloaded from hlayiso.com
(EC/NOVEMBER 2017) GEOGRAPHY P1 5
1.5 Refer to the photograph of the Grand Canyon in FIGURE 1.5.
1.5.1 Name the type of rock that the canyon is associated with. (1 x 1) (1)
1.5.2 Describe the slopes of the landform in the photo. (1 x 2) (2)
1.5.3 Explain why the slopes of the canyon does not have a smooth concave
or convex shape. (2 x 2) (4)
1.5.4 Refer to the area at A:
(a) What type of erosion occurs at A? (1 x 1) (1)
(b) Explain how the erosion (answer to QUESTION 1.5.4(a)) will
eventually lead to the formation of a gorge. (2 x 2) (4)
1.5.5 Comment on the benefits of the river, in this landscape, for agricultural
activities. (1 x 2) (2)
1.6 Refer to FIGURE 1.6, which illustrates the development of a massive igneous
rock, and the subsequent development of a granite dome.
1.6.1 Name the intrusive igneous rock at A. (1 x 1) (1)
1.6.2 Provide TWO characteristics of the intrusion at A. (2 x 1) (2)
1.6.3 Refer to the granite dome in stage 4:
(a) Name the type of weathering that granite domes are exposed to.
(1 x 1) (1)
(b) Explain how this type of weathering occurs. (2 x 2) (4)
1.6.4 Write a paragraph of approximately EIGHT lines to describe how
granite domes are exposed to the earth’s surface. (4 x 2) (8)
[75]
Copyright reserved Please turn over
Downloaded from hlayiso.com
6 GEOGRAPHY P1 (EC/NOVEMBER 2017)
QUESTION 2
2.1 Refer to FIGURE 2.1 on monsoon conditions over India. Choose the correct
term/word from those given in brackets.
2.1.1 The atmospheric pressure over the Himalayan Mountains is (high/low).
2.1.2 The (Atlantic/Indian) Ocean is found at A.
2.1.3 The (equator/Tropic of cancer) is the latitude line found at B.
2.1.4 (April to May/June to September) are the months being depicted by the
map.
2.1.5 The wind direction at C is (southwest/northeast).
2.1.6 The area between B and D is known as the (tropical/mid-latitude)
region.
2.1.7 Monsoon winds cover the earth’s area on a (micro/macro) scale.
2.1.8 The air movement on the map causes (floods/droughts). (8 x 1) (8)
2.2 Give ONE word/term for each of the following descriptions by choosing a
word/term from the list below. Write ONLY the word/term next to the question
number (2.2.1–2.2.7) in the ANSWER BOOK.
mesa; butte; conical hill; tectonic activity; basalt plateau; soil creep; bad
lands; cap rock
2.2.1 The movement and processes in the earth’s crust
2.2.2 Very rugged landscape in semi-dry and dry regions
2.2.3 The slopes of this landform are very regular and consist of concentric
contours which are regularly spaced
2.2.4 A high-lying area that has been uplifted thousands of meters above the
surface
2.2.5 Flat-topped mountains with a greater height than width
2.2.6 Flat-topped mountains with a greater width than height
2.2.7 Harder and more resistant rock that covers the less resistant rock
(7 x 1) (7)
Copyright reserved Please turn over
Downloaded from hlayiso.com
(EC/NOVEMBER 2017) GEOGRAPHY P1 7
2.3 Study FIGURE 2.3 based on a diagram showing warm, dry winds that blow
over the North American and European continents.
2.3.1 Provide the local names of the warm, dry winds indicated by A and B
on the different continents. (2 x 1) (2)
2.3.2 Is the wet adiabatic lapse rate found on the windward or leeward side?
(1 x 1) (1)
2.3.3 Explain why the wind is dry in A and B on the maps. (2 x 2) (4)
2.3.4 In a paragraph of approximately EIGHT lines, evaluate the influence
that these warm, dry winds have on economic activities in the areas
indicated on the different maps. (4 x 2) (8)
2.4 Study FIGURE 2.4, based on a map of South Africa, and a table representing
the temperature and rainfall data of selected cities/towns.
2.4.1 What does the abbreviation mT stand for? (1 x 1) (1)
2.4.2 Mention the reasons why the mT air of Port Nolloth and Durban differs.
(2 x 1) (2)
2.4.3 Explain how the currents along the west and east coast of South Africa
influence the climate of Port Nolloth and Durban respectively. (2 x 2) (4)
2.4.4 Discuss how the movement of the ITCZ influences the different
January and July temperatures of the places indicated on the map.
(2 x 2) (4)
2.4.5 Account for the larger temperature variations of Bloemfontein,
compared to the temperature variations of Port Nolloth and Durban.
(2 x 2) (4)
2.5 Study FIGURE 2.5 which illustrates inclined strata.
2.5.1 Name the landforms A and B. (1 + 1) (2)
2.5.2 Scarp retreat will occur at both landforms.
(a) What is scarp retreat? (1 x 1) (1)
(b) In which direction will scarp retreat (in the diagrams) occur?
(1 x 1) (1)
(c) Explain your answer to QUESTION 2.5.2(b). (1 x 2) (2)
2.5.3 In a paragraph of approximately EIGHT lines, comment on the
significance of both landforms (A and B) for human activities (4 x 2) (8)
Copyright reserved Please turn over
Downloaded from hlayiso.com
8 GEOGRAPHY P1 (EC/NOVEMBER 2017)
2.6 Refer to FIGURE 2.6 which illustrates a type of mass movement.
2.6.1 Name the type of mass movement illustrated in the sketch. (1 x 1) (1)
2.6.2 Provide TWO pieces of evidence from the sketch to substantiate your
answer to QUESTION 2.6.1. (2 x 1) (2)
2.6.3 Refer to the insert at X.
(a) Is the speed of movement of sand grains at X, 15 km per year or
1 cm per year? (1 x 1) (1)
(b) Explain TWO ways in which expansion and subsidence of soil
grain can occur. (2 x 2) (4)
(c) Evaluate how the amount of rainfall and slope steepness will
influence the movement at X. (2 x 2) (4)
2.6.4 Describe TWO ways to reduce or prevent this type of mass movement.
(2 x 2) (4)
[75]
Copyright reserved Please turn over
Downloaded from hlayiso.com
(EC/NOVEMBER 2017) GEOGRAPHY P1 9
SECTION B: DEVELOPMENT AND NATURAL RESOURCES
QUESTION 3
3.1 Choose a term from COLUMN B that matches the description in COLUMN A.
Write ONLY the letter (A–I) next to the question number (3.1.1–3.1.8), for
example 3.1.9 J.
COLUMN A COLUMN B
3.1.1 The development of industries in a country A Globalisation
3.1.2 Economic activities where natural resources B Self-sufficient
are directly extracted from nature
3.1.3 Involves the rapid expansion in the C Multiplier effect
movement of goods, services, capital, ideas
and people around the world
3.1.4 The type of agriculture where what is D Informal sector
produced is consumed by the farmer and his
family
3.1.5 An increase in activity and investment in one E Industrialisation
area triggers off activity and investment in
other areas
3.1.6 The economic activity where providing F Foreign exchange
services and trade are the main activities
3.1.7 When a country or region relies on itself and G Primary activities
does not need help from other regions or
countries
3.1.8 This sector is not part of the formal H Subsistence
economic sector, and usually consists of
self-employed individuals
I Tertiary activity
(8 x 1) (8)
Copyright reserved Please turn over
Downloaded from hlayiso.com
10 GEOGRAPHY P1 (EC/NOVEMBER 2017)
3.2 Study FIGURE 3.2 which illustrates soil forming factors and soil horizons.
Answer the questions below by providing a term/word from the figure that best
fits the description.
3.2.1 Name a passive soil forming factor
3.2.2 In which horizon does the parent rock occur?
3.2.3 Name the horizon that consists of weathered parent material
3.2.4 The horizon that is aided by the decomposition of animal and plant
material
3.2.5 The horizon where leaching occurs
3.2.6 The horizon that determines the texture, mineral composition and
weathering speed of the soil
3.2.7 The active soil forming factor that determines the process of salination
(7 x 1) (7)
3.3 Study FIGURE 3.3, illustrating indicators of development.
3.3.1 What does the abbreviation HDI stand for? (1 x 1) (1)
3.3.2 Name ONE of the HDI indicators of development. (1 x 1) (1)
3.3.3 Refer to the photo indicating Developed vs. Developing countries and
the HDI and GINI-coefficient data.
(a) Match X and Y to either developed or developing countries
respectively. (2 x 2) (4)
(b) Clearly distinguish between HDI and GINI-coefficient data.(2 x 2) (4)
3.3.4 Explain how the population growth of developing countries will have a
negative influence on development. (2 x 2) (4)
Copyright reserved Please turn over
Downloaded from hlayiso.com
(EC/NOVEMBER 2017) GEOGRAPHY P1 11
3.4 FIGURE 3.4 depicts a balance of trade situation.
3.4.1 Define the term balance of trade. (1 x 1) (1)
3.4.2 The cartoonist depicts a negative balance of trade.
(a) Why would you agree with the statement that the balance of trade
is negative? (1 x 1) (1)
(b) Provide TWO protectionist policies that more developed countries
implement to restrict imports. (2 x 1) (2)
3.4.3 Protectionist policies restrict fair trade. Explain how fair trade could help
struggling countries to have a better balance in their trade. (2 x 2) (4)
3.4.4 In a paragraph of approximately EIGHT lines, evaluate the importance
of a positive balance of trade for countries. (4 x 2) (8)
3.5 Study FIGURE 3.5, showing data information about South Africa’s energy
usage and needs.
3.5.1 Which household unit consumes the most energy in South Africa?
(1 x 1) (1)
3.5.2 State how the projected population from 2010 to 2030 will influence
energy consumption. (1 x 1) (1)
3.5.3 Describe the trend in the graph which illustrates South Africa’s
households with and without electricity. (1 x 2) (2)
3.5.4 Explain how the information in the graphs will negatively impact the
economy of South Africa. (2 x 2) (4)
3.5.5 In a paragraph of approximately EIGHT lines, comment on how
individuals in households of South Africa can use electricity more
sustainably. (4 x 2) (8)
Copyright reserved Please turn over
Downloaded from hlayiso.com
12 GEOGRAPHY P1 (EC/NOVEMBER 2017)
3.6 Refer to FIGURE 3.6, a cartoonist’s impression of the use of a conventional
energy source.
3.6.1 Name the type of energy that the industries in the cartoon make use
of. (1 x 1) (1)
3.6.2 The question being asked in the cartoon is contrary (opposite) to what
is depicted in the industries. Substantiate this statement. (1 x 2) (2)
3.6.3 Refer to the gasses at A, being emitted by the industries.
(a) Name ONE type of gas being emitted by the industries. (1 x 1) (1)
(b) Account for TWO types of atmospheric consequences that these
gasses are responsible for. (2 x 1) (2)
3.6.4 Explain why the answer of ‘DENIAL’ is appropriate. (2 x 2) (4)
3.6.5 Despite the situation depicted in the illustration, the resource being
used to generate energy is still important and vital to South Africa’s
economy. Explain TWO reasons why. (2 x 2) (4)
[75]
Copyright reserved Please turn over
Downloaded from hlayiso.com
(EC/NOVEMBER 2017) GEOGRAPHY P1 13
QUESTION 4
4.1 Development models, although heavily criticised, give us an idea of the
development of places within a time frame. Choose the development model
that the descriptions below refer to. Write ONLY one model next to the
question number (4.1.1–4.1.7)
MODELS
Rostow’s model
Core-periphery model
Sustainable development model
4.1.1 This model has been developed from the dependency theory.
4.1.2 This model has a ‘bottom-to-top’ rather than a ‘top-to-bottom’ approach
to development.
4.1.3 This model was developed in the 1950’s and consists of linear
development stages.
4.1.4 This model is based on the idea that if there is worldwide growth in
wealth, only the richer countries benefit from this wealth.
4.1.5 This model was based on the European experience and does not
accommodate developing countries’ development.
4.1.6 This model is based on the fact that development cannot take place if
there is no balance between economic, social and environmental
development.
4.1.7 According to this model, economic growth is centred on a few areas
and the less developed areas depend on these developed centres.
(7 x 1) (7)
Copyright reserved Please turn over
Downloaded from hlayiso.com
14 GEOGRAPHY P1 (EC/NOVEMBER 2017)
4.2 Identify the use of the following natural resources as renewable or non-
renewable. Write ONLY renewable or non-renewable next to the question
number (4.2.1–4.2.8).
4.2.1 A company that uses bio-thermal methods to generate energy.
4.2.2 An iron company that makes corrugated iron for roofs.
4.2.3 A commercial farmer that cultivates organic vegetables.
4.2.4 A sawmill that cuts wood for the furniture industry.
4.2.5 A company that uses filters on their chimneys to reduce carbon dioxide
emissions.
4.2.6 A mining company which produces gold for the jewellery industry.
4.2.7 A petrochemical company that manufactures fuel for motor vehicles.
4.2.8 A utility company that provides huge amounts of water to the
municipality. (8 x 1) (8)
4.3 Refer to FIGURE 4.3, an extract on the initiative of the Umsizi organisation in
community development.
4.3.1 What is community development? (1 x 1) (1)
4.3.2 Name ONE focus area and ONE aim from the extract of the community
development projects organised by Umsizi. (2 x 1) (2)
4.3.3 Mention why crop production training is sustainable and widespread
within the Umsizi framework. (1 x 2) (2)
4.3.4 Explain why monitoring of community-based projects is important to its
success for sustainable development. (2 x 2) (4)
4.3.5 Provide reasons why community development is important to a
country’s broader development aims. (3 x 2) (6)
Copyright reserved Please turn over
Downloaded from hlayiso.com
(EC/NOVEMBER 2017) GEOGRAPHY P1 15
4.4 Study FIGURE 4.4, which illustrates the effects of aid on the development of
Third World countries.
4.4.1 Would you regard the type of aid in the illustration as being bilateral or
multilateral? (1 x 1) (1)
4.4.2 Provide a reason for your choice in QUESTION 4.4.1. (1 x 1) (1)
4.4.3 Explain why the aid provided is unsustainable as depicted in the
illustration. (1 x 2) (2)
4.4.4 Three types of aid, technical, conditional or humanitarian may be
provided to recipient countries.
(a) Name the type of aid depicted in the illustration. (1 x 1) (1)
(b) Substantiate your answer to QUESTION 4.4.4(a). (1 x 2) (2)
4.4.5 In a paragraph of approximately EIGHT lines, describe how aid
might have a positive impact on development in Third World
countries. (4 x 2) (8)
4.5 Refer to FIGURE 4.5, showing the use of a non-conventional energy method.
4.5.1 Which non-conventional energy is being depicted by the cartoonist?
(1 x 1) (1)
4.5.2 Name TWO disadvantages, illustrated in the diagram, of this type of
energy being generated. (2 x 1) (2)
4.5.3 Describe TWO advantages of this type of energy being generated.
(2 x 2) (4)
4.5.4 Refer to the heading ‘Greening the Land’.
(a) What is meant by the heading ‘Greening the Land’? (1 x 2) (2)
(b) Explain how greening of the land will benefit the economy of South
Africa. (3 x 2) (6)
Copyright reserved Please turn over
Downloaded from hlayiso.com
16 GEOGRAPHY P1 (EC/NOVEMBER 2017)
4.6 Study FIGURE 4.6 showing the importance of recycling and reuse.
4.6.1 What is the meaning of sustainable use of resources? (1 x 1) (1)
4.6.2 Differentiate between recycle and reuse. (1 x 2) (2)
4.6.3 Discuss how recycling can cause economic development. (2 x 2) (4)
4.6.4 In a paragraph of approximately EIGHT lines, evaluate the impact of
recycling and reuse for environmental sustainability. (4 x 2) (8)
[75]
GRAND TOTAL: 225
Copyright reserved Please turn over
Study this subject
Recommended for this subject
Question paper
Geography Grade 11 P1 Eastern Cape November 2017 QP (Eng)
Question paper
Geography Grade 11 P1 Eastern Cape November 2022 QP (Eng)
Question paper
Geography Grade 11 P1 Eastern Cape November 2020 QP (Eng)
Memorandum
Geography Grade 11 P1 Eastern Cape November 2022 Memo (Eng)
Addendum
Geography Grade 11 P1 Eastern Cape November 2020 Addendum
Memorandum
Geography Grade 11 P1 Eastern Cape November 2020 Memo (Eng)
More from Grade 11 Geography
Memorandum
Geography Grade 11 P1 Eastern Cape November 2025 Memo (Eng)
Memorandum
Geography Grade 11 P2 Eastern Cape November 2025 Memo (Eng)
Question paper and memo
Geography Grade 11 Free State March Test 2025 Paper & Memo
Memorandum
Geography Grade 11 P1 Eastern Cape November 2024 Memo (Afr)
Memorandum
Geography Grade 11 P1 Eastern Cape November 2023 Memo (Eng)
Question paper