
Confidential
SENIOR CERTIFICATE EXAMINATIONS/
NATIONAL SENIOR CERTIFICATE EXAMINATIONS
GEOGRAPHY P2
MAY/JUNE 2024
MARKS: 150
TIME: 3 hours
This question paper consists of 19 pages.
Copyright reserved Please turn over
Skip to contentAll 2024 papers 
View all
Geography Grade 12 P2 NSC June 2024 Question Paper (English)
Grade 12 Geography Paper 2 question paper from the NSC June Exam 2024 (English), 19 pages. Read online or get the free PDF download, memo linked when available.
Geography · Grade 12 · NSC June Exam · 2024 · English. Question paper, 19 pages. Read online or download the PDF.
- Subject
- Geography
- Grade
- Grade 12
- Language
- English
- Document type
- Question paper
- Year
- 2024
- Exam period
- NSC June Exam
- Paper
- 2
- Curriculum
- CAPS
- Pages
- 19
- File size
- 899.5 KB
Free to read online, no sign-up needed
Loading document…
Loading document…
1 of 19
This exam
NSC June Exam 2024
Document textSearch extracted text and jump to a page.
Geography/P2 2 DBE/May/June 2024
SC/NSC Confidential
INSTRUCTIONS AND INFORMATION
1. This question paper consists of TWO sections:
SECTION A
QUESTION 1: RURAL AND URBAN SETTLEMENTS (60)
QUESTION 2: ECONOMIC GEOGRAPHY OF SOUTH AFRICA (60)
SECTION B
QUESTION 3: GEOGRAPHICAL SKILLS AND TECHNIQUES (30)
2. Answer ALL THREE questions.
3. ALL diagrams are included in the QUESTION PAPER.
4. Leave a line between the subsections of questions answered.
5. Start EACH question at the top of a NEW page.
6. Number the answers correctly according to the numbering system used in this
question paper.
7. Do NOT write in the margins of the ANSWER BOOK.
8. Draw fully labelled diagrams when instructed to do so.
9. Answer in FULL SENTENCES, except when you have to state, name, identify
or list.
10. Units of measurement MUST be indicated in your final answer, e.g.1020 hPa,
14 °C and 45 m.
11. You may use a non-programmable calculator.
12. You may use a magnifying glass.
13. Write neatly and legibly.
SPECIFIC INSTRUCTIONS AND INFORMATION FOR SECTION B
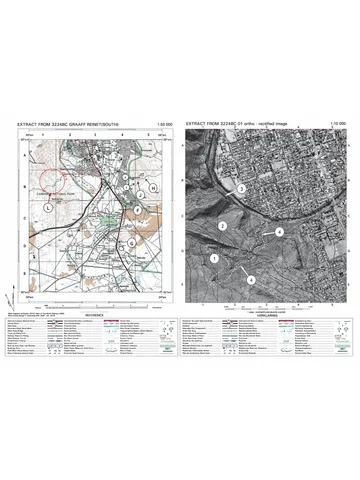
14. A 1 : 50 000 topographical map 2529CD MIDDELBURG and a 1 : 10 000
orthophoto map 2529 CD 5 MIDDELBURG are provided.
15. The area demarcated in RED/BLACK on the topographical map represents
the area covered by the orthophoto map.
16. Show ALL calculations. Marks will be allocated for steps in calculations.
17. You must hand in the topographical and orthophoto map to the invigilator at
the end of the examination.
Copyright reserved Please turn over
Geography/P2 3 DBE/May/June 2024
SC/NSC Confidential
SECTION A: RURAL AND URBAN SETTLEMENTS AND THE ECONOMIC
GEOGRAPHY OF SOUTH AFRICA
QUESTION 1: RURAL AND URBAN SETTLEMENTS
1.1 Refer to the sketch below on the pattern and shape of rural settlements. Write
only the answer next to the question numbers (1.1.1 to 1.1.7) in the ANSWER
BOOK, e.g. 1.1.8 circular.
1 : 15 000
[Adapted from https://www.google.com/search?q=types of rural settlements]
1.1.1 The settlement pattern at A is …
1.1.2 The settlement pattern at B is …
1.1.3 Settlement (A/B) is likely to generate more profit.
1.1.4 The river caused the settlement at C to have a … shape.
1.1.5 The shape of the settlement at F is …
1.1.6 D is located on high ground due to the threat of flooding and is
called a ... settlement.
1.1.7 E is close to a supply of water and is referred to as a … settlement.
(7 x 1) (7)
Copyright reserved Please turn over
Geography/P2 4 DBE/May/June 2024
SC/NSC Confidential
1.2 Various terms/concepts are provided as possible answers to the following
statements. Choose the answer and write only the letter (A–D) next to the
question numbers (1.2.1 to 1.2.8) in the ANSWER BOOK, e.g. 1.2.9 D.
1.2.1 A … is an area, where a group of people live, that has buildings,
communication networks and functions.
A site
B property
C settlement
D situation
1.2.2 … is the process whereby an increasing percentage of people live
in urban areas as compared to rural areas.
A Urban sprawl
B Urban growth
C Urban renewal
D Urbanisation
1.2.3 … is the formless growth of urban areas.
A Urban growth
B Urban expansion
C Urban sprawl
D Urban blight
1.2.4 The physical growth of an urban settlement is referred to as
urban …
A expansion.
B profile.
C growth.
D decay.
1.2.5 The increase in the number of people living in urban areas is
known as ...
A urbanisation.
B urban growth.
C urban expansion.
D urban migration. 2024
Copyright reserved Please turn over
Geography/P2 5 DBE/May/June 2024
SC/NSC Confidential
1.2.6 The largest increase in the level of urbanisation in South Africa is
from …
YEAR 2018 2019 2020 2021 2022
Percentage of 66,4% 66,9% 67,2% 67,9% 68,3%
people living in
urban areas
A 2018 to 2019.
B 2019 to 2020.
C 2020 to 2021.
D 2021 to 2022.
1.2.7 The … of urbanisation refers to the pace at which urbanisation
takes place.
A rate
B speed
C growth
D level
1.2.8 The advantages of counterurbanisation for urban areas are
decreased …
(i) pollution.
(ii) land value.
(iii) aesthetic appeal.
(iv) traffic congestion.
A (i) and (ii)
B (ii) and (iii)
C (i) and (iv)
D (ii) and (iv) (8 x 1) (8)
Copyright reserved Please turn over
Geography/P2 6 DBE/May/June 2024
SC/NSC Confidential
1.3 Refer to the graph and cartoon below showing rural-urban migration.
PREDICTED (EXPECTED) DIFFERENCE IN THE PERCENTAGE INCREASE OF PEOPLE
THAT MOVED FROM RURAL TO URBAN AREAS BETWEEN 2000 AND 2030
[Adapted from www.coolgeography]
Better jobs
in the city
[Adapted from www.google.com/search?q=rural+urban+migration+&tbm]
1.3.1 Which continent is predicted (expected) to have the highest
percentage of people that would move to urban areas between
2000 and 2030? (1 x 1) (1)
1.3.2 Determine the predicted (expected) difference in the percentage of
people (answer to QUESTION 1.3.1) that would have moved
between 2000 and 2030. (1 x 2) (2)
Copyright reserved Please turn over
Geography/P2 7 DBE/May/June 2024
SC/NSC Confidential
1.3.3 Why will the rate of urbanisation of the continent (answer to
QUESTION 1.3.1) be so high? (1 x 2) (2)
1.3.4 Why does the pull factor, indicated in the cartoon, often lead to
disappointment? (2 x 2) (4)
1.3.5 Suggest strategies that could be implemented in rural areas to
reduce the rate of urbanisation. (3 x 2) (6)
1.4 Refer to the sketch below on the multiple-nuclei model.
MULTIPLE-NUCLEI MODEL KEY
1. Central business
district
2. Light industries
3. Low-income
residential
4. Middle-income
residential
5. High-income
residential
6. Heavy industries
7. Outlying business
district
8. Residential estate
9. Industrial estate
[Adapted from www.researchgate.co.za]
1.4.1 State TWO characteristics of the multiple-nuclei model evident in
the sketch. (2 x 1) (2)
1.4.2 Identify land-use zone 1. (1 x 1) (1)
1.4.3 Account for the location of land-use zone 1. (1 x 2) (2)
1.4.4 Explain how the development of the outlying business district
(OBD), labelled 7, was influenced by:
(a) Crime rate (1 x 2) (2)
(b) Traffic congestion (1 x 2) (2)
1.4.5 Why will the multiple-nuclei model depicted in the sketch not apply
to all urban areas? (3 x 2) (6)
Copyright reserved Please turn over
Geography/P2 8 DBE/May/June 2024
SC/NSC Confidential
1.5 Refer to the photograph and extract below on urban blight (urban decay).
RECLAIMING THE
RECLAIMING TRANSITION
TRANSITION ZONE
ZONE
(ZONE OF (ZONE
DECAY)OF DECAY)
City neighbourhoods, such as the
Maboneng Precinct and Fordsburg,
have a fast-developing modern feel
about them. Rental prices within them
have increased accordingly. This is
due to improvements to attract more
middle-income residents: the process
of gentrification resulted in the
renovation of old buildings. The social
cost of redevelopment has been
illustrated by a wave of evictions of the original residents who have lived in unsafe and
abandoned buildings, often for decades, because they could not afford better
accommodation.
[Adapted from https://www.news24.com/citypress/voices/-reclaiming-inner-cities-to-solve-our-housing-
crisis]
1.5.1 Define the concept urban blight. (1 x 2) (2)
1.5.2 Give evidence from the photograph that urban blight has taken
place. (1 x 1) (1)
1.5.3 Why is urban blight more dominant in the transition zone (zone of
decay) than in other land-use zones? (2 x 2) (4)
1.5.4 In a paragraph of approximately EIGHT lines, explain the positive
impact of gentrification on the transition zone (zone of decay).
(4 x 2) (8)
[60]
Copyright reserved Please turn over
Geography/P2 9 DBE/May/June 2024
SC/NSC Confidential
QUESTION 2: ECONOMIC GEOGRAPHY OF SOUTH AFRICA
2.1 Various terms/concepts are provided as possible answers to complete the
following statements. Choose the answer and write only the letter (A–D) next
to the question numbers (2.1.1 to 2.1.8) in the ANSWER BOOK, e.g. 2.1.9 D.
2.1.1 … core industrial region contributes the lowest percentage to the
GDP in South Africa.
CORE INDUSTRIAL REGION CONTRIBUTION TO GDP
Durban-Pinetown 16,3%
South-western Cape 14,2%
Gauteng (PWV) 35,2%
Port Elizabeth-Uitenhage 7,9%
A Durban-Pinetown
B Port Elizabeth-Uitenhage
C Gauteng (PWV)
D South-western Cape
2.1.2 The … is the main source of water for the Gauteng (PWV) core
industrial region.
A Sterkfontein Dam
B Orange River
C Vaal Dam
D Sundays River
2.1.3 Access to … is an advantage of the Port Elizabeth-Uitenhage core
industrial region compared to the Gauteng (PWV) core industrial
region.
A coal
B airports
C diamonds
D harbours
2.1.4 … is the main industry located in the Gauteng (PWV) core
industrial region.
A Iron and steel
B Car assembly
C Sugar refining
D Fish canning
Copyright reserved Please turn over
Geography/P2 10 DBE/May/June 2024
SC/NSC Confidential
2.1.5 The Coega Industrial Development Zone is found in the … core
industrial region.
A Gauteng (PWV)
B Port Elizabeth-Uitenhage
C Durban-Pinetown
D South-western Cape
2.1.6 The main raw materials found in the Gauteng (PWV) core industrial
region include … and …
(i) gold
(ii) fruit
(iii) iron ore
(iv) fish
A (i) and (ii)
B (i) and (iii)
C (i) and (iv)
D (ii) and (iv)
2.1.7 The dominant industrial activities in the Port Elizabeth-Uitenhage
core industrial region are …
A car assembly and textiles.
B chemicals and metal processing.
C oil and sugar refining.
D food processing and ship building.
2.1.8 The disadvantages of industrial centralisation to the Gauteng
(PWV) core industrial region are …
(i) water shortages.
(ii) a small labour force.
(iii) small markets.
(iv) air pollution.
A (i) and (ii)
B (ii) and (iii)
C (i) and (iv)
D (ii) and (iv) (8 x 1) (8)
Copyright reserved Please turn over
Geography/P2 11 DBE/May/June 2024
SC/NSC Confidential
2.2 Choose an answer from COLUMN B that matches the statement in
COLUMN A. Write only the letter Y or Z next to the question numbers
(2.2.1 to 2.2.7) in the ANSWER BOOK, e.g. 2.2.8 Z.
COLUMN A COLUMN B
2.2.1 Term used for unregistered Y formal sector
businesses Z informal sector
2.2.2 Characteristic of the Y workers are self-employed
informal sector Z workers are employed by a
national enterprise (business)
2.2.3 Reason for a high number of Y lack of documentation
immigrants entering the Z availability of jobs
informal sector
2.2.4 Example of an informal Y PEP stores
sector Z car guard
2.2.5 Benefit for consumers Y quality products at a higher price
buying goods from an Z goods can be purchased at
informal trader a lower price
2.2.6 Reason for the growth of the Y limited jobs available in the
informal sector in South formal sector
Africa Z jobs available in the formal
sector
2.2.7 Challenge facing the Y provision of low interest loans
informal sector Z exposed to harsh weather
conditions
(7 x 1) (7)
Copyright reserved Please turn over
Geography/P2 12 DBE/May/June 2024
SC/NSC Confidential
2.3 Refer to the graph and extract below on food insecurity.
[Adapted from https://www.google.com/url?sa=i&url=https%3A%2F%-infographics%2Fhunger]
Until recently, food insecurity has been largely linked to climate change, the Covid
pandemic and poverty. Availability of food has now become an important issue.
Today conflict between countries have resulted in wars (like the conflict between Russia
and Ukraine), which has increased trade-related policies* imposed by countries. This
has resulted in a number of global food trade restrictions being put in place by countries
in order to increase domestic (local) supply. More recently, 20 countries have
implemented 27 food export bans, and ten have implemented 14 export-limiting
measures.
The main products imported by South Africa are wheat, maize, soya beans and
sunflower seeds. The impact of reducing South Africa's imports has resulted in
increasing food prices and higher inflation rates in South Africa.
Glossary:
* Trade-related policies are policies related to the importation and exportation of goods between countries.
[Adapted from https://www.worldbank.org/en/topic/agriculture/brief/food-security-update#]
2.3.1 State the trend evident on the graph with regard to global food
insecurity from 2019 to 2023. (1 x 1) (1)
2.3.2 According to the extract, what are the reasons for the trend shown
on the graph? (2 x 1) (2)
2.3.3 What positive impact could the global food trade restriction
measures have on South Africa? (1 x 2) (2)
2.3.4 Explain how TWO physical factors negatively impact South Africa's
food production. (2 x 2) (4)
2.3.5 Suggest measures that government can implement (put in place) to
support farmers in achieving food security in South Africa. (3 x 2) (6)
Copyright reserved Please turn over
Geography/P2 13 DBE/May/June 2024
SC/NSC Confidential
2.4 Refer to the infographic below on platinum mining.
PLATINUM MINING
LOCATION OF PLATINUM MINES IN SOUTH AFRICA
Mining for Platinum Group Metals
(PGM) is widespread over South Africa
and holds over 80% of the world's
reserves.
The decline in the South African
platinum supply has not been given the
attention it deserves by industry
research organisations.
Apart from the labour strikes that
challenge the platinum mining industry,
access to affordable and reliable
electricity is critical. Eskom and
government encourage independent
power production and supplementary [Source: Examiner's own sketch]
power production.
SOUTH AFRICAʹS PLATINUM SUPPLY 2016–2023
Another challenge is water security. A
growing concern is the deterioration of
water distribution infrastructure on the
TONS
one hand and climate change on the
other.
[Adapted from https://www.miningreview.com
/platinum-group-metals/]
2016 2017 2018 2019 2020 2021 2022 2023
YEARS
[Source: Examiner's own sketch]
2.4.1 What percentage of the world's platinum reserves does
South Africa have? (1 x 1) (1)
2.4.2 Give evidence from the extract that platinum production in South
Africa is influenced (affected) by a:
(a) Social factor
(b) Service delivery factor (2 x 1) (2)
2.4.3 Refer to the map and name TWO provinces where platinum is
mined. (2 x 1) (2)
Copyright reserved Please turn over
Geography/P2 14 DBE/May/June 2024
SC/NSC Confidential
2.4.4 Describe the general trend of the platinum supply between 2016
and 2018 and between 2020 to 2023, by referring to the graph.
(2 x 1) (2)
2.4.5 In a paragraph of approximately EIGHT lines, suggest strategies
that government can implement (put in place) to address
challenges of platinum production. (4 x 2) (8)
2.5 Refer to the extract below on the Wild Coast Spatial Development Initiative
(SDI).
N2 WILD COAST TOLL ROAD PROJECT – AN INCENTIVE FOR
SUSTAINED DEVELOPMENT
The Wild Coast would be well served by the development of a road system to
encourage tourism and open up the region to economic opportunities.
The N2 Wild Coast toll road project will benefit the local community during the
construction process, as a number of direct jobs will be created. The new
route will also provide a safer road network which will allow those living along
the new road to benefit from road interchanges, pedestrian walkways, bridges
and agricultural underpasses for livestock.
The social and economic impacts of the project will offer a significant injection
for the local communities. It is estimated that income for the local industry will
increase by R360,4 million and construction work will create 6 800 direct jobs,
and between 21 300 and 28 100 indirect jobs.
The project to upgrade the N2 Wild Coast road from East London to Port
Edward is an important initiative to unlock economic opportunities in some of
the most impoverished (poorest) parts of the country.
However, cultural beliefs and traditional values are in conflict with economic
development of the Wild Coast Spatial Development Initiative.
[Adapted from Sanral]
2.5.1 State ONE key objective of Spatial Development Initiatives (SDI) in
South Africa. (1 x 1) (1)
2.5.2 In which province is the Wild Coast Spatial Development Initiative
(SDI) located? (1 x 1) (1)
2.5.3 According to the extract, by how much will the income of the local
industries increase? (1 x 1) (1)
Copyright reserved Please turn over
Geography/P2 15 DBE/May/June 2024
SC/NSC Confidential
2.5.4 State TWO physical factors that would encourage tourism in the
Wild Coast Spatial Development Initiative (SDI). (2 x 1) (2)
2.5.5 How would the N2 Wild Coast toll road project encourage
economic development of the Wild Coast Spatial Development
Initiative (SDI)? (2 x 2) (4)
2.5.6 Explain why the Wild Coast Spatial Development Initiative (SDI)
has experienced challenges with regard to achieving its key
objectives (goals). (3 x 2) (6)
[60]
TOTAL SECTION A: 120
Copyright reserved Please turn over
Geography/P2 16 DBE/May/June 2024
SC/NSC Confidential
SECTION B
QUESTION 3: GEOGRAPHICAL SKILLS AND TECHNIQUES
GENERAL INFORMATION ON MIDDELBURG
Coordinates: 25º45'S; 29°25'E
Middelburg is a town situated in Mpumalanga in South Africa. It lies midway between
Pretoria and Lydenburg.
Mpumalanga accounts for approximately 83 per cent of South Africa's coal production
and Eskom owns 12 (of its 15) coal-fired power plants located in and around this area.
Middelburg is well known as the stainless-steel capital of Africa. It is home to a large
stainless-steel plant named Columbus Stainless.
Middelburg has plenty to offer all travelers, from fascinating cultural tours to adrenaline
pumping watersports in pristine dam areas. Middelburg is the ideal holiday destination.
[Adapted from https://enwikipedia.org/wiki/Mpumalanga]
The following English terms and their Afrikaans translations are shown on the
topographical map:
ENGLISH AFRIKAANS
Golf course Gholfbaan
Landing strip Landingstrook
Furrow Voor
Sewage disposal works Rioolsuiweringswerke
Copyright reserved Please turn over
Geography/P2 17 DBE/May/June 2024
SC/NSC Confidential
3.1 MAP SKILLS AND CALCULATIONS
3.1.1 In which province is Middelburg located?
A Gauteng
B Mpumalanga
C KwaZulu-Natal
D Eastern Cape (1 x 1) (1)
Refer to block A5 on the topographical map and the building labelled 6 on the
orthophoto map.
3.1.2 (a) The scale of the topographical map is (smaller/larger) than the
scale of the orthophoto map. (1 x 1) (1)
(b) Refer to the building labelled 6 on the orthophoto map to give
a reason for your answer to QUESTION 3.1.2(a). (1 x 1) (1)
3.1.3 Calculate the vertical exaggeration of a cross-section on a
topographical map.
Use the following information:
Vertical scale: 1 : 2 000 (3 x 1) (3)
Formula:
3.1.4 Give ONE reason for exaggerating the vertical scale when drawing
a cross-section. (1 x 1) (1)
Refer to block D2 on the orthophoto map.
3.1.5 Calculate the area of the block in square metres (m²).
Use the following information:
Length: 4,2 cm
Breadth: 3,8 cm
Formula: Area = Length (L) x Breadth (B) (3 x 1) (3)
Copyright reserved Please turn over
Geography/P2 18 DBE/May/June 2024
SC/NSC Confidential
3.2 MAP INTERPRETATION
3.2.1 The residential area F in block B2 on the topographical map is a
(high/low)-income residential area. (1 x 1) (1)
3.2.2 Give evidence from the topographical map to support your answer
to QUESTION 3.2.1. (1 x 2) (2)
Refer to the landing strip G in block C4 and D4 on the topographical map.
3.2.3 (a) Name the land-use zone in which the landing strip is located.
(1 x 1) (1)
(b) Give evidence from the topographical map to show that the
landing strip is ideally located. (1 x 2) (2)
Refer to blocks C5 and D5 on the orthophoto map.
3.2.4 The type of farming evident is (small-scale/large-scale) farming.
(1 x 1) (1)
3.2.5 Give evidence to support your answer to QUESTION 3.2.4.
(1 x 2) (2)
Refer to block B5 on the topographical map.
3.2.6 Name the secondary activity evident in this area. (1 x 1) (1)
3.2.7 Why is this activity (answer to QUESTION 3.2.6) necessary for
economic development to take place in this area? (1 x 2) (2)
Copyright reserved Please turn over
Geography/P2 19 DBE/May/June 2024
SC/NSC Confidential
3.3 GEOGRAPHICAL INFORMATION SYSTEMS (GIS)
3.3.1 Data integration is an analysis of (single/multiple) data sources.
(1 x 1) (1)
Refer to block E2 on the topographical map and the sketch below that
represents block E2.
·1587
3.3.2 (a) H in block E2 on the topographical map represents
a (point/polygon) symbol. (1 x 1) (1)
Redraw the block above in the ANSWER BOOK.
(b) In the redrawn block, draw a line symbol that represents a
natural feature found east of spot height 1587 in block E2 on
the topographical map. (1 x 1) (1)
(c) How did the integration of the spot height in the sketch and the
symbol you have drawn assist in determining the location of
the dam wall at J? (1 x 2) (2)
Refer to the vacant land found in area 7 on the orthophoto map.
3.3.3 What term does a GIS specialist use to refer to the vacant land that
separates the river from the built-up area? (1 x 1) (1)
3.3.4 Give ONE reason why there is a need for this vacant land.
(1 x 2) (2)
TOTAL SECTION B: 30
GRAND TOTAL: 150
Copyright reserved
Study this subject
Recommended for this subject
Question paper
Geography Grade 12 P2 Eastern Cape Mock 2018 QP (Eng)
Memorandum
Geography Grade 12 Gauteng June 2024 Memo (English)
Memorandum
Geography Grade 12 P1 Gauteng Prelim 2024 Memo (English)
Question paper
Geography Grade 12 P2 NSC June 2023 Question Paper (English)
Question paper
Geography Grade 12 P2 NSC June 2022 Question Paper (Afr)
Question paper
Geography Grade 12 P2 NSC June 2021 Question Paper (English)
More from Grade 12 Geography
Memorandum
Geography Grade 12 Paper 2 Gauteng Mock 2025 Memo
Memorandum
Geography Grade 12 Paper 1 NSC November 2025 Memo (English)
Question paper
Geography Grade 12 P1 GP Prelim 2023 Question Paper (Eng)
Memorandum
Geography Grade 12 Paper 1 KZN Prelim 2023 Memo
Question paper
Geography Grade 12 Paper 2 KZN Prelim 2023 Question Paper
Question paper