
Confidential
NATIONAL
SENIOR CERTIFICATE
GRADE 12
GEOGRAPHY P1
NOVEMBER 2025
MARKS: 150
TIME: 3 hours
This question paper consists of 18 pages.
Copyright reserved Please turn over
Skip to contentAll 2025 papers 
View all

Geography Grade 12 P1 NSC November 2025 Question Paper (Eng)
Grade 12 Geography Paper 1 question paper from the NSC November Exam 2025 (English), 18 pages. Read online or download the free PDF.
Geography · Grade 12 · NSC November Exam · 2025 · English. Question paper, 18 pages. Read online or download the PDF.
- Subject
- Geography
- Grade
- Grade 12
- Language
- English
- Document type
- Question paper
- Year
- 2025
- Exam period
- NSC November Exam
- Paper
- 1
- Curriculum
- CAPS
- Pages
- 18
- File size
- 2.7 MB
Free to read online, no sign-up needed
Loading document…
Loading document…
1 of 18
This exam
Document textSearch extracted text and jump to a page.
Geography/P1 2 DBE/November 2025
NSC Confidential
INSTRUCTIONS AND INFORMATION
1. This question paper consists of TWO sections.
SECTION A
QUESTION 1: CLIMATE AND WEATHER (60)
QUESTION 2: GEOMORPHOLOGY (60)
SECTION B
QUESTION 3: GEOGRAPHICAL SKILLS AND TECHNIQUES (30)
2. Answer ALL THREE questions.
3. ALL diagrams are included in the question paper.
4. Leave a line between the subsections of questions answered.
5. Start EACH question at the top of a NEW page.
6. Number the answers correctly according to the numbering system used in this
question paper.
7. Do NOT write in the margins of the ANSWER BOOK.
8. Draw fully labelled diagrams when instructed to do so.
9. Answer in FULL SENTENCES, except when you have to state, name, identify
or list.
10. Units of measurement MUST be indicated in your final answer, e.g. 1020 hPa,
14 °C and 45 m.
11. You may use a non-programmable calculator.
12. You may use a magnifying glass.
13. Write neatly and legibly.
SPECIFIC INSTRUCTIONS AND INFORMATION FOR SECTION B
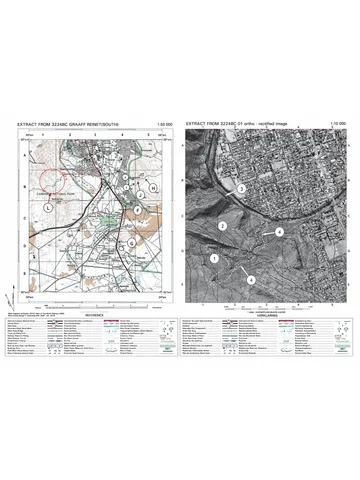
14. A 1 : 50 000 topographical map 3318DD STELLENBOSCH and a 1 : 10 000
orthophoto map 3318 DD 18 STELLENBOSCH are provided.
15. The area demarcated in RED/BLACK on the topographical map represents the
area covered by the orthophoto map.
16. Show ALL calculations. Marks will be allocated for steps in calculations.
17. You must hand in the topographical and orthophoto map to the invigilator at the
end of this examination session.
Copyright reserved Please turn over
Geography/P1 3 DBE/November 2025
NSC Confidential
SECTION A: CLIMATE AND WEATHER AND GEOMORPHOLOGY 2025
QUESTION 1: CLIMATE AND WEATHER
1.1 The questions are based on synoptic weather map interpretation. Complete the
statements in COLUMN A with the options in COLUMN B. Write only Y or Z
next to the question numbers (1.1.1 to 1.1.8) in the ANSWER BOOK,
e.g. 1.1.9 Y.
COLUMN A COLUMN B
1.1.1 The name of the air pressure cell that Y heat low
dominates the interior of South Africa in Z Kalahari high
winter
1.1.2 Air movement associated with high- Y convergence
pressure cells Z divergence
1.1.3 The general direction of movement of a Y easterly
coastal low-pressure system is … Z westerly
1.1.4 The … is known as a blocking high when Y South Indian high
it is in the path of the mid-latitude cyclone. Z Kalahari high
1.1.5 The elongation of isobars extending Y diverging
outwards from a high-pressure cell is Z ridging
referred to as …
1.1.6 A … is found between two air masses of Y moisture front
different moisture contents. Z inter-tropical
convergence zone
1.1.7 The conditions represented in the sketch Y line thunderstorms
below will lead to … Z berg winds
[Source: Examiner's own sketch]
1.1.8 Rainfall with 20 knots of wind is likely Y Durban (Dbn)
at … Z Cape Town (CT)
[Source: Examiner's own sketch]
(8 x 1) (8)
Copyright reserved Please turn over
Geography/P1 4 DBE/November 2025
NSC Confidential
1.2 Various options are provided as possible answers to the following questions.
Choose the answer and write only the letter (A–D) next to the question numbers
(1.2.1 to 1.2.7) in the ANSWER BOOK, e.g. 1.2.8 D.
Refer to the photograph on slope aspect below to answer QUESTIONS 1.2.1
to 1.2.3.
[Source: https://upload.wikimedia.org/wikipedia/commons/d/d8/Effects_of_aspect.JPG]
1.2.1 Slope aspect refers to …
A upslope movement of air in a valley.
B climate on a smaller scale.
C a zone of warmer air in the valley.
D slope direction in relation to the sun.
1.2.2 The photograph represents a valley in the … Hemisphere.
A Northern
B Eastern
C Southern
D Western
1.2.3 Slope B represents a … and … slope.
(i) cooler
(ii) warmer
(iii) moist
(iv) drier
A (i) and (ii)
B (ii) and (iii)
C (i) and (iii)
D (ii) and (iv)
Copyright reserved Please turn over
Geography/P1 5 DBE/November 2025
NSC Confidential
Refer to the photograph on valley winds below to answer QUESTIONS 1.2.4
to 1.2.7.
[Source: https://d19lgisewk9l6l.cloudfront.net/assetbank/Oudtshoorn_.jpg]
1.2.4 The arrows at A indicate a/an … wind.
A anabatic
B katabatic
C upslope
D onshore
1.2.5 The main conditions for the formation of the wind at A are … and …
(i) terrestrial radiation
(ii) solar radiation
(iii) low temperatures
(iv) high temperatures
A (i) and (iii)
B (i) and (iv)
C (ii) and (iii)
D (ii) and (iv)
1.2.6 … forms when the dew point temperature of air is below freezing point
on the valley floor.
A Mist
B Fog
C Frost
D Smog
1.2.7 The negative physical (natural) impact of the answer to
QUESTION 1.2.6 is that it …
A reduces visibility.
B increases pollution.
C increases rainfall.
D destroys vegetation. (7 x 1) (7)
Copyright reserved Please turn over
Geography/P1 6 DBE/November 2025
NSC Confidential
1.3 Refer to the sketches below on the mid-latitude cyclone.
A B
[Source: Examiner's own sketch] [Source: Examiner's own sketch]
C D
[Source: https://www.google.com/search?+impact of mid-latitude cyclones]
1.3.1 What is the name of the boundary between two air masses, as
shown in sketch A? (1 x 1) (1)
1.3.2 Give ONE reason why the boundary between the two air masses in
sketch A would form a wave. (1 x 1) (1)
1.3.3 Name the stage of development of the mid-latitude cyclone
associated with weather conditions in photographs C and D. (1 x 1) (1)
1.3.4 Explain how the weather conditions illustrated in photographs C
and D developed during the stage named in QUESTION 1.3.3.
(2 x 2) (4)
1.3.5 In the ANSWER BOOK, draw a fully labelled cross-section of a cold
front (E–F) in sketch B. Clearly indicate the following:
(a) Correct cross-section
(b) General direction of movement of the mid-latitude cyclone
(c) Cloud type
(d) Sector (4 x 1) (4)
Copyright reserved Please turn over
Geography/P1 7 DBE/November 2025
NSC Confidential
1.3.6 Refer to sketch B. Explain how the difference in temperature of the
air masses behind the cold front and ahead of the warm front will
result in the formation of a cold front occlusion. (2 x 2) (4)
1.4 Refer to the infographic below on Tropical Cyclone Dikeledi.
A: FACT FILE B: LOCATION MAP
Tropical Cyclone Dikeledi was first
observed off the north-east coast of
Madagascar.
Conditions recorded on
8 January 2025:
Pressure in the centre: 996 hPa
Maximum wind speed: 75 km/h
Conditions recorded on
13 January 2025:
Pressure in the centre: 976 hPa
Maximum wind speed: 150 km/h [Source: Examiner's own sketch]
C: SATELLITE IMAGE D: SATELLITE IMAGE
Time span: 2025/01/08 03:30 to Time span: 2025/01/13 14:00 to
2025/01/08 14:00 UTC 2025/01/13 15:30 UTC
[Adapted from https://afriwx.co.za/synoptic-charts/]
1.4.1 According to the fact file, in which stage of development was Tropical
Cyclone Dikeledi on 8 January 2025? (1 x 1) (1)
1.4.2 Give TWO reasons in the fact file to support your answer to
QUESTION 1.4.1. (2 x 1) (2)
Refer to location map B.
1.4.3 Explain why Tropical Cyclone Dikeledi developed between
5° and 20° south of the equator. (2 x 2) (4)
Copyright reserved Please turn over
Geography/P1 8 DBE/November 2025
NSC Confidential
Refer to the satellite images C and D.
1.4.4 Describe the weather conditions associated with the forward left-
hand quadrant (dangerous semicircle) in satellite image D. (2 x 2) (4)
1.4.5 Explain why Tropical Cyclone Dikeledi intensified from 8 January to
13 January 2025. (2 x 2) (4)
1.5 Refer to the synoptic weather map below showing South African berg winds.
Extremely hot and uncomfortable conditions are expected across the Eastern Cape.
Temperatures are expected to rise above 30 °C.
[Adapted from https://SAWS#WatherOutlook#Southafricanweather]
1.5.1 Name ONE South African city indicated on the synoptic weather map
that is experiencing berg wind conditions. (1 x 1) (1)
1.5.2 Give evidence from the synoptic weather map to support your
answer to QUESTION 1.5.1. (1 x 2) (2)
1.5.3 Explain the processes that lead to berg winds being warm and dry.
(2 x 2) (4)
1.5.4 The warm and dry conditions can influence veld fires. In a paragraph
of approximately EIGHT lines, suggest sustainable strategies that
can be put in place to reduce the negative impact of veld fires.
(4 x 2) (8)
[60]
Copyright reserved Please turn over
Geography/P1 9 DBE/November 2025
NSC Confidential
QUESTION 2: GEOMORPHOLOGY
2.1 Refer to the sketch below based on drainage basins. Complete the statements
in COLUMN A with the options in COLUMN B. Write only Y or Z next to the
question numbers (2.1.1 to 2.1.8) in the ANSWER BOOK, e.g. 2.1.9 Y.
[Source: Examiner's own sketch]
COLUMN A COLUMN B
2.1.1 The main river A and its tributaries are Y catchment area
referred to as a … Z river system
2.1.2 The ... in area B separates one stream Y watershed
from another. Z interfluve
2.1.3 The area at C will have a ... infiltration Y low
rate. Z high
2.1.4 The river at D is a ... river. Y permanant
Z periodic
2.1.5 The confluence on the sketch is located Y E
at … Z F
2.1.6 ... will increase in area G due to the steep Y Infiltration
slope. Z Run-off
2.1.7 The stage of the river at H is the … Y lower
course. Z middle
2.1.8 The water table at I will resemble … Y
Z
(8 x 1) (8)
Copyright reserved Please turn over
Geography/P1 10 DBE/November 2025
NSC Confidential
2.2 Refer to the sketches below on river capture. Various options are provided as
possible answers to the following questions. Choose the answer and write only
the letter (A–D) next to the question numbers (2.2.1 to 2.2.7) in the ANSWER
BOOK, e.g. 2.2.8 D.
[Adapted from https://www.google.com/url?sa=expeditieaarde.blogspot.com%river capture-]
2.2.1 A river that has its water diverted into another river is referred to as
a…
A captured stream.
B stream piracy.
C captor stream.
D headward stream.
2.2.2 Rivers flowing over areas with a … are more likely to be the captor
stream.
A gentle gradient and soft rock
B steep gradient and low rainfall
C steep gradient and soft rock
D heavy rainfall and resistant rock
2.2.3 Evidence that river capture has taken place in sketch B:
A River Y has more water flowing in it.
B River Y has captured the headwaters of river X.
C River X has captured the headwaters of river Y.
D River X has a smaller drainage basin.
2.2.4 The cause of river capture, as shown in sketch B, is …
A headward erosion by river Y.
B lateral erosion by river X.
C headward erosion by river X.
D vertical erosion by river Y.
Copyright reserved Please turn over
Geography/P1 11 DBE/November 2025
NSC Confidential
2.2.5 The part of the river that has less water after river capture is known
as the … stream.
A captor
B non-perennial
C perennial
D misfit
2.2.6 River X has more erosive power after river capture because of …
A a greater volume of water and turbulent stream flow.
B a greater volume of water and laminar flow.
C headward erosion and turbulent stream flow.
D rejuvenation and laminar flow.
2.2.7 The physical (natural) impact of river capture on the captor stream
is that the … and …
(i) drainage basin decreases
(ii) river rejuvenation takes place
(iii) deposition increases
(iv) water flows faster
A (i) and (iv)
B (i) and (iii)
C (ii) and (iv)
D (ii) and (iii) (7 x 1) (7)
Copyright reserved Please turn over
Geography/P1 12 DBE/November 2025
NSC Confidential
2.3 Refer to the sketches below showing two longitudinal river profiles.
[Source: Examiner's own sketch]
2.3.1 What is a longitudinal profile? (1 x 2) (2)
2.3.2 Which ONE of the sketches above shows a graded longitudinal
profile? (1 x 1) (1)
2.3.3 Give evidence in the sketch to support your answer to
QUESTION 2.3.2. (2 x 1) (2)
2.3.4 Classify EACH of the temporary base levels in sketch A as either
natural or human-made. (2 x 1) (2)
2.3.5 Why is the sea indicated as the permanent base level? (1 x 2) (2)
Refer to cross-profiles C and D.
2.3.6 Differentiate between the shapes of the cross-profiles at C and D.
(1 x 2) (2)
2.3.7 Explain the main processes that give rise to the difference in the
shape of cross-profiles C and D. (2 x 2) (4)
Copyright reserved Please turn over
Geography/P1 13 DBE/November 2025
NSC Confidential
2.4 Refer to photographs A and B below showing meanders.
A B
[Source: https://www.google.com/search?+meanders&tbm]
2.4.1 Meanders are more likely to form in the (upper/lower) stage/course
of a river. (1 x 1) (1)
2.4.2 Account for the gentle gradient of the inner bank at C in
photograph A. (1 x 2) (2)
Refer to photograph B and cross-section E–F.
2.4.3 How does the process of river rejuvenation lead to the formation of
incised meanders? (2 x 2) (4)
2.4.4 Refer to photograph A. In a paragraph of approximately EIGHT lines,
explain how an oxbow lake is formed. (4 x 2) (8)
Copyright reserved Please turn over
Geography/P1 14 DBE/November 2025
NSC Confidential
2.5 Refer to the extract and photograph below on catchment and river
management.
IMPACT OF SETTLEMENTS ON RIVER MANAGEMENT
Dense settlements that locate along rivers have a negative impact on rivers.
The main reason is that these settlements generally receive poor service
provision. These poor communities also do not have the means to pay for the
provision of services, such as waste removal.
When large amounts of waste pile up in the settlement, the community is more
likely to dispose of the waste in the river. This leads to further pollution,
eventually leading to serious health risks for the community.
[Adapted from https://witsvuvuzela.com/2022/11/28/-residents-live-on-the-edge-of-a-health-
hazard/]
2.5.1 According to the extract, why are dense settlements along rivers
associated with pollution? (1 x 1) (1)
2.5.2 Give TWO reasons from the photograph to support your answer to
QUESTION 2.5.1. (2 x 1) (2)
2.5.3 Explain how the rise in the water level of the river will negatively
affect the houses (in the photograph) due to their location. (1 x 2) (2)
2.5.4 Explain the negative impact of poor river management on the health
of rivers. (2 x 2) (4)
2.5.5 Suggest strategies that the municipality can put in place to ensure
the sustainability of the river in the photograph. (3 x 2) (6)
[60]
TOTAL SECTION A: 120
Copyright reserved Please turn over
Geography/P1 15 DBE/November 2025
NSC Confidential
SECTION B
QUESTION 3: GEOGRAPHICAL SKILLS AND TECHNIQUES
GENERAL INFORMATION ON STELLENBOSCH
Coordinates: 33°45ꞌS; 18°45ꞌE
Stellenbosch is located in a hilly, sheltered valley within the Cape Winelands, with an
average elevation of 136 metres above sea level, surrounded by hills and mountains,
like Papegaaiberg, Stellenboschberg, and the Jonkershoek, Drakenstein and
Simonsberg mountain ranges. It is situated approximately 50 kilometres east of Cape
Town.
Stellenbosch has a Mediterranean climate with warm, dry summers and cool, rainy
winters.
The Eerste River originates in the Jonkershoek Mountains, 60 kilometres east of Cape
Town, and flows through the Jonkershoek Valley before reaching Stellenbosch.
[Adapted from https://en.wikipedia.org/wiki/Stellenbosch]
The following English terms and their Afrikaans translations are shown on the
topographical map:
ENGLISH AFRIKAANS
River Rivier
Nature reserve Natuurreservaart
Mountain Berg
Copyright reserved Please turn over
Geography/P1 16 DBE/November 2025
NSC Confidential
3.1 MAP SKILLS AND CALCULATIONS
3.1.1 Calculate the difference in height between trigonometrical station F
in block C3 and trigonometrical station G in block D3. (2 x 1) (2)
3.1.2 The natural feature found at 33°58ꞌ29"S; 18°54ꞌ15"E is a …
A trigonometrical station.
B perennial river.
C saddle.
D spot height. (1 x 1) (1)
3.1.3 Calculate the average gradient from 6 in block E5 to 7 in block D5
on the orthophoto map.
Use the following information:
Vertical interval (VI) = 60 m
Formula: Vertical Interval (VI)
Horizontal Equivalent (HE) (4 x 1) (4)
3.1.4 Match the average gradient (answer to QUESTION 3.1.3) with
sketch A or B below.
A B
(1 x 1) (1)
3.1.5 Is L in block C2 visible from H in block C4 on the topographical map?
(1 x 1) (1)
3.1.6 Give a reason for your answer to QUESTION 3.1.5. (1 x 1) (1)
Copyright reserved Please turn over
Geography/P1 17 DBE/November 2025
NSC Confidential
3.2 MAP INTERPRETATION
3.2.1 Stellenbosch has a … climate.
A tropical
B arid
C Mediterranean
D subtropical (1 x 1) (1)
3.2.2 Stellenbosch experiences seasonal rainfall. Give evidence from
block A5 on the topographical map to support this statement. (1 x 1) (1)
Refer to area 8 on the orthophoto map.
3.2.3 Explain why area 8 will experience lower temperatures than the
surrounding built-up area. (1 x 2) (2)
Refer to the row of trees labelled J in block E3 on the topographical map.
3.2.4 State the general wind direction experienced in the area around J
during the night. (1 x 1) (1)
3.2.5 Give evidence from the map to support your answer to
QUESTION 3.2.4. (1 x 2) (2)
Refer to the topographical map.
3.2.6 Stellenboschberg is a watershed. Give evidence from the map to
support this statement. (1 x 2) (2)
Refer to the photograph of a river located in Stellenbosch.
[Source: shutterstock.com]
3.2.7 Will the river depicted on the photograph be located at K in block D1
or L in block C2? (1 x 1) (1)
3.2.8 Give a reason for your answer to QUESTION 3.2.7. (1 x 2) (2)
Copyright reserved Please turn over
Geography/P1 18 DBE/November 2025
NSC Confidential
3.3 GEOGRAPHICAL INFORMATION SYSTEMS (GIS)
3.3.1 The number 310, labelled M on the main road in block A3 on the
topographical map, is referred to as … data.
A spatial
B vector
C attribute
D numerical (1 x 1) (1)
3.3.2 Identify a natural line feature in block A4 on the topographical map.
(1 x 1) (1)
Refer to area 9 in block A3 on the orthophoto map.
3.3.3 Using data manipulation, explain how you would manipulate the
scale at area 9 to make the image clearer. (1 x 2) (2)
3.3.4 … refers to the clarity of an image.
A Data integration
B Buffering
C Data sharing
D Resolution (1 x 1) (1)
Refer to the images of the Danie Craven Stadium below, extracted from
block D1/D2 on the orthophoto map.
A B
[Source: https://earth.google.com/web/search/Danie+Craven+Stadium,+Coetzenburg+Street/@-A]
3.3.5 Which photograph, A or B, has fewer pixels? (1 x 1) (1)
3.3.6 Give a reason for your answer to QUESTION 3.3.5. (1 x 2) (2)
TOTAL SECTION B: 30
GRAND TOTAL: 150
Copyright reserved
Study this subject
Recommended for this subject
Question paper
Geography Grade 12 P1 GP Prelim 2023 Question Paper (Eng)
Question paper
Geography Grade 12 P1 Gauteng Mock 2022 Question Paper (Eng)
Question paper
Geography Grade 12 P1 Eastern Cape Mock 2019 QP (Eng)
Question paper
Geography Grade 12 P1 EC June 2016 Question Paper (English)
Question paper
Geography Grade 12 P1 NSC November 2021 Question Paper (Afr)
Question paper
Geography Grade 12 P1 NSC November 2020 Question Paper (Eng)
More from Grade 12 Geography
Memorandum
Geography Grade 12 Paper 2 Gauteng Mock 2025 Memo
Memorandum
Geography Grade 12 Gauteng June 2024 Memo (English)
Memorandum
Geography Grade 12 P1 Gauteng Prelim 2024 Memo (English)
Memorandum
Geography Grade 12 Paper 1 KZN Prelim 2023 Memo
Question paper
Geography Grade 12 Paper 2 KZN Prelim 2023 Question Paper
Question paper