
NATIONAL
SENIOR CERTIFICATE
GRADE 11
NOVEMBER 2020
GEOGRAPHY P2
EXEMPLAR
MARKS: 150
TIME: 2 hours
*IGEOGE2*
This question paper consists of 10 pages.
Skip to contentAll 2020 papers 
View all
Geography Grade 11 P2 National Exemplar November 2020 Memo
Grade 11 Geography Paper 2 memorandum from the National Exemplar November Exam 2020 (English), 32 pages. Read online or download the free PDF.
Geography · Grade 11 · National Exemplar November Exam · 2020. Memorandum, 32 pages. Read online or download the PDF.
- Subject
- Geography
- Grade
- Grade 11
- Document type
- Memorandum
- Year
- 2020
- Exam period
- National Exemplar November Exam
- Paper
- 2
- Curriculum
- CAPS
- Pages
- 32
- File size
- 856.6 KB
Free to read online, no sign-up needed
Loading document…
Loading document…
1 of 32
This exam
National Exemplar November Exam 2020
- Paper 1Question paper · EngQuestion paper · Eng (2)Question paper · AfrQuestion paper · Afr (2)Addendum · EngAddendum · Eng (2)Addendum · AfrAddendum · Afr (2)Memo · EngMemo · Eng (2)Memo · Eng (3)Memo · Eng (4)Memo · AfrMemo · Afr (2)Memo · Afr (3)Memo · Afr (4)
- Paper 2Question paper · EngQuestion paper · Eng (2)Question paper · AfrQuestion paper · Afr (2)Addendum · EngAddendum · Eng (2)Addendum · AfrAddendum · Afr (2)Memo · EngMemo · Eng (2)Memo · Eng (3)Memo · Eng (4)Memo · AfrMemo · Afr (2)Memo · Afr (3)
Document textSearch extracted text and jump to a page.
2 GEOGRAPHY P2 (EC/NOVEMBER 2020)
INSTRUCTIONS AND INFORMATION
1. This question paper consists of THREE questions.
2. All diagrams are included in the ANNEXURE.
3. Where possible, illustrate your answers with labelled diagrams.
4. Leave a line between subsections of questions answered.
5. Start EACH question at the top of a NEW page.
6. Number the questions correctly according to the numbering system used in
this question paper.
7. Do NOT write in the margins of the ANSWER BOOK.
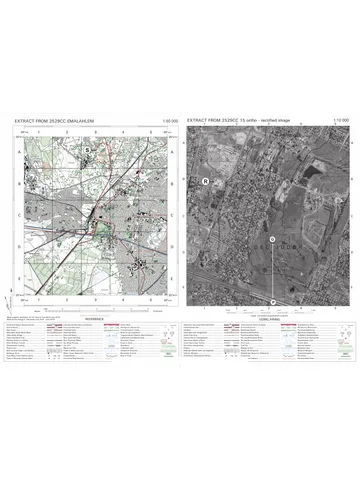
8. In SECTION B you are provided with a 1 : 50 000 topographical map
(2527BD HARTBEESPOORT DAM) and an orthophoto map of a part of the
mapped area.
9. Show ALL calculations and formulae, where applicable. Marks will be
allocated for these.
10. Indicate the unit of measurement in the final answer of calculations,
e.g. 10 km; 2,1 cm.
11. You may use a non-programmable calculator and a magnifying glass.
12. The area demarcated in RED and BLACK on the topographical map
represents the area covered by the orthophoto map.
13. Write neatly and legibly.
Copyright reserved Please turn over
(EC/NOVEMBER 2020) GEOGRAPHY P2 3
SECTION A: DEVELOPMENT GEOGRAPHY, RESOURCES AND
SUSTAINABILITY
QUESTION 1
1.1 Choose the correct word(s) from those given in brackets which will make each
statement geographically CORRECT. Write only the word(s) next to the
question numbers (1.1.1–1.1.8).
1.1.1 According to the Brandt report, 80% of the world’s income is earned in
the (north/south).
1.1.2 (MEDCs/LEDCs) export mainly raw materials.
1.1.3 A limitation of (Rostow’s/Friedman’s) model is that it does not take
population growth rate into consideration.
1.1.4 Finding a vaccine for the coronavirus (COVID-19) is an example of
development from a (regional/global) context.
1.1.5 (Top down/Bottom up) approach is often a more successful approach
in community-based development.
1.1.6 The sustainability model involves the (core and periphery/economy and
environment).
1.1.7 Development in (MEDC/LEDC) countries is achieved by a market
economy. (7 x 1) (7)
1.2 Various options are provided as possible answers to the following questions.
Choose the answer and write only the letter (A–D) next to the question numbers
(1.2.1–1.2.8) in the ANSWER BOOK, for example 1.2.9 A.
1.2.1 … is the world’s most traded commodity.
A Cotton
B Wheat
C Oil
D Gold
1.2.2 Aid from donor countries that includes masks and ventilators in times
of a medical crisis, is an example of … aid.
A technical
B conditional
C export
D humanitarian
1.2.3 … forms the basis of an export-led approach to development.
A Technology
B Manufacturing
C Mining
D Construction
Copyright reserved Please turn over
4 GEOGRAPHY P2 (EC/NOVEMBER 2020)
1.2.4 … is/are an example of a trading relationship that protects local
products from foreign competition.
A Trade barriers
B Free trade
C Fair trade
D Unfair trade
1.2.5 A Gender Inequality Index (GII) of … indicates more equality among
males and females.
A 0,83
B 0,48
C 0,21
D 0,64
1.2.6 Trade blocs encourage …
A fair trade
B unfair trade.
C free trade.
D trade barriers.
1.2.7 … describes the relationship between the value of a country’s exports
and imports.
A Terms of trade
B Balance of trade
C Balance of payments
D Gross national product
1.2.8 … is the world’s fastest developing economy.
A South Africa
B Japan
C China
D India (8 x 1) (8)
Copyright reserved Please turn over
(EC/NOVEMBER 2020) GEOGRAPHY P2 5
1.3 Refer to the cartoon in FIGURE 1.3 showing an economic indicator of
development.
1.3.1 What is the Gini coefficient? (1 x 1) (1)
1.3.2 How does the cartoon portray the Gini coefficient? (1 x 1) (1)
1.3.3 Would the Gini coefficient in this cartoon show a statistical score closer
to zero (0) or one (1)? (1 x 1) (1)
1.3.4 Discuss THREE ways in which a country can improve on sharing
wealth in a country. (3 x 2) (6)
1.3.5 Explain how THREE positive demographic indicators can show an
improvement of the economic level of development in a country.(3 x 2) (6)
1.4 Read the article in FIGURE 1.4 referring to globalisation.
1.4.1 According to the article, how did globalisation aid in the spread of the
COVID-19 pandemic? (1 x 1) (1)
1.4.2 Quote ONE advantage of globalisation from the article. (1 x 1) (1)
1.4.3 Name ONE example of a multinational corporation (MNC) in the
article. (1 x 1) (1)
1.4.4 Discuss how the COVID-19 pandemic would be a disadvantage to
multinational corporations (MNCs). (2 x 2) (4)
1.4.5 Write a paragraph of approximately EIGHT lines explaining why
globalisation is still viewed as the main stimulus of economic growth in
the world. (4 x 2) (8)
1.5 Read the case study in FIGURE 1.5 on community development in Zambia and
answer the questions that follow.
1.5.1 State whether the case study refers to rural or urban community
development. (1 x 1) (1)
1.5.2 Describe TWO examples to prove that Veronica’s quality of life has
improved. (2 x 2) (4)
1.5.3 The improved quality of life for these individuals will probably have
positive ripple effects in their community. Suggest TWO positive ripple
effect for Veronica’s community. (2 x 2) (4)
1.5.4 Describe THREE advantages of using this type of technology referred
to in the case study. (3 x 2) (6)
[60]
Copyright reserved Please turn over
6 GEOGRAPHY P2 (EC/NOVEMBER 2020)
QUESTION 2
2.1 Various options are provided as possible answers to the following questions.
Choose the answer and write only the letter (A–D) next to the question numbers
(2.1.1–2.1.7) in the ANSWER BOOK, for example 2.1.8 A.
2.1.1 ... is the only commercial nuclear power station in South Africa.
A Kusile
B Arnot
C Koeberg
D Lethabo
2.1.2 Green energy is ...
A produced from fossil fuels.
B renewable.
C non-renewable.
D a product from greenhouse gases.
2.1.3 ... is the power utility producing most of South Africa’s electrical energy.
A Telkom
B Sasol
C Eskom
D Koeberg
2.1.4 The amount of carbon dioxide emitted into the atmosphere by an
individual is referred to as ...
A greenhouse footprint.
B green movement.
C carbon footprint.
D environmental footprint.
2.1.5 The ... signed in 1997 requires countries to reduce the amount of their
greenhouse gas emissions.
A Paris accord
B COP 17
C BRICS treaty
D Kyoto Protocol
2.1.6 Energy gained from hot rocks below the earth’s surface is called ...
energy.
A biomass
B geothermal
C wind
D biofuel
Copyright reserved Please turn over
(EC/NOVEMBER 2020) GEOGRAPHY P2 7
2.1.7 ... is the mineral needed for the generation of nuclear power.
A Coal
B Gold
C Uranium
D Platinum (7 x 1) (7)
2.2 Choose the correct word(s) from those given in brackets which will make each
statement geographically CORRECT. Write only the word(s) next to the
question numbers (2.2.1–2.2.8).
2.2.1 The (D/R) horizon is the deepest soil horizon in the soil profile.
2.2.2 A (steep/gentle) topography results in well-drained and steeper soils.
2.2.3 Deforestation is a (human/physical) agent of erosion.
2.2.4 Soil colour is influenced by (time/parent material).
2.2.5 Humus content is mostly found in the (top soil/sub soil).
2.2.6 The main agent of soil erosion is (water/drought).
2.2.7 (Renewable/Non-renewable) resources are produced by nature
constantly.
2.2.8 Partially weathered rock material is found in the (regolith/subsoil).
(8 x 1) (8)
2.3 Refer to the cartoon in FIGURE 2.3 showing the relationship between
resources and economic development.
2.3.1 Name the natural resource being depleted in the cartoon. (1 x 1) (1)
2.3.2 According to the cartoon, why is this natural resource being depleted?
(2 x 1) (2)
2.3.3 How does the depletion of this natural resource affect the environment?
(2 x 1) (2)
2.3.4 Discuss the positive economic impact that the depletion of this resource
has for development in a country. (2 x 2) (4)
2.3.5 Explain how countries could implement more sustainable strategies to
protect their natural resources. (3 x 2) (6)
Copyright reserved Please turn over
8 GEOGRAPHY P2 (EC/NOVEMBER 2020)
2.4 Refer to FIGURE 2.4 showing South Africa’s energy plan.
2.4.1 What percentage of South Africa’s energy plan would coal make up
in 2030? (1 x 1) (1)
2.4.2 Name any TWO other conventional sources of energy that will be a
part of South Africa’s energy plan in 2030. (2 x 1) (2)
2.4.3 Why would South Africa still be so reliant on coal in 2030? (2 x 1) (2)
2.4.4 Discuss the impact that South Africa’s reliance on coal would have
on the environment. (2 x 2) (4)
2.4.5 Explain why nuclear energy would not play a major role in South
Africa’s energy plan in 2030. (3 x 2) (6)
2.5 Refer to FIGURE 2.5 which illustrates non-conventional sources of energy.
2.5.1 Why are solar and wind energy examples of non-conventional
sources of energy? (1 x 1) (1)
2.5.2 Give TWO pieces of evidence from the sketch to support the
statement that the source of non-conventional energy is relatively
cheap. (2 x 1) (2)
2.5 3 How can solar energy be advantageous to South Africa’s current
energy sources? (2 x 1) (2)
2.5.4 Describe the negative impact that wind turbines, used to generate
wind energy, have on the environment. (1 x 2) (2)
2.5.5 In a paragraph of approximately EIGHT lines, explain the impact of
the non-conventional sources of energy, depicted in the sketch, on
the economy of South Africa. (4 x 2) (8)
[60]
Copyright reserved Please turn over
(EC/NOVEMBER 2020) GEOGRAPHY P2 9
SECTION B: GEOGRAPHICAL SKILLS AND TECHNIQUES
The questions below are based on the 1 : 50 000 topographical map 2527 DB
HARTBEESPOORT DAM, as well as the orthophoto map of a part of the mapped
area.
3.1 3.1.1 The scale of the topographic map is 1 : 50 000. Write down the scale
as a word scale. (1 x 1) (1)
3.1.2 What is the straight-line distance from trigonometrical station 104 in
block C2 to spot height 1521 in block B3? Give your answer in
metres. (2 x 1) (2)
3.2 3.2.1 Calculate the magnetic declination of Hartbeespoort Dam for 2020.
Show ALL calculations. Marks will be awarded for calculations.
(5 x 1) (5)
3.2.2 Compare the magnetic declination for 2020 to the magnetic declination
for 2012 and indicate which one is bigger. (1 x 1) (1)
3.2.3 Motivate your answer to QUESTION 3.2.2. (1 x 1) (1)
3.3 3.3.1 The feature at 5 on the orthophoto map is/are a/an …
A rugby fields.
B tennis courts.
C open-parking area.
D purification plant.
3.3.2 The primary economic activity at P in block A1 is a/an …
A sports fields.
B excavations.
C cultivation.
D non-perennial river.
3.3.3 Identify the environmental factor affecting the area in block C5:
A River
B Dam
C Sewage works
D Road (3 x 1) (3)
Copyright reserved Please turn over
10 GEOGRAPHY P2 (EC/NOVEMBER 2020)
3.4 Refer to the FACT FILE (FIGURE 3.4) on the Hartbeespoort Dam and the
topographical map:
The Schoemansville town council has decided to try and improve the level of
development of this area through tourism. Discuss how the council would
promote this area using evidence from blocks B2 and B3. (2 x 2) (4)
3.5 Refer to block E1 on the topographical map.
3.5.1 Identify the environmental problem found in the area. (1 x 1) (1)
3.5.2 What TWO sustainable strategies can be implemented to prevent and
control the impact identified in QUESTION 3.5.1? (2 x 2) (4)
GEOGRAPHICAL INFORMATION SYSTEMS (GIS)
3.6 Refer to FIGURE 3.6 taken of the Hartbeespoort Dam found in block B2 on the
topographical map, and answer the following questions.
3.6.1 Is the photograph a raster or a vector image? (1 x 1) (1)
3.6.2 Give a reason for your answer to QUESTION 3.6.1. (1 x 2) (2)
3.6.3 What type of spatial object is the dam wall in block B2 on the
topographical map? (1 x 1) (1)
3.7 Refer to the orthophoto map.
3.7.1 Does the orthophoto map have a low or high resolution?
Give a reason for your answer. (1 + 1 x 2) (3)
3.7.2 Name ONE factor in the remote sensing process that will affect the
resolution of the orthophoto map. (1 x 1) (1)
[30]
GRAND TOTAL: 150
Copyright reserved Please turn over
NATIONAL
SENIOR CERTIFICATE
GRADE 11
NOVEMBER 2020
GEOGRAPHY P2
ANNEXURE
EXEMPLAR
*IGEOGE4*
This annexure consists of 7 pages.
2 GEOGRAPHY P2 (ANNEXURE) (EC/NOVEMBER 2020)
FIGURE 1.3: ECONOMIC INDICATOR OF DEVELOPMENT
[Source: internationalmoneyreform.org/news]
FIGURE 1.4: GLOBILISATION
An epidemic of globalisation – and the globalisation of an epidemic
Apr 03 2020 20:11
John Luiz
The extraordinary events associated with the spread of the COVID-19 virus over the past
few months has highlighted various weaknesses associated with globalisation. We have
gained from this, but with COVID-19 we are experiencing one of many drawbacks
associated with this model. We have seen the globalisation of an epidemic – now a
pandemic – that respects no borders. In many respects we have been fortunate that
something matching this scale has not happened earlier despite previous hints at this.
The other perspective is that of the epidemic of globalisation itself and what has been
exposed as a result of this virus. The benefits of globalisation in manufacturing has lowered
costs and facilitated specialisation associated with presumed competitive advantages.
To give two examples: The giant Boeing 787 Dreamliner has massive plants in Italy, Japan
and United States manufacturing the one-piece composite fuselage barrels and wings and
these aspects need to be completely in-sync and integrated across the globe. A major
American notebook computer has its LCD display manufactured in South Korea or Taiwan,
the microprocessor and motherboard in China, the memory in Japan, the hard disk drive in
Singapore, Thailand or the Philippines, and the battery in Malaysia or Mexico.
[Source: www.fin24.com]
Copyright reserved Please turn over
(EC/NOVEMBER 2020) GEOGRAPHY P2 (ANNEXURE) 3
FIGURE 1.5: COMMUNITY DEVELOPMENT
VERONICA BUILDS A HOUSE WITH TOMATOES
Veronica Sianchenga was one of the first in her village to buy the Mosi-o-Tunya, a low cost
irrigation system that is manufactured in Zambia. It costs less than the imported pumps and
produces a higher output because it was designed for the specific local topography of rural
Zambia. Using their Mosi-o-Tunya, Veronica’s family has already started reaping the
benefits of additional income from irrigated produce thanks to IDE’s links to wholesalers and
caterers in Livingstone.
Hard work and keen entrepreneurial instincts have resulted in a dramatically improved
quality of life for Veronica and her family. Due to an increased productivity and sales, in
less than one year, she has been able to build a new house and send her children to
school.
Easy to use tread pump can pump water
from a well or a river and easily transported.
[Adapted from http -/hvw w. ideorg.org/OurResults/SucœssStories'Veronica.aspx]
Copyright reserved Please turn over
4 GEOGRAPHY P2 (ANNEXURE) (EC/NOVEMBER 2020)
FIGURE 2.3: RESOURCES AND ECONOMIC DEVELOPMENT
[Source: cartoonimage.com]
FIGURE 2.4: CONVENTIONAL ENERGY SOURCES
[Source: www.satsssa.gov.za]
Copyright reserved Please turn over
(EC/NOVEMBER 2020) GEOGRAPHY P2 (ANNEXURE) 5
FIGURE 2.5: NON CONVENTIONAL SOURCES OF ENERGY
KITE
[Source: dreamstime.com]
Copyright reserved Please turn over
6 GEOGRAPHY P2 (ANNEXURE) (EC/NOVEMBER 2020)
SECTION B: GENERAL INFORMATION ON HARTBEESPOORT DAM
Hartbeespoort Dam (also known
Coordinates: 25° 44′ 39″ S, 27° 53′ 58″ E as Harties) is an arch type dam situated
in the North West Province of South
Africa. It lies in a valley to the south of
the Magaliesberg mountain range and
north of the Witwatersberg mountain
range, about 35 kilometres north west
of Johannesburg and 20 kilometres
Hartbeespoort .
west of Pretoria.
A
The dam was originally designed
for irrigation, which is currently its
primary use, as well as for domestic
and industrial use.
The town consists of holiday homes
and permanent residences around the
dam as it is popular with visitors from
nearby Gauteng Province.
Hartbeespoort Aerial Cableway is (the
longest monocableway in Africa.
FIGURE 3.4: FACT FILE ON HARTBEESPORT DAM
FACT FILE – Hartbeespoort Dam area 2527 DB.
Hartbeespoort Dam has mushroomed in the last few years. What was once referred to as
Hartbeespoort Dam, is now a collection of suburbs that include Schoemansville – the
original town – as well as Kosmos, Meerhof, Melodie and Ifafi.
[Source: <www.en.climate-data.org>]
Copyright reserved Please turn over
(EC/NOVEMBER 2020) GEOGRAPHY P2 (ANNEXURE) 7
FIGURE 3.6: HARTBEESPOORT DAM WALL
Copyright reserved Please turn over
NATIONAL
SENIOR CERTIFICATE
GRADE 11
NOVEMBER 2020
GEOGRAPHY P2
MARKING GUIDELINE
EXEMPLAR
MARKS: 150
This marking guideline consists of 9 pages.
2 GEOGRAPHY P2 (EC/NOVEMBER 2020)
SECTION A: DEVELOPMENT GEOGRAPHY, RESOURCES AND
SUSTAINABILITY
QUESTION 1
1.1 1.1.1 north (1)
1.1.2 LEDCs (1)
1.1.3 Rostow (1)
1.1.4 global (1)
1.1.5 Bottom up
1.1.6 economy and environment (1)
1.1.7 MEDC (1) (7 x 1) (7)
1.2 1.2.1 C (Oil) (1)
1.2.2 D (humanitarian) (1)
1.2.3 B (Manufacturing (1)
1.2.4 A (Trade barriers) (1)
1.2.5 C (0,21) (1)
1.2.6 C (free trade) (1)
1.2.7 B (Balance of trade) (1)
1.2.8 C (China) (1) (8 x 1) (8)
1.3 1.3.1 An economic indicator that shows how wealth is shared in a
country (1)
[CONCEPT]
(1 x 1) (1)
1.3.2 It shows all the wealth/money in the country in the hands of one
person (1)
Most of the people in the cartoon want this to change (1)
The rich person literally hands out change (1)
[ANY ONE]
(1 x 1) (1)
1.3.3 Closer to one (1) (1 x 1) (1)
1.3.4 Creation of more jobs (2)
Upliftment of skills (2)
An adjustment to disparity in salaries (2)
Improved salary adjustments to be in sync with the CPI
Profit sharing in companies (2)
[ANY THREE]
(3 x 2) (6)
Copyright reserved Please turn over
(EC/NOVEMBER 2020) GEOGRAPHY P2 3
1.3.5 More people living in an urban area is a source of skilled and unskilled
labour (2)
A higher ratio of people living in urban areas rather than rural areas
will contribute more to the GDP of a country if they are formally
employed in the secondary, tertiary and quaternary sector (2)
High education and literacy levels allow a country to embrace
globalisation and its associated technology (2)
High education and literacy levels add to the skills base of a country
and attracts foreign investment (2)
Good water and electricity services also encourages the development
of the secondary, tertiary and economic sectors of the economy (2)
Efficient and a high quality of healthcare also protects the workforce of
a country (2)
[ANY THREE]
(3 x 2) (6)
1.4 1.4.1 ‘... that respects no borders’ (1)
Globalisation opened borders and allowed freedom of movement (1)
[ANY ONE]
(1 x 1) (1)
1.4.2 ‘... has lowered costs and facilitated specialisation associated with
presumed competitive advantages’ (1) (1 x 1) (1)
1.4.3 Boeing 787 Dreamliner (1) (1 x 1) (1)
1.4.4 MNCs would not be able to able to manufacture products as they rely
on specialisation (manufacturing) in different countries (2)
Costs would increase and profits decrease (2)
Businesses all over the world would close temporarily, hence no
profits (2)
Increased costs incurred because of employee benefits / pay-outs (2)
Jobs in host countries / headquarters would also be lost (2)
Profits would also not increase after the pandemic as many people do
not have the buying power anymore (2)
[ANY TWO]
(2 x 2) (4)
1.4.5 It has encouraged the liberalisation of trade / flow of international
commodities (2)
Borders have become more open allowing free movement of
ideas (2)
Global governance like the World Trade Organisation (WTO) have
integrated developing countries into world trading and economic
systems (2)
Globalisation has enabled the formation of trading blocs (2)
Multinational corporations operate globally creating jobs and
generating profits (2)
Production has been stimulated and countries have expanded their
economies (2)
A global workforce has facilitated an exchange of skills (2)
[ANY FOUR]
(4 x 2) (8)
Copyright reserved Please turn over
4 GEOGRAPHY P2 (EC/NOVEMBER 2020)
1.5 1.5.1 Rural (1) (1 x 1) (1)
1.5.2 Veronica is in a position to employ other villagers thereby raising their
standard of living (2)
Her increased income also means that she can support the local
businesses to a greater extent (2) (2 x 2) (4)
1.5.3 Has a better house (2)
All her children are enrolled in school (2)
She spends less time collecting water (2)
[ANY TWO]
(2 x 2) (4)
1.5.4 Treadle pump is easy to use (2)
Saves time and labour so larger areas can be cultivated (2)
Easy to transport (2)
Light enough for both males and females (2)
Produced locally (2)
[ANY THREE]
(3 x 2) (6)
[60]
QUESTION 2
2.1 2.1.1 C (Koeberg) (1)
2.1.2 B (renewable) (1)
2.1.3 C (Eskom) (1)
2.1.4 C (carbon footprint) (1)
2.1.5 D (Kyoto Protocol) (1)
2.1.6 B (geothermal) (1)
2.1.7 C (Uranium) (1) (7 x 1) (7)
2.2 2.2.1 R (1)
2.2.2 gentle (1)
2.2.3 human (1)
2.2.4 parent material (1)
2.2.5 topsoil (1)
2.2.6 water (1)
2.2.7 Renewable (1)
2.2.8 regolith (1) (8 x 1) (8)
Copyright reserved Please turn over
(EC/NOVEMBER 2020) GEOGRAPHY P2 5
2.3 2.3.1 Trees (1) (1 x 1) (1)
2.3.2 To make space for buildings (accept examples) (1)
Infrastructure (accept examples) (1) (2 x 1) (2)
2.3.3 Decreases oxygen (1)
Increases carbon dioxide (1)
Increases run off (1)
Increases infiltration (1)
Destroys aesthetic beauty (1)
[ANY TWO]
(2 x 1) (2)
2.3.4 It provides more space for development (buildings, infrastructure etc.)
in a country (2)
This creates jobs / multiplier effect (2)
There will be increased production and more sales (2)
More trade is generated and there will be more profits (2)
[ANY TWO]
(2 x 2) (4)
2.3.5 Any new development requires an environmental impact assessment
(EIA) (2)
Education in environmental awareness (2)
Buffer zones (greenbelts) to control uncontrolled urban expansion (2)
Strategies to decrease birth rates (2)
To reduce rural-urban migration (accept examples) (2)
[ANY THREE]
(3 x 2) (6)
2.4 2.4.1 46% (1) (1 x 1) (1)
2.4.2 nuclear (1)
hydro (1)
gas (1)
[ANY TWO]
(2 x 1) (2)
2.4.3 It is still readily available as a natural resource in South Africa (2)
Coal mining provides jobs (2)
Large amounts of money have been invested in coal mines / power
stations (2)
Non-conventional energy sources incur extra costs (2)
[ANY TWO]
(2 x 1) (2)
Copyright reserved Please turn over
6 GEOGRAPHY P2 (EC/NOVEMBER 2020)
2.4.4 It will cause environmental despoliation (2)
Dumping near coal mines would cause land degradation (2)
Process of mining coal and power stations would release methane
and harmful chemicals into the atmosphere (2)
Acid rain would be a consequence of releasing nitrogen oxide into the
atmosphere (2)
Dust particles and coal ash are emitted from power stations (2)
[ANY TWO]
(2 x 2) (4)
2.4.5 Nuclear power stations are expensive to build (2)
Storing of nuclear waste is expensive (2)
Earthquakes and terrorism can cause radioactive spillage (2)
Human safety is an issue; accidents can occur that will result in
deaths (2)
Uranium is a non-renewable resource (2)
Coal is readily available which makes nuclear energy an unnecessary
expense (2)
[ANY THREE]
(3 x 2) (6)
2.5.1 They are energy sources that are renewable / energy sources that are
new and alternative (1)
[CONCEPT]
(1 x 1) (1)
2.5.2 Sunlight (1)
Kite (indicates wind) (1) (2 x 1) (2)
2.5.3 It is an alternative to both coal and nuclear power (1)
It will diversify and add much needed energy to the electricity grid (1)
It is clean and will reduce South Africa’s carbon emissions (1)
Photovoltaic panels can be supplied to rural areas which are not on the
electricity grid (1)
[ANY TWO]
(2 x 1) (2)
2.5.4 Turning rotor blades can kill birds, bats, insects (2)
This affects ecosystems and can reduce the biodiversity of the area (2)
It causes noise which can spoil the aesthetic beauty of the
environment (2)
[ANY ONE]
(1 x 2) (2)
Copyright reserved Please turn over
(EC/NOVEMBER 2020) GEOGRAPHY P2 7
2.5.5 NEGATIVE
The initial cost of installation is expensive as parts have to be
imported (2)
In most cases skilled people from overseas need to oversee the
operations, which is expensive (2)
A huge proportion of the South African labour market would be
excluded from these jobs as they are unskilled (2)
Wind and solar energy are unreliable as they both depend daily on
huge amounts of sunshine and wind (2)
Only certain areas in South Africa would then be able to have access
to non-conventional sources of energy (2)
Increased reliance on non-conventional energy sources would
decrease the demand for coal and cause mines to shut down (2)
This will cause high unemployment in the mines and associated link
industries that process coal, like power stations (2)
POSITIVE
The initial cost of installation is expensive but the running costs
afterwards is cheaper than being reliant on coal (2)
The sources for non-conventional use of energy is renewable and
cheaper (2)
It will create more employment opportunities (2)
It will broaden the skills base of the country’s labour force (2)
An increase in the use of non-conventional sources of energy
decreases dependency on oil and hence the price drops (2)
Energy can be sourced to remote rural areas, stimulating the
economy of these areas (2)
There will be less load-shedding, thus boosting businesses (2)
[CANDIDATES MUST REFER TO BOTH POSTIVE AND NEGATIVE
IMPACT]
[ANY FOUR]
(4 x 2) (8)
[60]
Copyright reserved Please turn over
8 GEOGRAPHY P2 (EC/NOVEMBER 2020)
SECTION B: GEOGRAPHICAL SKILLS AND TECHNIQUES
QUESTION 3
3.1 3.1.1 One centimetre on the map represents 50 000 cm in reality 3 (1 x 1) (1)
3.1.2 4,9 3cm x 0,5 = 2,45 km OR 4,9 3cm ÷ 2 = 2,45 km
[Range 4,8 – 5,0]
= 2 450 metres 3 (2 x 1) (2)
[Range 2 400 – 2 500]
3.2 3.2.1 The difference in years: 2020 – 2012 = 8 3 years
Mean annual change: 5' 3 W
Total change: 8 x 5' W = 40' 3 W
Magnetic declination for 2020: 15°24' W + 340' W = 16 °04ʹ W 3
(5 x 1) (5)
3.2.2 2020 is bigger 3
16°04’ W is bigger than 15°24’ W 3
[ANY ONE]
(1 x 1) (1)
3.2.3 The mean annual change in the magnetic declination is West 9 (1 x 1) (1)
MAP INTERPRETATION
3.3 3.3.1 A (1)
3.3.2 C (1)
3.3.3 C (1) (3 x 1) (3)
3.4 Mountainous landscape 33
Protected area (Nature reserve) 33
Caravan park / camp sites / holiday resorts (Lekkersukkel) 33
Dam – rafting / canoeing / fishing / sailing / yachting / dam wall 33
Snake park 33
Brits tunnel 33
[ANY TWO]
(2 x 2) (4)
Copyright reserved Please turn over
(EC/NOVEMBER 2020) GEOGRAPHY P2 9
3.5 3.5.1 Soil erosion (1) (1 x 1) (1)
3.5.2 Contour ploughing (2)
Strip cropping (2)
Aforestation (2)
Not ploughing on steep slopes (2)
Crop rotation (2)
Windbreaks (2)
Fallowing (2)
Filling in dongas (2)
Avoid overgrazing (2)
Fertilisers (2)
Vegetation along rivers (2)
Retain soil cover – dry season (2)
[ANY TWO]
(2 x 2) (4)
GEOGRAPHICAL INFORMATION SYSTEMS (GIS)
3.6 3.6.1 Raster (1) (1 x 1) (1)
3.6.2 Shows graphics as rows and columns of tiny rectangular pixels to form
a grid (2) (1 x 2) (2)
3.6.3 Line (1) (1 x 1) (1)
3.7 3.7.1 Low (1)
Reason:
The larger the size of a grid cell, the worse its resolution and less
accuracy (2)
Fewer pixels have been used, thus the orthophoto map is not
very clear (2)
The features on the orthophoto map are not very clear/fuzzy (2)
Less detail about the surroundings of buildings can be obtained (2)
[ANY ONE]
(1 + 1 x 2) (3)
3.7.2 Weather conditions (accept examples) (1)
Focusing (1)
Number / size of pixels (1)
Shadows (1)
Equipment (accept examples) (1)
Air pollution (1)
Distance (1)
Angle at which image is captured (1)
Scale (1)
[ANY ONE]
(1 x 1) (1)
[30]
GRAND TOTAL: 150
Copyright reserved Please turn over
Study this subject
Recommended for this subject
Memorandum
Geography Grade 11 P2 National Exemplar November 2020 Memo
Addendum
Geography Grade 11 P2 2020 Addendum (Eng)
Question paper
Geography Grade 11 P2 National Exemplar November 2020 QP
Memorandum
Geography Grade 11 P1 National Exemplar November 2020 Memo
Memorandum
Geography Grade 11 P1 National Exemplar November 2020 Memo
Memorandum
Geography Grade 11 P1 National Exemplar November 2020 Memo
More from Grade 11 Geography
Question paper
Geography Grade 11 P1 Eastern Cape November 2025 QP (Eng)
Question paper
Geography Grade 11 P2 Eastern Cape November 2025 QP
Question paper and memo
Geography Grade 11 Free State March Test 2025 Paper & Memo
Question paper
Geography Grade 11 P1 Eastern Cape November 2024 QP (Afr)
Question paper
Geography Grade 11 P2 Eastern Cape November 2024 QP (Eng)
Question paper