
NATIONAL
SENIOR CERTIFICATE
GRADE 11
NOVEMBER 2020
GEOGRAPHY P1
EXEMPLAR
MARKS: 150
TIME: 3 hours
This question paper consists of 9 pages.
Skip to contentAll 2020 papers 
View all


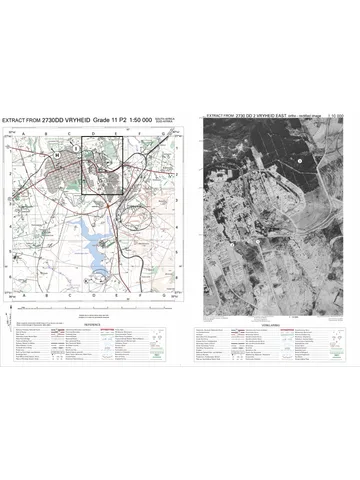
Geography Grade 11 P1 National Exemplar November 2020 QP
Grade 11 Geography Paper 1 question paper from the National Exemplar November Exam 2020 (English), 9 pages. Read online or download the free PDF.
Geography · Grade 11 · National Exemplar November Exam · 2020 · English. Question paper, 9 pages. Read online or download the PDF.
- Subject
- Geography
- Grade
- Grade 11
- Language
- English
- Document type
- Question paper
- Year
- 2020
- Exam period
- National Exemplar November Exam
- Paper
- 1
- Curriculum
- CAPS
- Pages
- 9
- File size
- 519.2 KB
Free to read online, no sign-up needed
Loading document…
Loading document…
1 of 9
This exam
National Exemplar November Exam 2020
- Paper 1Question paper · EngQuestion paper · Eng (2)Question paper · AfrQuestion paper · Afr (2)Addendum · EngAddendum · Eng (2)Addendum · AfrAddendum · Afr (2)Memo · EngMemo · Eng (2)Memo · Eng (3)Memo · Eng (4)Memo · AfrMemo · Afr (2)Memo · Afr (3)Memo · Afr (4)
- Paper 2Question paper · EngQuestion paper · Eng (2)Question paper · AfrQuestion paper · Afr (2)Addendum · EngAddendum · Eng (2)Addendum · AfrAddendum · Afr (2)Memo · EngMemo · Eng (2)Memo · Eng (3)Memo · Eng (4)Memo · AfrMemo · Afr (2)Memo · Afr (3)
Document textSearch extracted text and jump to a page.
2 GEOGRAPHY P1 (EC/NOVEMBER 2020)
INSTRUCTIONS AND INFORMATION
1. The question paper consists of three questions.
2. All diagrams are included in the ANNEXURE.
3. Where possible, illustrate your answers with labelled diagrams.
4. Leave a line between subsections of questions answered.
5. Start EACH question at the top of a new page of a NEW page.
6. Number the questions correctly according to the numbering system used in
this question paper.
7. Do NOT write in the margins of the ANSWER BOOK.
8. In SECTION B you are provided with a 1 : 50 000 topographic map
(2527 BD HARTBEESPOORT DAM) and an orthophoto map of a part of the
mapped area.
9. Show ALL calculations and use the formulae provided, where applicable.
Marks will be allocated for these.
10. Indicate the unit of measurement in the final answer of calculations, for
example 10 km; 2,1 cm.
11. You may use a non-programmable calculator and a magnifying glass.
12. The area demarcated in RED and BLACK on the topographic map
represents the area covered by the orthophoto map.
13. Write neatly and legibly.
Copyright reserved Please turn over.
(EC/NOVEMBER 2020) GEOGRAPHY P1 3
SECTION A: THE ATMOSPHERE AND GEOMORPHOLOGY
QUESTION 1
1.1 Choose a term in COLUMN B that matches the description in COLUMN A.
Write only the letter (A–I) next to the question numbers (1.1.1 to 1.1.8) in the
ANSWER BOOK, for example 1.1.9 J.
COLUMN A COLUMN B
1.1.1 Determines the amount of insolation A Mozambique
that the earth receives
1.1.2 The force that causes air to move from B geostrophic
a high pressure to a low pressure
1.1.3 Rotational force that deflects winds C offshore
1.1.4 Wind that brings heavy rains to India D latitude
in summer
1.1.5 Wind that flows parallel to the lines of E pressure gradient
the isobars
1.1.6 Wind that blows from the land to the F coriolis
sea
1.1.7 Ocean current that originates at the G monsoon
poles
1.1.8 Contact zone of polar air with warm H front
tropical air
I Benguela
(8 x 1) (8)
Copyright reserved Please turn over
4 GEOGRAPHY P1 (EC/NOVEMBER 2020)
1.2 Refer to FIGURE 1.2 on tri-cellular air circulation. Match the descriptions
below with one of the POLAR, HADLEY or FERREL cells. Choose the answer
and write only the cell next to the question numbers (1.2.1 to 1.2.7) in the
ANSWER BOOK, for example 1.2.8 POLAR. You may choose the same cell
more than once.
1.2.1 Circulates air between 60̊–90̊ latitudes
1.2.2 Air rises near the equator and diverges polewards
1.2.3 Air circulation is in the mid-latitudes
1.2.4 Associated with tropical air mass circulation
1.2.5 Cold easterly winds originate in this cell
1.2.6 This cell generates the westerly wind belt
1.2.7 Trade winds originate in this cell (7 x 1) (7)
1.3 FIGURE 1.3 is a representation of a Föhn wind.
1.3.1 Why is a Föhn wind an example of a regional wind? (1 x 1) (1)
1.3.2 Name the side of the mountain at A, in the formation of Föhn winds.
(1 x 1) (1)
1.3.3 Why does rain occur at A? (1 x 1) (1)
1.3.4 Discuss why the air descending at B will be warm and dry. (2 x 2) (4)
1.3.5 In a paragraph of approximately EIGHT lines, explain the impact that
the descending air at B will have on people living on that side of the
mountain. (4 x 2) (8)
1.4 Refer to FIGURE 1.4 which illustrates the La Niña process.
1.4.1 Why is the La Niña process described as a weather pattern? (1 x 1) (1)
1.4.2 State TWO pieces of evidence from FIGURE 1.4 that indicate that the
La Niña process is being illustrated. (2 x 1) (2)
1.4.3 Discuss why the eastern half of Australia would receive heavy rain
during the La Niña process. (3 x 2) (6)
1.4.4 Explain the economic impact that the La Niña process would have on
Africa. (3 x 2) (6)
Copyright reserved Please turn over.
(EC/NOVEMBER 2020) GEOGRAPHY P1 5
1.5 Refer to FIGURE 1.5, an extract on desertification.
1.5.1 According to FIGURE 1.5, what is the main aim of the green belt
project? (1 x 1) (1)
1.5.2 What is desertification? (1 x 1) (1)
1.5.3 Quote a statement from the extract that lists possible natural causes
of desertification. (1 x 1) (1)
1.5.4 Name TWO human activities that contribute to desertification.
(2 x 1) (2)
1.5.5 Discuss how the planting of trees can ‘serve as a buffer zone’ to
manage desertification. (1 x 2) (2)
1.5.6 Besides afforestation (planting of trees), explain TWO other ways in
which desertification can be managed. (2 x 2) (4)
1.5.7 Comment on the positive impact that the green belt project would
have on people living in this region. (2 x 2) (4)
[60]
Copyright reserved Please turn over
6 GEOGRAPHY P1 (EC/NOVEMBER 2020)
QUESTION 2
2.1 Choose a term in COLUMN B that matches the description of topography
associated with the inclined strata in COLUMN A. Write only the letter (A–H)
next to the question numbers (2.1.1 to 2.1.7) in the ANSWER BOOK, for
example 2.2.8 I.
COLUMN A COLUMN B
2.1.1 Scarp slope faces inwards and the dip A homoclinal shifting
slope outwards
2.1.2 Steep slope of a homoclinal ridge B cuesta
2.1.3 Dipping strata is more than 45° C cuesta dome
2.1.4 Gentle slope of a homoclinal ridge D scarp
2.1.5 Yields groundwater if rocks are E dip
permeable
2.1.6 Describes asymmetrical ridges F cuesta basin
2.1.7 Dipping strata lies at an angle of 10°–25° G hogsback
H homoclinal ridge
(7 x 1) (7)
2.2 Refer to FIGURE 2.2 which shows different types of mass movement. Match the
descriptions below with the kinds of mass movement in the sketch. Choose the
answer and write only the kind of mass movement next to the question numbers
(2.2.1 to 2.2.8) in the ANSWER BOOK, for example 2.1.9 soil creep. You may
choose the same kind of mass movement more than once.
2.2.1 Rapid flows of mixtures of rock or soil and water
2.2.2 Curved tree trunks and tilted fences are the effects
2.2.3 Most rapid kind of mass movement
2.2.4 Common in arid and semi-arid regions
2.2.5 Earthquakes can trigger this kind of mass movement
2.2.6 Slowest kind of mass movement
2.2.7 A combination of slumps and debris flow
2.2.8 Originates at steep cliff faces (8 x 1) (8)
Copyright reserved Please turn over.
(EC/NOVEMBER 2020) GEOGRAPHY P1 7
2.3 Study FIGURE 2.3 showing a canyon landscape.
2.3.1 State evidence from the sketch to justify that this landscape
developed from strata of unequal resistance to erosion. (1 x 1) (1)
2.3.2 Describe the climate of this canyon landscape as depicted by
FIGURE 2.3. (1 x 1) (1)
2.3.3 Name ONE advantage of this canyon landscape for human activity.
(1 x 1) (1)
2.3.4 Discuss the role of the river in the sketch in the formation of canyon
landscapes. (2 x 2) (4)
2.3.5 In a paragraph of approximately EIGHT lines, explain how Karoo
landforms develop from a canyon landscape. (4 x 2) (8)
2.4 FIGURE 2.4 shows tors.
2.4.1 What are tors? (1 x 1) (1)
2.4.2 Name the rock type from which tors develop, evident in the sketch.
(1 x 1) (1)
2.4.3 State the igneous intrusion from which tors would originate. (1 x 1) (1)
2.4.4 Discuss the role that igneous intrusions play in the formation of tors.
(2 x 2) (4)
2.4.5 In a paragraph of approximately EIGHT lines, explain the formation of
tors. (4 x 2) (8)
2.5 Refer to FIGURE 2.5 which shows the typical slope elements/forms
associated with a slope.
2.5.1 Identify the slope elements/forms labelled A, B, C and D. (4 x 1) (4)
2.5.2 Give ONE characteristic of each of the slope elements/forms labelled
A and C. (1 + 1) (2)
2.5.3 Which slope element is best suited for crop farming? Give a reason
for your answer. (1 + 2) (3)
2.5.4 “Slopes provide a valuable piece of land for mankind.”
Discuss the significance of slopes for human activity. (3 x 2) (6)
[60]
Copyright reserved Please turn over
8 GEOGRAPHY P1 (EC/NOVEMBER 2020)
SECTION B: GEOGRAPHICAL SKILLS AND TECHNIQUES
The questions below are based on the 1 : 50 000 topographical map 2527 DB
HATBEESPOORT DAM, as well as the orthophoto map of a part of the mapped
area.
QUESTION 3
3.1 Refer to the line that runs from M (block B5) to N (block A5) of the aerial
cableway on the topographical map.
3.1.1 Calculate the average gradient of the cableway from M (contour
reading 1 235 m) to the top at N (trigonometrical beacon 66). Show ALL
calculations. Marks will be awarded for calculations.
Vertical interval (VI)
Formula: Gradient = Horizontal equivalent (HE)
(5 x 1) (5)
3.2 FIGURE 3.2 is a cross-section of the climb between 3 and 4 on the orthophoto
map.
3.2.1 Calculate the vertical exaggeration of the cross-section. Show all your
calculations.
Vertical Scale (VS)
Formula: Vertical exaggeration = Horizontal Scale (HS)
(4 x 1) (4)
3.2.2 Give ONE reason why there is intervisibility between 3 and 4. (1 x 1) (1)
MAP INTERPRETATION
3.3 Various options are provided as possible answers to the following questions.
Choose the answer and write only the letter (A–D) in your ANSWERBOOK.
3.3.1 The human-made feature 2 on the orthophoto map is a …
A dam.
B reservoir.
C building.
D water tower.
3.3.2 The feature found at 6 on the orthophoto map is a …
A hospital.
B school.
C dam.
D prison.
Copyright reserved Please turn over.
(EC/NOVEMBER 2020) GEOGRAPHY P1 9
3.3.3 The shadows on the slope below 4 on the orthophoto map are found
in the south-west, indicating that the photograph was taken at …
A 08:00.
B 10:00.
C 16:00.
D 14:00. (3 x 1) (3)
3.4 Refer to the oblique photograph which was taken from N in block A5 on the
topographical map.
3.4.1 Is this photograph high or low oblique? (1 x 1) (1)
3.4.2 In what direction was the camera pointing when this photograph was
taken? (1 x 2) (2)
3.4.3 Identify the holiday resort at A. (1 x 1) (1)
3.5 Refer to blocks B3/4 on the topographical map and photograph in
QUESTION 3.5.
3.5.1 Does the mapped area indicate a cuesta or hogsback landscape?
Support your answer with evidence from the topographical map.
(1 + 2) (3)
3.5.2 Why is there no development taking place on the lower slopes
above Schoemansville? (1 x 2) (2)
GEOGRAPHICAL INFORMATION SYSTEMS (GIS)
3.6 You are currently doing an urban study of Ifafi in block C5 on the
topographical map and you are using paper GIS to assist with the analysis
of the area.
3.6.1 What GIS process would be used to produce the paper GIS? (1 x 1) (1)
3.6.2 Identify TWO different layers you would use when analysing the
suburban area of Ifafi. (2 x 1) (2)
3.6.3 Give ONE example of spatial data found in block C5. (1 x 1) (1)
3.6.4 Recently many of the residents of Ifafi have been complaining about
water pollution. Explain how you could use GIS to try and assist the
residents to find a solution to the problem. (2 x 2) (4)
[30]
GRAND TOTAL: 150
Copyright reserved Please turn over
Study this subject
Recommended for this subject
Question paper
Geography Grade 11 P1 Eastern Cape November 2020 QP (Eng)
Question paper
Geography Grade 11 P1 National Exemplar November 2020 QP
Addendum
Geography Grade 11 P2 2020 Addendum (Eng)
Addendum
Geography Grade 11 P1 Eastern Cape November 2020 Addendum
Memorandum
Geography Grade 11 P1 Eastern Cape November 2020 Memo (Eng)
Addendum
Geography Grade 11 P1 2020 Addendum (Afr)
More from Grade 11 Geography
Memorandum
Geography Grade 11 P1 Eastern Cape November 2025 Memo (Eng)
Memorandum
Geography Grade 11 P2 Eastern Cape November 2025 Memo (Eng)
Question paper and memo
Geography Grade 11 Free State March Test 2025 Paper & Memo
Memorandum
Geography Grade 11 P1 Eastern Cape November 2024 Memo (Afr)
Memorandum
Geography Grade 11 P1 Eastern Cape November 2023 Memo (Eng)
Question paper