
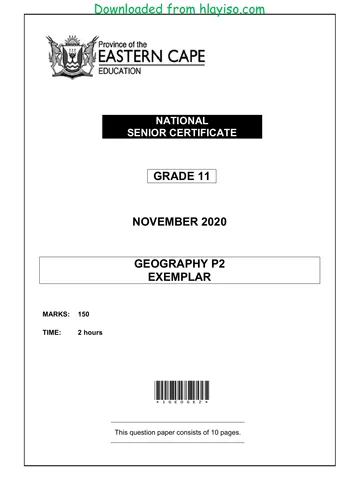
NATIONAL
SENIOR CERTIFICATE
GRADE 11
NOVEMBER 2020
GEOGRAPHY P2
EXEMPLAR
MARKS: 150
TIME: 2 hours
*IGEOGE2*
This question paper consists of 10 pages.
You're offline
Skip to contentQuestion paper 
View all
GEOGRAPHY P2 QP GR11 NOV2020 Eng D
Geography · Grade 11 · National Exemplar November Exam · 2020. Question paper, 10 pages. Read online or download the PDF.
- Subject
- Geography
- Grade
- Grade 11
- Document type
- Question paper
- Year
- 2020
- Exam period
- National Exemplar November Exam
- Paper
- 2
- Pages
- 10
- File size
- 184.0 KB
Loading document…
Loading document…
1 of 10
Document textSearch extracted text and jump to a page.
2 GEOGRAPHY P2 (EC/NOVEMBER 2020)
INSTRUCTIONS AND INFORMATION
1. This question paper consists of THREE questions.
2. All diagrams are included in the ANNEXURE.
3. Where possible, illustrate your answers with labelled diagrams.
4. Leave a line between subsections of questions answered.
5. Start EACH question at the top of a NEW page.
6. Number the questions correctly according to the numbering system used in
this question paper.
7. Do NOT write in the margins of the ANSWER BOOK.
8. In SECTION B you are provided with a 1 : 50 000 topographical map
(2527BD HARTBEESPOORT DAM) and an orthophoto map of a part of the
mapped area.
9. Show ALL calculations and formulae, where applicable. Marks will be
allocated for these.
10. Indicate the unit of measurement in the final answer of calculations,
e.g. 10 km; 2,1 cm.
11. You may use a non-programmable calculator and a magnifying glass.
12. The area demarcated in RED and BLACK on the topographical map
represents the area covered by the orthophoto map.
13. Write neatly and legibly.
Copyright reserved Please turn over
(EC/NOVEMBER 2020) GEOGRAPHY P2 3
SECTION A: DEVELOPMENT GEOGRAPHY, RESOURCES AND
SUSTAINABILITY
QUESTION 1
1.1 Choose the correct word(s) from those given in brackets which will make each
statement geographically CORRECT. Write only the word(s) next to the
question numbers (1.1.1–1.1.8).
1.1.1 According to the Brandt report, 80% of the world’s income is earned in
the (north/south).
1.1.2 (MEDCs/LEDCs) export mainly raw materials.
1.1.3 A limitation of (Rostow’s/Friedman’s) model is that it does not take
population growth rate into consideration.
1.1.4 Finding a vaccine for the coronavirus (COVID-19) is an example of
development from a (regional/global) context.
1.1.5 (Top down/Bottom up) approach is often a more successful approach
in community-based development.
1.1.6 The sustainability model involves the (core and periphery/economy and
environment).
1.1.7 Development in (MEDC/LEDC) countries is achieved by a market
economy. (7 x 1) (7)
1.2 Various options are provided as possible answers to the following questions.
Choose the answer and write only the letter (A–D) next to the question numbers
(1.2.1–1.2.8) in the ANSWER BOOK, for example 1.2.9 A.
1.2.1 … is the world’s most traded commodity.
A Cotton
B Wheat
C Oil
D Gold
1.2.2 Aid from donor countries that includes masks and ventilators in times
of a medical crisis, is an example of … aid.
A technical
B conditional
C export
D humanitarian
1.2.3 … forms the basis of an export-led approach to development.
A Technology
B Manufacturing
C Mining
D Construction
Copyright reserved Please turn over
4 GEOGRAPHY P2 (EC/NOVEMBER 2020)
1.2.4 … is/are an example of a trading relationship that protects local
products from foreign competition.
A Trade barriers
B Free trade
C Fair trade
D Unfair trade
1.2.5 A Gender Inequality Index (GII) of … indicates more equality among
males and females.
A 0,83
B 0,48
C 0,21
D 0,64
1.2.6 Trade blocs encourage …
A fair trade
B unfair trade.
C free trade.
D trade barriers.
1.2.7 … describes the relationship between the value of a country’s exports
and imports.
A Terms of trade
B Balance of trade
C Balance of payments
D Gross national product
1.2.8 … is the world’s fastest developing economy.
A South Africa
B Japan
C China
D India (8 x 1) (8)
Copyright reserved Please turn over
(EC/NOVEMBER 2020) GEOGRAPHY P2 5
1.3 Refer to the cartoon in FIGURE 1.3 showing an economic indicator of
development.
1.3.1 What is the Gini coefficient? (1 x 1) (1)
1.3.2 How does the cartoon portray the Gini coefficient? (1 x 1) (1)
1.3.3 Would the Gini coefficient in this cartoon show a statistical score closer
to zero (0) or one (1)? (1 x 1) (1)
1.3.4 Discuss THREE ways in which a country can improve on sharing
wealth in a country. (3 x 2) (6)
1.3.5 Explain how THREE positive demographic indicators can show an
improvement of the economic level of development in a country.(3 x 2) (6)
1.4 Read the article in FIGURE 1.4 referring to globalisation.
1.4.1 According to the article, how did globalisation aid in the spread of the
COVID-19 pandemic? (1 x 1) (1)
1.4.2 Quote ONE advantage of globalisation from the article. (1 x 1) (1)
1.4.3 Name ONE example of a multinational corporation (MNC) in the
article. (1 x 1) (1)
1.4.4 Discuss how the COVID-19 pandemic would be a disadvantage to
multinational corporations (MNCs). (2 x 2) (4)
1.4.5 Write a paragraph of approximately EIGHT lines explaining why
globalisation is still viewed as the main stimulus of economic growth in
the world. (4 x 2) (8)
1.5 Read the case study in FIGURE 1.5 on community development in Zambia and
answer the questions that follow.
1.5.1 State whether the case study refers to rural or urban community
development. (1 x 1) (1)
1.5.2 Describe TWO examples to prove that Veronica’s quality of life has
improved. (2 x 2) (4)
1.5.3 The improved quality of life for these individuals will probably have
positive ripple effects in their community. Suggest TWO positive ripple
effect for Veronica’s community. (2 x 2) (4)
1.5.4 Describe THREE advantages of using this type of technology referred
to in the case study. (3 x 2) (6)
[60]
Copyright reserved Please turn over
6 GEOGRAPHY P2 (EC/NOVEMBER 2020)
QUESTION 2
2.1 Various options are provided as possible answers to the following questions.
Choose the answer and write only the letter (A–D) next to the question numbers
(2.1.1–2.1.7) in the ANSWER BOOK, for example 2.1.8 A.
2.1.1 ... is the only commercial nuclear power station in South Africa.
A Kusile
B Arnot
C Koeberg
D Lethabo
2.1.2 Green energy is ...
A produced from fossil fuels.
B renewable.
C non-renewable.
D a product from greenhouse gases.
2.1.3 ... is the power utility producing most of South Africa’s electrical energy.
A Telkom
B Sasol
C Eskom
D Koeberg
2.1.4 The amount of carbon dioxide emitted into the atmosphere by an
individual is referred to as ...
A greenhouse footprint.
B green movement.
C carbon footprint.
D environmental footprint.
2.1.5 The ... signed in 1997 requires countries to reduce the amount of their
greenhouse gas emissions.
A Paris accord
B COP 17
C BRICS treaty
D Kyoto Protocol
2.1.6 Energy gained from hot rocks below the earth’s surface is called ...
energy.
A biomass
B geothermal
C wind
D biofuel
Copyright reserved Please turn over
(EC/NOVEMBER 2020) GEOGRAPHY P2 7
2.1.7 ... is the mineral needed for the generation of nuclear power.
A Coal
B Gold
C Uranium
D Platinum (7 x 1) (7)
2.2 Choose the correct word(s) from those given in brackets which will make each
statement geographically CORRECT. Write only the word(s) next to the
question numbers (2.2.1–2.2.8).
2.2.1 The (D/R) horizon is the deepest soil horizon in the soil profile.
2.2.2 A (steep/gentle) topography results in well-drained and steeper soils.
2.2.3 Deforestation is a (human/physical) agent of erosion.
2.2.4 Soil colour is influenced by (time/parent material).
2.2.5 Humus content is mostly found in the (top soil/sub soil).
2.2.6 The main agent of soil erosion is (water/drought).
2.2.7 (Renewable/Non-renewable) resources are produced by nature
constantly.
2.2.8 Partially weathered rock material is found in the (regolith/subsoil).
(8 x 1) (8)
2.3 Refer to the cartoon in FIGURE 2.3 showing the relationship between
resources and economic development.
2.3.1 Name the natural resource being depleted in the cartoon. (1 x 1) (1)
2.3.2 According to the cartoon, why is this natural resource being depleted?
(2 x 1) (2)
2.3.3 How does the depletion of this natural resource affect the environment?
(2 x 1) (2)
2.3.4 Discuss the positive economic impact that the depletion of this resource
has for development in a country. (2 x 2) (4)
2.3.5 Explain how countries could implement more sustainable strategies to
protect their natural resources. (3 x 2) (6)
Copyright reserved Please turn over
8 GEOGRAPHY P2 (EC/NOVEMBER 2020)
2.4 Refer to FIGURE 2.4 showing South Africa’s energy plan.
2.4.1 What percentage of South Africa’s energy plan would coal make up
in 2030? (1 x 1) (1)
2.4.2 Name any TWO other conventional sources of energy that will be a
part of South Africa’s energy plan in 2030. (2 x 1) (2)
2.4.3 Why would South Africa still be so reliant on coal in 2030? (2 x 1) (2)
2.4.4 Discuss the impact that South Africa’s reliance on coal would have
on the environment. (2 x 2) (4)
2.4.5 Explain why nuclear energy would not play a major role in South
Africa’s energy plan in 2030. (3 x 2) (6)
2.5 Refer to FIGURE 2.5 which illustrates non-conventional sources of energy.
2.5.1 Why are solar and wind energy examples of non-conventional
sources of energy? (1 x 1) (1)
2.5.2 Give TWO pieces of evidence from the sketch to support the
statement that the source of non-conventional energy is relatively
cheap. (2 x 1) (2)
2.5 3 How can solar energy be advantageous to South Africa’s current
energy sources? (2 x 1) (2)
2.5.4 Describe the negative impact that wind turbines, used to generate
wind energy, have on the environment. (1 x 2) (2)
2.5.5 In a paragraph of approximately EIGHT lines, explain the impact of
the non-conventional sources of energy, depicted in the sketch, on
the economy of South Africa. (4 x 2) (8)
[60]
Copyright reserved Please turn over
(EC/NOVEMBER 2020) GEOGRAPHY P2 9
SECTION B: GEOGRAPHICAL SKILLS AND TECHNIQUES
The questions below are based on the 1 : 50 000 topographical map 2527 DB
HARTBEESPOORT DAM, as well as the orthophoto map of a part of the mapped
area.
3.1 3.1.1 The scale of the topographic map is 1 : 50 000. Write down the scale
as a word scale. (1 x 1) (1)
3.1.2 What is the straight-line distance from trigonometrical station 104 in
block C2 to spot height 1521 in block B3? Give your answer in
metres. (2 x 1) (2)
3.2 3.2.1 Calculate the magnetic declination of Hartbeespoort Dam for 2020.
Show ALL calculations. Marks will be awarded for calculations.
(5 x 1) (5)
3.2.2 Compare the magnetic declination for 2020 to the magnetic declination
for 2012 and indicate which one is bigger. (1 x 1) (1)
3.2.3 Motivate your answer to QUESTION 3.2.2. (1 x 1) (1)
3.3 3.3.1 The feature at 5 on the orthophoto map is/are a/an …
A rugby fields.
B tennis courts.
C open-parking area.
D purification plant.
3.3.2 The primary economic activity at P in block A1 is a/an …
A sports fields.
B excavations.
C cultivation.
D non-perennial river.
3.3.3 Identify the environmental factor affecting the area in block C5:
A River
B Dam
C Sewage works
D Road (3 x 1) (3)
Copyright reserved Please turn over
10 GEOGRAPHY P2 (EC/NOVEMBER 2020)
3.4 Refer to the FACT FILE (FIGURE 3.4) on the Hartbeespoort Dam and the
topographical map:
The Schoemansville town council has decided to try and improve the level of
development of this area through tourism. Discuss how the council would
promote this area using evidence from blocks B2 and B3. (2 x 2) (4)
3.5 Refer to block E1 on the topographical map.
3.5.1 Identify the environmental problem found in the area. (1 x 1) (1)
3.5.2 What TWO sustainable strategies can be implemented to prevent and
control the impact identified in QUESTION 3.5.1? (2 x 2) (4)
GEOGRAPHICAL INFORMATION SYSTEMS (GIS)
3.6 Refer to FIGURE 3.6 taken of the Hartbeespoort Dam found in block B2 on the
topographical map, and answer the following questions.
3.6.1 Is the photograph a raster or a vector image? (1 x 1) (1)
3.6.2 Give a reason for your answer to QUESTION 3.6.1. (1 x 2) (2)
3.6.3 What type of spatial object is the dam wall in block B2 on the
topographical map? (1 x 1) (1)
3.7 Refer to the orthophoto map.
3.7.1 Does the orthophoto map have a low or high resolution?
Give a reason for your answer. (1 + 1 x 2) (3)
3.7.2 Name ONE factor in the remote sensing process that will affect the
resolution of the orthophoto map. (1 x 1) (1)
[30]
GRAND TOTAL: 150
Copyright reserved Please turn over
Recommended for this subject
Published documents with matching subject and grade metadata.
Question paper
GEOGRAPHY P1 QP GR11 NOV 2025 ENG
Question paper
GEOGRAPHY P2 MAP 2529CC EMALAHLENI Nov 2025 Final
Question paper
GEOGRAPHY P2 GR11 QP NOV2024 ENG D
Question paper
NW 11 GEOGRAPHY P2 QP ENG NOV 2024
Question paper
GEOGRAPHY P2 GR11 QP NOV2023 Afrikaans hlayiso.com
Question paper
IMG 20231013 WA0020 hlayiso.com
Related documents
Matched using subject, grade, language, document type and exam metadata.
Question paper
GEOGRAPHY P2 QP GR11NOV2020 Afr D
Memorandum
GEOGRAPHY P2 QP ANNEX MEMO GR11NOV2020 Afr A
Memorandum
GEOGRAPHY P2 QP ANNEX MEMO GR11NOV2020 Afr D
Question paper
GEOGRAPHY P1 GR11 QP NOV2020 Afr D
Question paper
GEOGRAPHY P2 QP GR11 NOV2020 Eng D hlayiso.com
Addendum
GEOGRAPHY P1 GR11 ANNEXURE NOV2020 Afr D
More from Grade 11 Geography
Explore more published documents in this catalogue.
Memorandum
GEOGAPHY P1 MEMO GR11 NOV 2025 ENG
Memorandum
GEOGRAPHY P2 GR11 NOV2025 ENGLISH MARKING GUIDELINE
Question paper and memo
FS Geography Grade 11 March 2025 QP and Memo
Memorandum
GEOGRAPHY P1 MEMO GR11NOV 2024 AFR
Memorandum
GEOGRAPHY P1 MEMO GR11 NOV 2023 English hlayiso.com
Question paper